
A Project-based Creative Product Design Course using Learning
Management System
Janus S. Liang
National Taiwan Normal University, 162, Heping East Road Section 1, Taipei, Taiwan
Keywords: Creative Product Design, Project-based Approach, Learning Management System, Pedagogical Issues.
Abstract: This study presents an effective mode for creative product design learning through practical tasks generation
by learner groups in a face-to-face course. This mode integrates project-based learning, and learning
management techniques and tools. We include a quasi-experimental study in which the results of four
academic years are analyzed. In this study we analyze phases such as exam grades, exam dropout rates,
exam passing rates, and class attendance. Meanwhile, we also investigate the use of LMS, distinguishing
between informational use and communicational use. The predictive model further involves: utility, user
interface, subjective criterion, personal innovativeness in the domain of information technology and internal
ICT support at school aspect. Learners that followed this active learning approach gained better results than
those that followed a traditional strategy. In addition, the experience of the introduction of such a method in
a student subgroup positively influenced the whole group. Finally, information use was found to be a
precursor for communicational use, perceived user interface of the LMS is the strongest predictor in LMS
acceptation. Internal ICT support has a direct effect on the information use of the LMS and on subjective
criterion.
1 INTRODUCTION
Instructional methods traditionally used for
computer-aided creative product design involve
expositional lectures, and closed and hands-on
laboratories. We will refer to this as “traditional
mode” in the rest of the study. Nevertheless, some
researches proposed that this mode seems to be
problematic or even ineffective for the abstract and
complex domain of creative product design (Howard
et al., 2008; de Vere et al., 2010). One promising
method in this field is based on the development of
projects (Howard et al., 2008). Project-based
learning (PBL) is a constructivist pedagogy that
intends to bring about deep learning by allowing
learners to use an inquiry based approach to engage
with issues and questions that are rich, real and
relevant to the topic being studied. It is designed to
be used for complex issues that require learners to
investigate in order to understand (Barron, 1998).
Within this type of learning, learners are expected to
use technology in meaningful ways to help them
investigate or present their knowledge. Technology
is infused throughout the project to reflect the
emphasis on technological and academic content.
PBL framework differs from inquiry-based activity
in its emphasis on cooperation between team
members. Cooperation refers to the practice of
working in line with commonly agreed goals and
possible methods, instead of working separately in
competition. The several different approaches in
project-based learning (ChanLin, 2008), which differ
in project duration, number of team members, and in
the way the learners cooperate. In summary, there
are many benefits of PBL covered in the literature,
For example, the possibility of increasing
motivation, of connecting learning with reality,
promoting problem-solving and teamwork, among
others.
Project management is the application of
knowledge, techniques, skills, and tools to meet
project requirements (Project Management Institute,
2008). To integrate both perspectives of a project as
an effective creative product design learning
method, using PBL with aim of undertaking a
software project that covers all the activities. The
result of this integration should benefit from both
PBL techniques and professional practices.
Furthermore, we also organize, mange and controls
the development of project tasks and their
5
S. Liang J..
A Project-based Creative Product Design Course using Learning Management System.
DOI: 10.5220/0004304500050014
In Proceedings of the 5th International Conference on Computer Supported Education (CSEDU-2013), pages 5-14
ISBN: 978-989-8565-53-2
Copyright
c
2013 SCITEPRESS (Science and Technology Publications, Lda.)

deliverables through the adoption of learning
management systems (LMS) in a face-to-face
course, in order to reduce the management time. The
last objective is to investigate the results of two
academic years using PBL approach and the
technology acceptation of LMS.
2 COMPUTER’S ROLES:
COURSE SOFTWARE AND LMS
Several of the project tasks need the use of three
software programs for their development, computer-
aided design system, a text editor, and a data store
system. We present, in laboratories, their main
functions, accessible from the graphical tool
Management Studio. This makes it possible to deal
with physical design in a subsequent task. Through
the realization of these tasks, learners face several
real-world features such as product specification,
design constraints, data editing and storing, backups,
etc. Furthermore, we adopted the institutional and
commercial LMS tool Blackboard/WebCT Learning
System
(Blackboard, 2012), other similar solutions,
of course, could be also useful for our goals. This
tool is applied as a support of a face-to-face course.
This tool has been used to meet several primary
requirements:
(1) Task management: this tool collect the
deliverables, automatically registers the
submission date and time, and allows for
delivering several versions for the same task.
Once delivered, it is possible to send the
feedback to the group and also to assess the
task. We use this tool as an organized
repository. Both learners and instructors have
access to the repository that can be checked in
case of conflict.
(2) Group management: This tool allows us to
update the group composition and automatically
create a kind email distribution list useful for
communication with the groups. It also to assign
the groups to panels. Learners identify
themselves when starting a session and the LMS
uses this identify for all its tools. We also use
the evaluation module to collect the individual
report of the time spent on each task.
(3) Communication: there are several
communication modules provided:
announcement, calendar, email and panel
modules. With the announcements the learners
read instructor news at the beginning of a
session. The calendar displays all the interesting
events related to the project, as task deadlines.
These events are easily created as part of the
task definition. E-mail allows personal
communication, for instance between a learner
and the instructors. The panels permit the
participation of authorized learners and
instructors. To meet several purposes, three
types of panels are used in this tool: (i) a public
inter-groups panel for all group members. It
should be used for general questions and to
explain possible mistakes or problems. (ii) a
private intra-groups panel is built for each
group. It should be used for communication
purposes among group members. (iii) a private
intra-project panel is defined for each project
domain. The panel is anonymous and
constitutes the only communication channel
between both groups. We look for a similar
mechanism to moderated distribution lists. In
this way, the instructor could superintend the
contents of each message before publishing it in
order to avoid inappropriate contribution.
(4) Description of learning method: Presented here
are the general rules, the acquired agreements,
the assessment method, the enumeration of the
different tasks, including the estimated tasks
deadlines and workload and the course schedule
(involving lectures and labs).
At the beginning of the first project task, the
participants have access to the first task description
through the task module. The rest of the tasks are
gradually incorporated through this module.
Whenever a new task is available, the module
highlights this to the students with a graphical
representation on the main page. Each task includes
a detailed description of what should be delivered
before its deadline. Tasks can also be sent for a
while after the time limit. Instructors and students
can consult all the past tasks and easily access their
deliverables during the whole project. Furthermore,
group management workload was reduced as a result
of LMS. We have shown its usefulness for
interchanging instructions, asking and replying to
questions, providing feedback, receiving and storing
work results, and so on. The module requires a brief
reconfiguration for each course: assigning task
deadlines, defining the groups, adding new groups to
the panels and tasks, etc. However, most of the work
is reused from previous courses: method description,
generation of panel, task presentations and
definitions, and so forth.
CSEDU2013-5thInternationalConferenceonComputerSupportedEducation
6

3 RESEARCH HYPOTHESES
3.1 Project-based Method
The following hypotheses make conjectures on
student results. These results include aspects such as
dropout rates, exam passing, and class attendance.
Better results mean more valuable learning
outcomes for the students. The several hypotheses
that we wish to examine are:
H1a: Students that follow the project-based method
will obtain better results than their
counterparts with a traditional method.
H1b: The project-based method will influence the
whole student group: the results of the entire
group when some students follow the new
method will be better than the results of the
group when everybody follows a traditional
method.
H1c: The project-based method will influence the
students that only follow a traditional method:
these students will improve their results
compared with groups of students where all
their members follow a traditional method.
3.2 The Informational LMSuse
Malikowski, Thompson and Theis (2007)
distinguish several layers of adoption with respect to
CMS features: Layer 1, consisting of the most
commonly used CMS features such as transmitting
course content; Layer 2, comprising features with
moderate adoption such as evaluating learners,
courses and instructors; and Layer 3, including the
least adopted features like creating class discussions
and computer-based instruction. Features of layer 1
can be seen as features focusing on what Hamuy and
Galaz (2010) refer to as the informational phase,
while layer 2 and 3 correspond with the
communicational phase (Hamuy and Galaz, 2010).
Malikowski et al. (2007) concluded that CMS
features for evaluating students or creating
discussions are adopted much less often than
transmitting content, so the flowchart suggests
categories containing these features are adopted after
instructors have transmitted content in a CMS. All
these observations and arguments have in common
that a basic usage phase of specific technologies, is
required to foster the adoption of more advanced
type of technology use. Hence, within the context of
the study about LMS usage, we expect information
use of the LMS to be a precursor of
communicational use.
H2: Informational use will be a precursor of
communicational use.
3.3 Perception of LMS
The perception of utility is defined as the degree to
which a person believes that using a particular
system will enhance job performance (Ware, 2004).
In most TAM-studies, perception of utility has been
the strongest predictor for behavioral intention.
Therefore, King and He (2006) conclude their meta-
analysis with the statement: “if one could measure
only one independent variable, perception of utility
would clearly be the one to choose”. But even if
users think their performance will benefit from
technology usage, they do not necessarily actively
engage with the technology. Ware (2004) explains
this as follows: “they may, at the same time, believe
that the system is too hard to use and that the
performance benefits of usage are outweighed by the
effort of using the application” (p. 320). In this
respect, the variable, perception of user interface,
plays a role. It refers to an individual’s believe that
using a system or technology is free of effort.
Meanwhile, the variable, subjective criterion, refers
to the social influence of important others (Ma et al.,
2005). Though Ware (2004) did not include social
influence as a direct determinant of behavioral
intention, Venkatesh and Davis (2000) reconsidered
this variable in the TAM2 model, especially in
settings where a particular technology usage is
mandatory. Van Raaij and Schepers (2008) refer in
this context to LMS environments when they have to
be used in order to complete the course. This
reconfirms the position of subjective criterion in the
present study. There are several hypotheses included
in our model.
H3a: Perception of utility has positively affects
informational use.
H3b: Perception of user interface has positively
affects informational use.
H3c: Perceived user interface positively affects
perceived utility.
H3d: Subjective criterion positively affects
perception of utility.
3.4 Personal Innovativeness toward IT
Van Raaij and Schepers (2008) consider personal
innovativeness as a form of openness to change.
They agree with Schillewaert et al. (2005) that
“being used to adapting to new systems and
processes might indicate the utility and user
interface more quickly to an innovative person than
to a non-innovative person”. As reported by
Schillewaert et al. (2005), it is not only possible to
distinguish a direct relation between personal
AProject-basedCreativeProductDesignCourseusingLearningManagementSystem
7

innovativeness and technology adoption, but also an
indirect relation through perception of utility and
user interface. They concluded that a person’s
predisposition toward technology plays an important
role. In this respect, we expect that a learner with a
higher level of technological innovativeness will
more readily use an LMS, and this up to the
communicational phase.
H4a: Personal innovativeness toward IT positively
affects communicational use.
H4b: Personal innovativeness toward IT positively
affects perception of utility.
H4c: Personal innovativeness toward IT positively
affects perception of user interface.
3.5 Internal Support toward IT
Technical support is one of the most essential factors
in the acceptance of educational technology (Wu,
Hiltz & Bieber, 2010). Ngai et al. (2007) also stated
a strong – indirect – effect of technical support on
attitude, thus underscoring the importance of user
support and training on the perceptions of users and
ultimately their use of system. This is confirmed by
the significant and strong association between user
perceptions of school-based ICT support and actual
classroom use of ICT in the study of Tondeur, van
Keer et al. (2008). Thus, we can assume that internal
ICT support will influence the perceptions of the
learners and the use of the LMS.
H5a: Internal support toward ICT positively affects
informational use.
H5b: Internal support toward ICT positively affects
subjective criterion.
4 METHOD
4.1 Participant
This is a quasi-experimental study based on a face-
to-face course on creative product design with one
team of students per academic year. We will identify
each academic year by its final year. For example,
we will refer to the academic year 2010/2011 as
2011. The sample corresponds to four successive
courses, from year 2008-2011, with 78, 85, 96, and
93 students attending the course, respectively. From
year 2010 the project-based method was provided as
an alternative and was optional to all the students.
All the interested members were admitted. A total of
116 students followed this method (56 in 2010 and
60 in 2011) organized in 29 groups. All the groups
had four members.
4.2 Research Design
For each academic year the two instructors were the
same. Each lecturer was responsible for the same
portions each year. The subject contents, books and
written materials were also substantially the same.
To investigate the previous hypotheses (H1a – H1c)
we use the exam grades, which constitute the
common assessment procedure for both learning
methods. All the exams follow a common structure.
They all are composed of the same set of exercise
with very similar difficulty level among them. We
also consider the number of students that did not
take the exam and the student class attendance.
Individual declarations of time spent have been
taken into record in order to measure workload and
to detect free-riders. The “contamination” between
traditional and PBL subgroups is inevitable when we
work with a single group. In addition, we considered
their random division into experimental and control
subgroups unethical. For these reasons we decide to
propose the PBL experience as a voluntary option.
Then, the possible bias included by the voluntary
factor should be carefully taken into consideration.
However, and taking into account the null variance
in contents, exam and instructors, we still can
compare the condition of the whole group before
and after the introduction of the PBL experience. An
alternative study would consider only voluntary
learners and organize randomized groups with them.
As has been mentioned, students either know the
required computer tools from previous courses or
can learn them in specific laboratories. The whole
group uses the LMS for accessing materials. The
project subgroup uses some additional tools in order
to consult and deliver tasks, but there is no essential
difference in both subgroups from a learning point
of view.
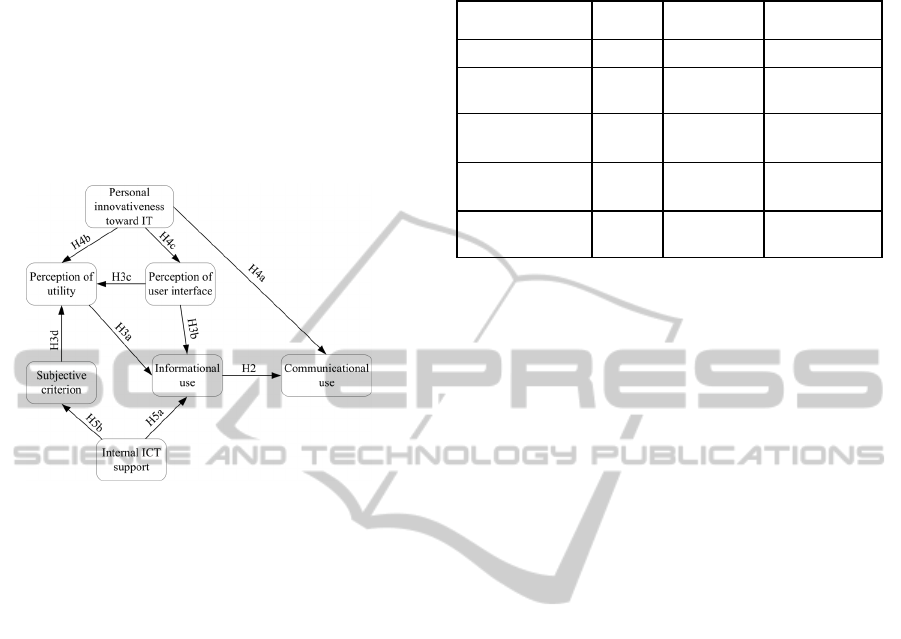
Furthermore, a survey instrument was generated.
It focused on the construct as represented in the
proposed research model (as shown in Figure 1).
Ten items assisted to determine the phase of
informational use and communicational LMS use.
Items about announcements, document publishing,
receiving assignments, the agenda, and learner
tracking module are linked to informational LMS
use. Items about the use of the chat environment, the
discussion forum, assessment module, and learning
paths are connected to communicational LMS use.
Participants were asked to indicate on a five-point
Likert scale to what extent they did actively use the
particular LMS tool or functionality. Based on
several previous researches (Chau and Hu, 2001;
Dong, 2009; Venkatesh et al, 2003), we adopted the
four-item performance expectancy scale for
CSEDU2013-5thInternationalConferenceonComputerSupportedEducation
8
perception of utility and the four-item effort
expectancy scale for perception of user interface.
For subjective criterion, the two-item scale based on
Armitage and Christian (2003) is used. Personal
innovativeness toward IT is assessed with the four-
item scale from Rosen (2004). Internal ICT support
is based on the four-item scale by Tondeur, Valcke,
et al. (2008). All of these items are measured on a
five-point Likert-scale, ranging from “very disagree”
(one score) to “very agree” (five score).
Figure 1: Proposed research model.
5 RESULTS AND DISCUSSION
5.1 Effects in Both Learning Methods
Table 1 compiles the data obtained comparing
traditional and PBL methods in courses 2010 and
2011. Also means comparison tests or Person’s chi-
square tests are included. The exam results
correspond to the grade (from 0 to 10) obtained in
the final exam of the course. The dropout rates were
measured by the absence of mark in this exam. This
exam was passed obtaining at least five points.
Attendance of lectures and labs was not compelled.
We controlled, however, the attendance of practical
classes (15 in 2010 and 17 in 2011). Learners were
informed that this control was only for statistical
purpose. We find that attendance has a direct
correlation with success in the exam (r = 0.402, p <
0.05). As shown in Table 2, the data allow us to
identify a better attitude towards the course in the
PBL group. We observe that participants of the
project group obtained better exam grades, passed
the exam, and attended more classes than their
fellows of the traditional group in a significant way.
The findings seem to support the hypothesis H1a.
Table 1: Results in PBL and traditional approach in 2010
and 2011.
PBL
group
Traditional
group
Statistical test
Sample N (%)
116 (61) 73 (39)
Grade Mean (SD)
6.47
(1.82)
5.06 (1.78) t = - 4.579
a
Dropout rates % 7.3 21.85
χ
2
= 12.726, df
= 1
a
Pass exam % 77.5 28.6
χ
2
= 35.143, df
= 2
a
Attendance Mean
(SD)
9.65
(3.85)
4.87 (3.92) Z = -4.862
a
a
p < 0.001
The PBL experience was a bit different when we
analyze each of the last two courses. The mean
grade (SD) obtained in course 2010 by all members
was 5.45 (2.10) whereas in 2011 it was 4.62 (1.82) (t
= -2.734, p < 0.05). In 2010 the mean grade (SD) for
the project-based group was 7.05 (1.46) and in the
traditional method group it was 5.02 (1.74) (t = -
4.892, p < 0.001). Nevertheless, in 2011 those data
were 5.18 (1.62) and 4.48 (1.80), respectively (t = -
1.902, p = 0.076). Although both courses showed
better grades in PBL than in the traditional approach,
in course 2010 only a trend to a statistical significant
difference is observed. This means that the
hypothesis H1a could be only partially supported. A
long-term study may possibly illustrate if this
current tendency is a permanent factor. Table 3
includes exam results and dropout rates gained from
the whole group from 2008 to 2009 (traditional
learning method) and from 2010 to 2011 (traditional
and PBL). The class attendance has not been
involved because it was not measured the first two
years. From the introduction of the project-based
method the results of the whole group have
increased. Table 2 reveals better percentages of
members that passed and took the exam than in
previous courses. We can also appreciate certain
improvement in exam grades, although not in a
significant way. All these results seem to sustain the
hypothesis H1b. If analyze each of the last two
courses we obtain that is 2010, 35.1% of the
members did not attend the exam and 39.8% passed
it. These data were 33.8% and 26.3% in 2011,
respectively. However, only the dropout rate
maintains during the two last courses. There is not a
clear tendency in exam grades. This means that the
hypothesis H1b would be only partially supported.
AProject-basedCreativeProductDesignCourseusingLearningManagementSystem
9

Table 2: The results before and after PBL introduction.
Group
(2008– 2009)
Group
(2010– 2011)
Statistical
test
Sample N (%) 163 (46) 189 (54)
Grade Mean
(SD)
4.76 (2.36) 4.96 (2.12) t = - 1.368
Dropout rates
%
48.9 31.2
χ
2
= 14.648,
df = 1
a
Pass exam % 23.6 32.7
χ
2
= 8.256,
df = 2
b
a
p < 0.001,
b
p
< 0.01
To analyze the influence in traditional students of
classmates following PBL, the first column of Table
1 and the first column of Table 2 should be
considered. While there were no differences in the
grade nor in the percentage of members who passed
the exam, the dropout rate decreased (χ
2
= 4.925, df
= 1, p < 0.05). The project-based method influenced
the traditional group, at least in the aspect of
attending the exam (Keogh-Brown et al., 2007).
Meanwhile, mean grades obtained by the traditional
group before and after the introduction of the
project-based method are essentially the same. From
the last two ideas, more people participating with
similar universal results, we can infer a positive
overall success improvement in traditional learning
students. Therefore, these results seem to support the
hypothesis H1c. However, the mean mark remained
flat throughout the four courses and decreases the
last year although not in a significant way. This
indicates that the hypothesis H1c could be only
partially sustained.
Participants revealed to have spend a mean (SD)
of 35 (11.6) hours of individual work developing the
project, almost double the estimation (18 h). This
reflects a negative aspect of PBL, a workload
increase for both learners and instructors (Martínez
& Duffing, 2007; Van den Bergh, et al., 2006).
However, there are two interpretations of the
estimated time. The PBL project viewpoint uses the
task as a way to learn (constructing internal
structures by discussing and understanding concepts,
and so on). The software perspective assumes that an
engineer will apply knowledge previously acquired
to solve problems. The time scheduled corresponds
to the second interpretation, whereas the time
declared could include aspects related to the first
aspect. These individual time declarations have not
helped to identify the free-riders presence (Van den
Bergh, et al., 2006). The coincidence in the spent
time in all group members is probably due to the
teamwork scheme. Obviously, all group members
used to meet to fulfill their tasks collectively.
Therefore, we have no idea of the level of
contribution of each particular member from this
data. Instructor workload has increased compared to
the traditional method, although we did not
systematically measure this item. The LMS has been
revealed to be a very useful tool that significantly
mitigates the work related to document, schedule,
and communication management. In addition,
students need quick feedback, especially in the first
steps. The group tutorship and task feedback and
assessment also increase the instructor workload.
We have also identified other benefits of PBL that
were not measured, including reflective thinking
(more critical contributions, noticeable interest
towards the subject topics, improved quality of
questions, etc.), development of work skills
(developing a full creative product design, fulfilling
a set of rules and deadlines, and so on), and social
skills (collaborating with the rest of the group
members, unbroken teams, and so forth.).
5.2 Psychometric Quality of the
Research Instrument
To examine the psychometric quality of the
instrument section focusing on the identification of
types of an LMS usage, a two-step validation
procedure was adopted. The sample (N = 116) was
divided into two sub-sample to evaluate the
construct validity. We have used SPSS version 18 to
conduct an exploratory factor analysis on the data of
the first sub-sample (n = 56), using Maximum
Likelihood estimation with oblique rotation. The
Kaiser-Meyer-Olkin (KMO) measure of sampling
adequacy was 0.87, exceeding the suggested
threshold for factor analysis of 0.6 (Manly, 2004).
The Bartlett’s test of sphericity was – as required –
significant at 0.001 level. The number of factors was
determined by a parallel analysis (O’Conner, 2000)
and an examination of the scree-plot. On the basis of
a first EFA, a two-factor solution was found, but two
items (student tracking module and the agenda) were
deleted due to communality values exceeding the
threshold. A second EFA was performed on the 8
remaining items. A two-factor was performed on the
nine remaining items. A two-factor solution
emerged, accounting for 61.2% of the common
variance among the items, with eigenvalues of 4.06
and 1.38. As illustrated in Table 3 and marked in
italic and bold, two substantially different constructs
can be distinguished and are in line with the findings
of Hamuy and Galaz (2010). Releasing
announcements, publishing document, uploading
exercise and receiving student works can be
considered as indicators of an informational phase in
LMS usage. Learning path, chat, forum, assessment
modules and social support can be marked as
indicators of the communicational phase in LMS
usage.
CSEDU2013-5thInternationalConferenceonComputerSupportedEducation
10
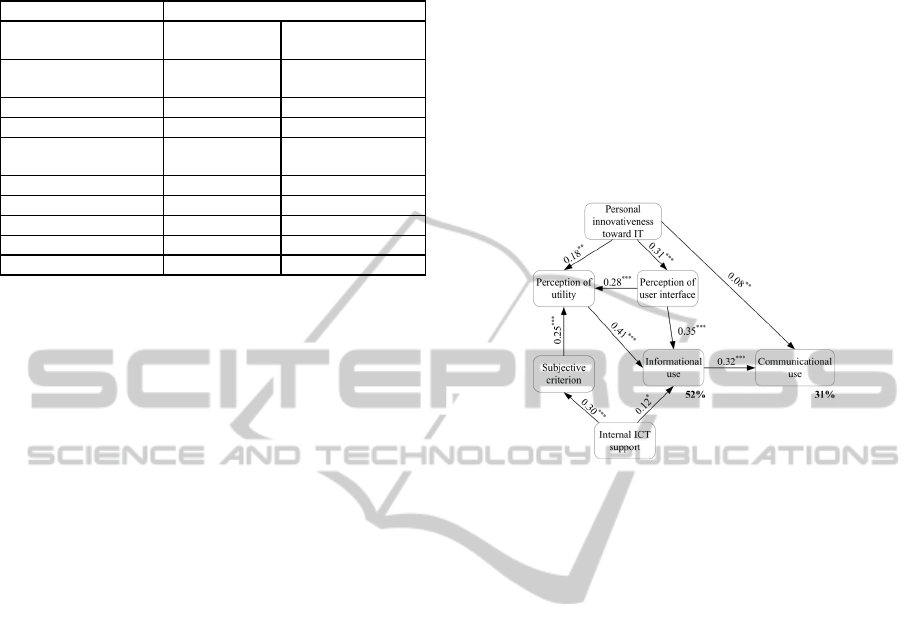
Table 3: Exploratory factor analysis of the dependent
variables.
Factor
Informational
use
Communicational
use
Releasing
announcements
0.952
-0.0051
Publishing document
0.725
-0.022
Uploading exercises
0.575
0.176
Receiving student
works
0.480
0.235
Learning path -0.075
0.802
Chat -0.122
0.720
Forum 0.185
0.628
Assessment modules 0.136
0.572
Social support 0.085
0.526
Next, AMOS (an add-on module for SPSS) was used
to perform a confirmatory factor analysis (CFA) on
the data of the second sub-sample (n = 60) and
building on the two-factor structure resulting from
EFA. The following indices were calculated, taking
into account criteria for the evaluation of goodness-
of-fit indices (Byrne, 2009): Chi-square/degrees of
freedom is less than 3 (2.32), the root mean square
error of approximation is higher than 0.05, but lower
than 0.08, reflecting a reasonable fit. The
comparative fit index (0.96), the normed fit index
(0.94), and the Tucker-Lewis index (0.96) reflect
good fit values since they are close to 0.95. To
conclude, on the base of the EFA and CFA, we can
report that the instrument to determine LMS use
reflects good construct validity. Construct validity
was evaluated for the other variable measured with
the instrument. Exploratory factor analysis (n = 56)
using Maximum Likelihood estimation with oblique
rotation was performed. The Kaiser-Meyer-Olkin
(KMO) measure of sampling adequacy is 0.87,
exceeding the suggested threshold for factor analysis
of 0.6 (Manly, 2004). The Bartlett’s test of
sphericity was – as required – significant at 0.001
level. The number of resulting factors is in line with
specific variables that were intended to be measured.
All values are close to 0.85, exceeding the threshold
value (Marcoulides & Raykov, 2011). Besides,
correlations between all variables are listed. A
correlation matrix approach was used; most values
are low among the different constructs. All
mentioned values suggest adequate validity of
measurements.
5.3 Analysis of Research Model
As described earlier, the hypothetical relationships
between the variables were tested on the base of
structural equation modeling, using AMOS. The
following fit indices were obtained. Chi-
square/degree of freedom is slightly higher than 3
(3.05), the root mean square error of approximation
is close to 0.05, suggesting a good fit. The
comparative fit index (0.96), the normed fit index
(0.92), and the Tucker-Lewis index (0.89) have
value close to 0.9 or approach the benchmark of
0.95. All common goodness-of-fit indexes exceeded
or approached their respective common acceptance
levels, suggesting that the research model exhibited
an acceptable fit with the data. Properties of the
causal paths, including standardized path
coefficients and p-values are shown in Figure 2.
Figure 2: The result of research model testing.
As to the assumption that informational use can be
considered as a precursor for communicational use
(H2), this hypothesis was sustained (β = 0.32, p <
0.001). The traditional TAM elements appeared in
four hypotheses. Perception of utility has a positive
significant effect on informational use (H3a, β =
0.41, p < 0.001). Perception of user interface in a
significant and positive way informational use (H3b,
β = 0.35, p < 0.001) and perception of utility (H3c, β
= 0.28, p < 0.001). Subjective criterion is found to
be a significant factor in determining perception of
utility (H3d, β = 0.25, p < 0.001). In line with other
TAM studies, all hypotheses constituting the TAM-
framework (H3a, H3b, H3c and H3d) are confirmed.
The findings indicate that personal innovativeness
toward IT has a direct positive effect on perception
of utility (H4b, β = 0.18, p < 0.01) and on perception
of user interface (H4c, β = 0.31, p < 0.001). The
effect on communicational use is significant but
rather weak (H4a, β = 0.08, p < 0.01). Hypotheses
H5a and H5b postulated the impact of internal ICT
support on informational use and subjective
criterion. The analysis results show that internal ICT
support has a positive significant effect on
informational use (H5a, β = 0.12, p < 0.05) and a
significant effect on subjective criterion (H5b, β =
0.30, p < 0.001). The whole model is able to explain
52% of the variance in formational use and 31% of
the variance in communicational use.
In summary, the study contributes to the
literature in a number of ways. Firstly, the use of
AProject-basedCreativeProductDesignCourseusingLearningManagementSystem
11

LMS by college students has been further explored
and refined. Secondly, the study focused on the
acceptance of the LMS by college students. Further,
the operationalisation of an LMS use into
informational use and communicational use
appeared to be valid. The research model is able to
explain 52% of the variance in informational use and
31% of the variance in communicational use. As
hypothesized, informational use seems to be a
precursor of communicational use. Meanwhile, we
could successfully generate on perception of utility,
user interface and subjective criterion as predictors
from the original TAM-framework. Both perception
of utility and perception of user interface were found
to have a strong effect on informational use. This
means that in order for a college student to use his
LMS in informational way, the utility and user
interface of the LMS will be both taken into
consideration. However, since we found a
significant effect of perception of user interface and
subjective criterion on perception of utility, we can
additionally postulate that the user interface of the
LMS should be a critical initial variable, followed
next by learners’ perception of the system’s
performance.
Another finding is the direct effect from internal ICT
support on informational use and on subjective
criterion. This result implies that supporting learners
at the school level will not directly influence
personal use, but especially impact the opinion of
important others. More important, as also indicated
by Tondeur, van Keer, et al. (2008), the impact of
internal ICT support suggests the school level
variables are important to understand technology
acceptation. The adoption of the variable internal
ICT support makes the TAM model congruent with
the real – school – world setting and conditions as
requested by Sun and Zhang (2006) and Ong et al.
(2004). Also important is the positive effect of
personal innovativeness on perception of user
interface. This reveals that innovative learners are
more easily convinced about the user interface of the
LMS. On the other hand, the impact of
innovativeness on utility was low, meaning that
being innovative does not automatically result in a
positive belief about a system’s performance. This is
also confirmed by the impact of personal
innovativeness toward IT on communicational use.
Being innovative is clearly not enough to start using
an LMS for communicational use. Based on the
importance of the participant’s perception of the user
interface of their LMS and the availability of
support, school manager or LMS coordinators can
consider the following practical recommendations:
(i) Introduction sessions can be considered and
manuals provided. If applicable, a proper translation
of the LMS to the native language of the learner and
clarification on specific design characteristics should
be foreseen. (ii) Some learners are not familiar with
functionalities like the social support or the learning
path module. Best practices, adaptive guides and
easy access to support will definitely be valuable for
the learner and might be that extra little thing to get
them inspired.
6 CONCLUSIONS
AND LIMITATIONS
The use of LMS with PBL approach has been
suggested for creative product design learning as a
more effective way for students to obtain the
essential knowledge and skills. On the other hand
the development of projects corresponds with the
main activity of a graduate on Mechanical
Engineering and Information Systems. This study
presents an approach that integrates both
perspectives of a project as a useful creative product
design learning method that tries to overcome
several problems of PBL applications. Our approach
focuses on the development of projects where
students, organized in groups, design and build real
product. Certain scaffolding is offered to reduce
both the project complexity and the uncertainly
inherent in the beginning of the tasks, and also to
motivate learners. Participants propose the project
topics and the imposition of some constraints in the
first task achieves the complexity balance control.
The communication with end-users is emulated
throughout role-playing between pairs of student
groups. The computer is essential tool to put this
method into practice, from the point of view both of
the creative product design and task management.
An LMS is a powerful solution in order to minimize
the necessary effort to organize the information
shown to the learners, group management,
deliverable collection and communication with and
among students. There are not many works about
PBL effectiveness for creative product design
learning. We have explored the results of two
academic years using the proposed project-based
learning approach. This quasi-experimental study
shows that on the one hand, learners that follow this
method obtain better results than members that
follow a traditional learning method. And on the
other hand, the introduction of such an approach in a
student subgroup positively influences the whole
group.
Furthermore, the purpose of this study was
twofold: (i) developing a better understanding of
college student acceptation of an LMS and (ii)
investigating the way this group of students actually
uses an LMS in their learning setting. Though the
CSEDU2013-5thInternationalConferenceonComputerSupportedEducation
12

result, discussed above have clearly helped to attain
our research aims, a number of limitations are to be
considered. Firstly, instead of reported use of an
LMS, we expect that using log files could lead to
more accurate LMS related data. However this was
not feasible practically in the current study, given
the number of respondents and the difficulties in
getting access to log files. Secondly, our study
validates the categorization of LMS-interactions as
defined by Hamuy and Galaz (2010). However,
additional LMS functionalities, such student
tracking module and the agenda had to be removed
during the factor analysis process. Future research
should continue to focus on the refining of LMS
usage categories. Thirdly, we were able to explain
52% of the variance in informational use, but only
31% of the variance in communicational use.
Further research should focus on identifying
additional variables to explain the adoption and
implementation of communicational use. The latter
could be for instance linked to beliefs of instructors
about the types of learning strategies that are linked
to the adoption of these LMS functionalities.
ACKNOWLEDGEMENTS
This study is supported in part by the National
Science Council in Taiwan for the financial support
and encouragement under Grant No. NSC 101-2511-
S-132-001-MY2, NSC 101-2631-S-003-010-CC3,
and NSC 100-2511-S-132-002-MY2.
REFERENCES
Armitage, J. C. & Christian J. (2003). From attitudes to
behavior: Basic and applied research on the theory of
planned behaviour. Current Psychology, 22, 3, 187-
195.
Barron, B. (1998). Doing with understanding: Lessons
from research on problem– and project-based learning.
Journal of the Learning Sciences, 7, 3-4, 271-311.
Blackboard.
(2012) Blackboard/WebCT Learning System
[online].Available from:
http://www.blackboard.com/International/APAC/Over
view.aspx?lang=en-us [Accessed in 10 January, 2012].
ChanLin, Lih-Juan. (2008). Technology integration
applied to project-based learning in science.
Innovations in Education and Teaching International,
45, 1, 55-65.
Chau, P. & Hu, P. (2001). Information technology
acceptance by individual professionals: A model
comparison approach. Decision Sciences, 32, 4, 699-
720.
Hamuy, E. & Galaz, M. (2010). Information versus
communication in course management system
participation. Computers & Education, 54, 1, 169-177.
Howard, J. T., Culley, J. S. & Dekoninck, E. (2008).
Describing the creative design process by the
integration of engineering design and cognitive
psychology literature. Design Studies, 29, 160-180.
Keogh-Brown, M. R., Bachmann, M. O., Shepstone, L.,
Hewitt, C., Howe, A., Ramsay, C. R., Song, F., Miles,
J. N. V., Torgerson, D. J., Miles, S., Elboume, D.,
Harvey, I. & Campbell, M. J. (2007). Contamination in
trails of educational interventions. Health Technology
Assessment, 11, 43. 1-142.
King, W. R. & He, J. (2006). A meta-analysis of the
technology acceptance model. Information and
Management, 43, 6, 740-755.
Ma, W. W., Andersson, R. & Streith, K. O. (2005).
Examining user acceptance of computer technology:
an empirical study of student teachers. Journal of
Computer Assisted Learning, 21, 6, 387-395.
Malikowski, S. R., Thompson, M. E. & Theis, J. G.
(2007). A model for research into course management
systems: bridging technology and learning theory.
Journal of Educational Computing Research, 36, 1,
149-173.
Manly, J. F. B. (2004). Multivariate statistical methods: A
primer (3th ed.). London: Chapman and Hall/CRC.
Marcoulides, A. G. & Raykov, T. (2011). Introduction to
psychometric theory. NY: Routledge.
Martínez-González, M. M. & Duffing, G. (2007).
Teaching databases in compliance with the European
dimension of higher education: best practices for better
competences. Education and Information Technology,
12, 4, 211-228.
Ngai, E., Poon, J. & Chan, Y. (2007). Empirical
examination of the adoption of WebCT using TAM.
Computers & Education, 48, 2, 250-267.
Project Management Institute. (2008). A guide to project
management body of knowledge (PMBOK
guide)
(4
th
ed.). Newton Square: Project Management
Institute.
van Raaij, M. E. & Schepers, L. J. J. (2008). The
acceptance and use of a virtual learning environment
in China. Computers & Education, 50, 3, 838-852.
Rosen, A. P. (2004). The effect of personal innovativeness
in the domain of information technology on the
acceptance and use of technology: A working paper.
Proceedings of the 35
th
Annual Meeting of the
Decision Sciences Institute, Boston, Massachusetts,
20-22 November, 6421-6426.
Schillewaert, N., Ahearne, M. J. Frambach, R. T. &
Moenaert, R. K. (2005). The adoption of information
technology in the sales force. Industrial Marketing
Management, 34, 4, 323-336.
Sun, H. & Zhang, P. (2006). The role of moderating
factors in user technology acceptance. International
Journal of Human-Computer Studies, 64, 1, 53-78.
Tondeur, J. van Keer, H., van Braak, J. & Valcke, M.
(2008). ICT integration in the classroom: challenging
AProject-basedCreativeProductDesignCourseusingLearningManagementSystem
13

the potential of a school policy. Computers &
Education, 51, 1, 212-223.
Van den Bergh, V., Mortelmans, D., Spooren, P., Van
Petegem, P., Gijbels, D. & Vanthournout, G. (2006).
New assessment modes within project-based education
– the stakeholders. Studies in Educational Evaluation,
32, 4, 345-368.
Venkatesh, V. & Davis, F. D. (2000). A theoretical
extension of the technology acceptance model: four
longitudinal field studies. Management Science, 46, 1,
186-204.
Venkatesh, V., Morris, M. G., Davis, G. B. & Davis, F. D.
(2003). User acceptance of information technology:
Toward a unified view. MIS Quarterly, 27, 4, 425-478.
de Vere, I., Melles, G. & Kapoor, A. (2010). Product
design engineering - a global education trend in
multidisciplinary training for creative product design.
European Journal of Engineering Education, 35, 1,
33-40.
Ware C. (2004). Information visualization (2
nd
ed.):
Perception for design. San Francisco, CA: Morgan
Kaufmann Publishers.
Wu, D., Hiltz, R. S. & Bieber M. (2010). Acceptance of
educational technology: Field studies of asynchronous
participatory examinations. Communications of the
Association for Information Systems, 26, 1, 451-476.
National fluid power association. (2011). Our industry -
about the fluid power [Online]. http://www.nfpa.com/
[Accessed 29 June, 2011].
Pelgrum, W. J. (2001). Obstacles to the integration of ICT
in education: Results from a worldwide educational
assessment. Computers & Education, 37, 2, 163-178.
Rogers, E. M., & Rogers, E. (2003). Diffusion of
innovations (5
th
ed.). New York: The Free Press.
Salamon, D. (2002). Technology and pedagogy: Why
don’t we see the promised revolution?. Educational
Technology, 42, 1, 71-75.
Shachar, M., & Neumann, Y. (2010). Twenty years of
research on the academic performance differences
between traditional and distance learning: summative
meta-analysis and trend examination. Journal of
Online Learning and Teaching, 6, 2, 318–334.
Shih, P., Munoz, D., & Sanchez, F. (2006). The effect of
previous experience with information and
communication technologies on performance in a
Web-based learning program. Computers in Human
Behavior, 22, 6, 962-970.
So, H. J., & Brush, T. A. (2008). Student perceptions of
collaborative learning, social presence and satisfaction
in a blended learning environment: relationships and
critical factors. Computers & Education, 51, 1, 318-
336.
Sun, P. C., Tsai, R. J., Finger, G., Chen, Y. Y., & Yeh, D.
(2008). What drives a successful e-learning? An
empirical investigation of the critical factors
influencing learner satisfaction. Computers &
Education, 50, 4, 1183-1202.
Tait, M., Tait, D., Thornton, F., & Edwards, M. (2008).
Development and evaluation of a critical care e-
learning scenario. Nurse Education Today, 28, 8, 971-
981.
U.S. Department of Education, Office of Planning,
Evaluation and Policy Development. (2009).
Evaluation of evidence-based practices in online
learning: A meta-analysis and review of online
studies. (Washington D.C.).
Wang, T. H. (2007). What strategies are effective for
formative assessment in an e-learning environment?
Journal of Computer Assisted Learning, 23, 3, 171-
186.
Wang, T. H. (2008). Web-based quiz-game-like formative
assessment: Development and evaluation. Computers
& Education, 51, 3, 1247-1263.
Wilfong, J. D. (2006). Computer anxiety and anger: The
impact of computer use, computer experience, and
self-efficacy beliefs. Computers in Human Behavior,
22, 6, 1001-1011.
CSEDU2013-5thInternationalConferenceonComputerSupportedEducation
14
