
Real-time Intelligent Clustering for Graph Visualization
Lionel Martin
1,2
and G´eraldine Bous
2
1
EPFL, Lausanne, Switzerland
2
RTI, SAP Research, Sophia Antipolis, France
Keywords:
Graph Visualization, Social Networks, Graph Clustering, Machine Learning, User Interaction.
Abstract:
We present a tool for the interactive exploration and analysis of large clustered graphs. The tool empowers
users to control the granularity of the graph, either by direct interaction (collapsing/expanding clusters) or
via a slider that automatically computes a clustered graph of the desired size. Moreover, we explore the
use of learning algorithms to capture graph exploration preferences based on a history of user interactions.
The learned parameters are then used to modify the action of the slider in view of mimicking the natural
interaction/exploration behavior of the user.
1 INTRODUCTION
Business Intelligence, (Social) Network Analysis or
Biology are just a few examples of domains where
graphs are used as data structures to capture the rela-
tional structure in the underlying data. To fully take
advantage of graphs, i.e. to allow analysts and sci-
entists to gain insight into the data, it is necessary to
provide user-friendly graph analysis and visualization
tools.
Developing graph visualization tools that are si-
multaneously simple, intuitive and flexible (i.e. con-
figurable) is a challenge as users have different re-
quirements that translate as constraints in the graph
exploration process. For large graphs, displaying the
entire dataset leads to clutter and information over-
load, which impedes the analysis targeted by the end-
user; on the other hand, displaying a simplified (fil-
tered or clustered) graph without allowing the user to
interactively configure the constraints (e.g. in filters)
or the level of detail in the display (e.g. the num-
ber of clusters) is simply too restrictive to meet the
requirements of most users. Over the years, many
authors have proposed approaches and techniques to
address the challenge of bringing together simplicity
and flexibility in tools for graph analysis and visu-
alization; the reader may refer to (von Landesberger
et al., 2011) for a recent review. Some proposals fo-
cus on the graph representation itself, showing that
node-link diagrams are more convenient for sparse
graphs (Ghoniem et al., 2005), while adjacency ma-
trices (Elmqvist et al., 2008) or hybrid representa-
tions (Henry and Fekete, 2006; Henry et al., 2007) are
more convenient for dense graphs. In parallel, many
proposals focus on interactive exploration techniques
to address the challenge of visual information over-
load. Simple techniques like zooming, distortion or
panning are helpful in visualizing large graphs (Card
et al., 1999). Another possibility is to allow users to
interactively reduce the amount of information dis-
played. Most interactive information reduction tech-
niques belong to two major axes that are clustering,
e.g. (Henry and Fekete, 2006; Archanbault et al.,
2008; Archanbault et al., 2002), and filtering, e.g.
(Heer and Boyd, 2005; Elmqvist and Fekete, 2010).
While the latter removes ‘uninteresting data’ to re-
duce the amount of information displayed, the for-
mer simply aggregates similar entities together into
‘visual containers’, called clusters. In addition, cer-
tain authors also allow to filter according to a degree
of interest function (van Ham and Perer, 2009) which
reflects the exploration focus of the user.
In this paper, we present a tool for the interactive
exploration and analysis of large clustered graphs.
The tool empowers users to control the granularity
of the graph, either by direct interaction (collaps-
ing/expanding clusters) or via a slider that automati-
cally computes a clustered graph of the desired ‘size’.
More precisely, the slider allows the user to define and
control the visual entity budget (Elmqvist and Fekete,
2010), which reflects the number of edges and nodes
displayed; for a given budget, a clustered graph with
a matching number of edges and nodes is calculated
and displayed. To ensure continuity and coherence
471
Martin L. and Bous G..
Real-time Intelligent Clustering for Graph Visualization.
DOI: 10.5220/0004305504710480
In Proceedings of the International Conference on Computer Graphics Theory and Applications and International Conference on Information
Visualization Theory and Applications (IVAPP-2013), pages 471-480
ISBN: 978-989-8565-46-4
Copyright
c
2013 SCITEPRESS (Science and Technology Publications, Lda.)
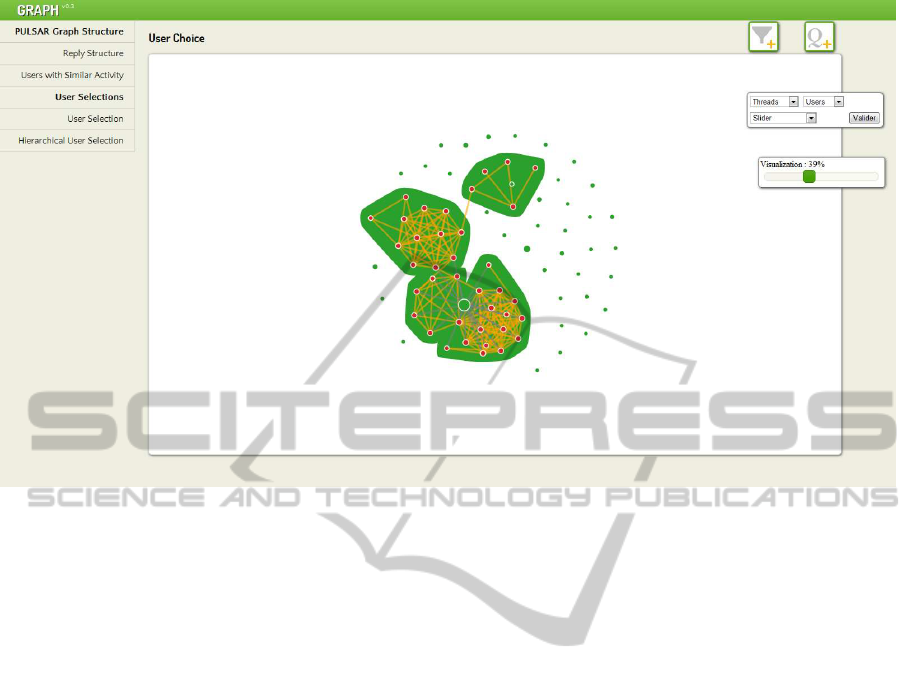
Figure 1: User Interface of our visualization tool.
in the display, i.e. to ensure that the graph displayed
with budget y is the graph that would be displayed
with budget x < y plus a certain number of expanded
clusters, we automatically calculate an exploration se-
quence for a hierarchically clustered graph. This se-
quence is then mapped to the slider; interacting with
the latter then allows having a quick overview of the
graph at different levels of detail in a user-friendly
manner. To further enhance user-experience and en-
able customization, we explore the use of learning
algorithms to capture graph exploration preferences
based on a history of user interactions. The tool
records user interactions to learn a degree of interest
function. This learned function is then used to mod-
ify the exploration sequence (and hence the action of
the slider) in view of mimicking the natural interac-
tion/exploration behavior of the user.
This paper is structured as follows. After an
overview of related work in section 2, we present our
tool in more detail in section 3. Section 4 addresses
the learning mechanism and details the results. Fi-
nally, we conclude in section 5 with challenges for
the future.
2 RELATED WORK
During the last decades, graph clustering has been
an intensively researched field proposing now a very
large choice of methods for various kinds of graphs
(the reader may refer to (Fortunato, 2010) for a com-
plete presentation of the different methods). Cluster-
ing techniques can be classified into two main cate-
gories: structure and attribute-based algorithms. Ap-
proaches in the former group use the structural prop-
erties of graphs to decide how vertices and edges
should be clustered. Examples include methods based
on the connectivity of nodes (Kernighan and Lin,
1970; Suaris and Kedem, 1988), the shortest paths
between nodes (Wu et al., 2004) and several other
measures like e.g. edge-betweenness centrality or
modularity (Girvan and Newman, 2002; Radicchi
et al., 2004; Newman, 2004; Duch and Arenas, 2005;
Blondel et al., 2008). On the other hand, attribute-
based clustering algorithms use the attributes of nodes
and edges to define clusters (Shneiderman and Aris,
2006; Wattenberg, 2006; Elmqvist et al., 2008).
Mixed approaches, taking both the graph structure
and its attributes into account, have also been pro-
posed (Archanbault et al., 2008).
Aside from the ‘algorithmic aspect’ of graph clus-
tering, many contributions propose tools or frame-
works for graph analysis and visualization that enable
users to interact with the graphs, for example (Henry
and Fekete, 2006; Archanbault et al., 2008; Archan-
bault et al., 2002). More recently, tools allowing users
to interactively ‘manage’ the data itself have been pre-
sented. The work of (Heer and Perer, 2011) describes
a system for the modeling, transformation and visual-
ization of multidimensional heterogeneous networks.
IVAPP2013-InternationalConferenceonInformationVisualizationTheoryandApplications
472
In parallel, (Liu et al., 2011) propose a tool to ex-
tract networks from tabular data which also includes
an interactive visual interface supporting operations
like aggregation (binning, grouping, etc.) or projec-
tion to generate different views of the data at different
levels of granularity.
Our work is closest in spirit to (Liu et al., 2011) in
that we propose a tool for graph (network) visualiza-
tion that implements projection and aggregation oper-
ations, including clustering with Louvain’s algorithm
(Blondel et al., 2008). In addition to direct interactive
exploration of the graph through expand / collapse op-
erations, our tool also extends the work of (Liu et al.,
2011) and other (previously cited) work on interactive
graph clustering by allowing the user to manage the
visual budget (Elmqvist and Fekete, 2010), i.e. the
number of nodes and edges displayed. The visual
budget is controlled by a simple slider ‘mapped’ to
a hierarchically clustered graph. Interacting with the
slider thus allows to automatically expand/collapse
clusters and thereby to quickly gain an overview of
the graph with little effort. The most innovative as-
pect of our proposal lies in the use of machine learn-
ing algorithms, which, based on a history of user in-
teractions, learn both how the graph should be (hi-
erarchically) clustered and in what sequence vertices
and edges should be expanded / collapsed. Learned
parameters are then used to derive a new graph explo-
ration sequence which is mapped back to the slider.
3 TOOL AND USE-CASE
DESCRIPTION
Traditional structure-based graph clustering algo-
rithms use predefined measures, like e.g. edge-
betweenness centrality, to produce clustered graphs.
The disadvantage of such predefined measures is that
the clustered graphs they generate may not reflect or
meet user preferences and requirements. In an in-
teractive framework, users may however explore the
graph and search for the information or subgraphs that
they are specifically interested in. Our goal is to pro-
vide users with all tools needed to efficiently explore
the graph and, in addition, to learn from user interac-
tions to recommend ‘views’ and ‘exploration paths’
of the graph that match user interest.
3.1 Overview
In this section we focus on the graph exploration
alone (learning is addressed later). Our prototype for
graph analysis is shown in figure 1. It is composed of
an interactive graph visualization panel, a menu for
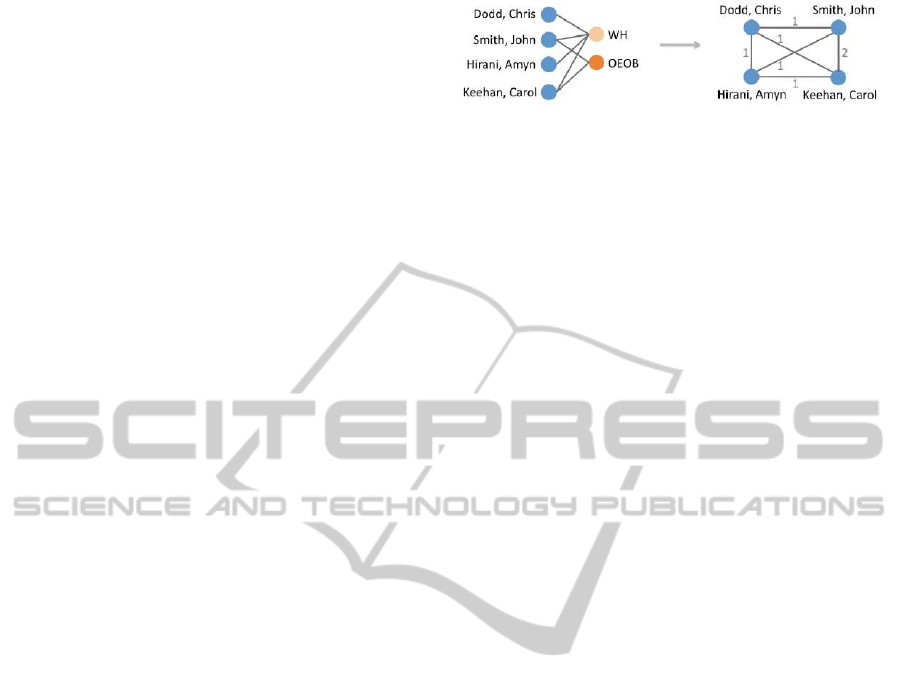
Figure 2: Projection (Liu et al., 2011).
selecting data aggregation operators (clustering, fil-
tering, grouping and projection) in the top right corner
and a slider to control the visual budget just below.
The use case considered in this paper is a so-
cial network extracted from an online forum (the
SAP Community Network). More precisely, we an-
alyze the graph that arises from the reply-structure
between messages. Forums have a natural hierar-
chical structure, as every forum contains threads,
which in turn contain the messages; messages in turn
have a unique author. Hence, two distinct hierar-
chical structures (forum-thread-message and author-
message) are linked together by the replies between
messages. From the author-message perspective, the
reply structure induces a bipartite graph. It is there-
fore convenient to calculate projections (Latapy et al.,
2008) of one set (i.e. hierarchy) over the other. The
projection of a bipartite graph is a graph whose ver-
tices belong to one set and are connected by edges
if and only if they shared a neighbor in the original
bipartite graph (see figure 2). This can expose corre-
lations in the data (e.g. author-author connectivity).
In addition, it also is of interest to exploit the natu-
ral hierarchies contained in the data to group nodes in
a semantically meaningful way. Both approaches are
implemented in our tool.
The disadvantage of semantic grouping and pro-
jection is that the graphs they generate are usually
highly connected graphs, which are difficult to vi-
sualize due to the high number of edges. There-
fore, the tool also offers the possibility to cluster
the graph. Our tool implements Louvain’s cluster-
ing method (Blondel et al., 2008), which is based on
the graph modularity measure (Newman and Girvan,
2004), as it is a fast and efficient algorithm. This
method has the advantage of producing hierarchically
clustered graphs, which can be used for interactiveex-
ploration by expanding/collapsing clusters, a feature
which is also offered in our graph analysis tool.
3.2 Entity Budget Interactions
Interactive graph exploration as described above can
be a tedious and time-consuming process. It is there-
fore convenient to provide users with a simple way
to visualize a hierarchically clustered graph at dif-
ferent levels of granularity. With this goal in mind,
our tool offers the possibility to use a slider to con-
Real-timeIntelligentClusteringforGraphVisualization
473

trol the amount of information displayed using a pre-
cise measure. The maximum of information that can
be displayed is the entire graph; the minimum is a
maximally clustered graph, i.e. a single cluster node
(the root node of the hierarchically clustered graph)
for each connected component of the graph. Consider
a graph G containing a total of |E| edges and |V| ver-
tices. For a clustered graph G
i
, |E
i
| and |V
i
| denote the
number of visible edges and nodes, respectively. The
measure that reflects the amount of entities in graph
G
i
is calculated as
I
i
=
|E
i
| + β|V
i
|
|E| + β|V|
, (1)
where β =
N
max
(N
max
−1)
2
and N
max
denotes the maxi-
mum number of neighbors in the graph. Now that
the measure and the notion of ‘maximum’ and ‘min-
imum’ graphs have been defined, the intermediate
steps must be considered: which graph should be as-
sociated to the measure I
i
? Indeed, the slider will
simply help the user to choose the proportion of in-
formation to display given the measure associated to
it; however, there may be more than one way to par-
tially expand a hierarchically clustered graph to match
the measure I
i
. It is thus necessary to define how this
measure should be interpreted, both in terms of which
entities should be displayed and also concerning the
proportion of nodes and edges.
‘Navigating’ from the minimal to the maximal
graph with expand operations can be done in several
ways. For example, it is possible to expand clusters
in either a purely ‘depth-first’ or ‘breadth-first’ fash-
ion, but anything in between is also possible. More-
over there are distinct partially expanded graphs that
may have the same number of entities. Since there
are several ways to reach a given quantity of infor-
mation, there are also potentially different intermedi-
ate steps leading to the same configuration (see figure
3). Hence, there are many distinct sequences of ex-
pand operations that can lead from the minimum to
the maximum graph. The slider should however only
be mapped to one sequence, which we call the default
sequence. Many parameters can be considered to de-
termine the order in which the different elements are
displayed using the slider. For example, parameters
related to the size of the nodes, the strength of the
links, the number of neighbors, and so on.
With a default exploration sequence defined, in-
creasing the proportion of information is the same
as applying several (or sometimes just one) expand
operations on the minimal graph. The continuity of
the measure mapped to the slider is thus an impor-
tant consideration: the measure is a continuous scale,
but expand operations may cause large ‘jumps’ in the
Figure 3: Two different sequences leading to the same con-
figuration.
number of items displayed. Indeed, if a step in the se-
quence corresponds to expanding a large cluster con-
taining ∆I entities, the measure will increase drasti-
cally at once. However, when the user interacts with
the slider, she may very well move it from value I
i
to I
i+1
= I
i
+ δ · ∆I, with 0 < δ < 1, i.e. within the
gap of the graph corresponding to value I
i
and the one
corresponding to value I
i
+ ∆I. When this occurs, our
exploration algorithm shows only part of the informa-
tion contained in a cluster with respect to the value
δ. Overall, the process to expand the graph with a
change in the slider from position I
i
to an entity bud-
get EB (with EB > I
i
) is the following:
• clusters are opened according to the default se-
quence G
i
, G
i+1
, ... as long as EB is not exceeded.
In other words, if the k
th
graph of the sequence
satisfies I
k
< EB < I
k+1
, then graph G
k
is dis-
played entirely.
• to allocate the missing part of the entity budget
EB − I
k
, part of the (k + 1)
th
graph is shown as
well. This is achieved by expanding the next clus-
ter (which differentiates G
k+1
from G
k
) partially,
i.e. showing as many entities as necessary to reach
EB and leaving the rest hidden within the cluster.
On the other hand, when the slider is placed at a value
EB < I
i
, the opposite is done: clusters are closed fol-
lowing the sequence in reverse order until reaching
graph G
k+1
satisfying I
k
< EB < I
k+1
with k + 1 ≤ i;
the expanded cluster that differentiates G
k+1
from G
k
is then partially closed to match EB.
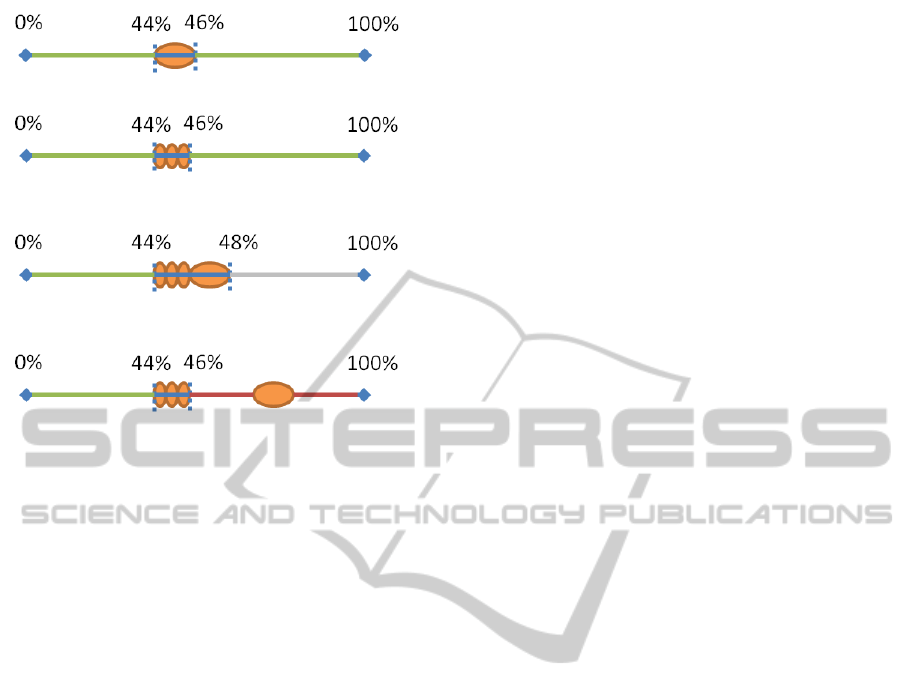
The challenge is that the user can also interact di-
rectly with the graph to expand and collapse nodes.
If the user first uses the slider to partially expand
the graph and then starts interacting directly with the
graph (performing expand / collapse operations) the
default sequence may not be further applicable, as,
through her interactions, the user is likely to define
sequence different from the default one. For exam-
ple, assume that she uses the slider to display 44%
of the information and then expands the three small-
est node clusters displayed, C
1
, C
2
, and C
3
. The new
amount of information displayed is 46% (see figure
IVAPP2013-InternationalConferenceonInformationVisualizationTheoryandApplications
474
(a) Default sequence before interaction, next action after 44% is openingC
0
.
(b) Alternative sequence defined by the user after the expansion of C
1
, C
2
and C
3
.
(c) Smallest modifications to be consistent with user interactions. The part
in gray can be or not be identical to the one of the old default sequence.
(d) Modifications of everything beyond 46% to improve the next explo-
rations for the user.
Figure 4: Modifications of the default sequence according
to user interactions.
4(b)). Assume the default sequence’s next operation
after reaching 44% was to expand another cluster, C
0
,
than the ones interactively expanded, modifying the
measure to 46% as well (see figure 4(a)). If the user
now moves the slider to 48%, the heuristic that de-
fines the order of the operations cannot ‘know’ that
the cluster C
0
is not expanded and that it cannot ex-
pand C
1
, C
2
or C
3
anymore. We thus need to define
a way to smoothly go from the configuration before
and the configuration after user interactions. In this
example, we need at least to redefine the default se-
quence between 44% and 48% (see figure 4(c)). But
even if it seems still valid to consider the old part of
the sequence between 0% and 44% and beyond 48%,
nothing forbids changing it as well (see figure 4(d)).
Our solution to this problem is the following.
When the user explores graph G
i
in a different or-
der from that defined in the default sequence, the
latter is reordered such that the partial sequence de-
fined by the user is ‘inserted’ after G
i
. More pre-
cisely, if the sequence is ..., G
i
, G
i+1
, ..., G
k
, ..., G
l
, ...
with i + 1 < k < l and at G
i
the user expands the
clusters that lead to G
k
and then G
l
, the default se-
quence becomes ..., G
i
, G
k
, G
l
, G
i+1
, .... Note that this
does not pose inconsistency problems: the sequence
in which clusters are opened is arbitrary provided no
cluster is opened before any of its parent vertices, i.e.
before any of the clusters in which a cluster is itself
contained. Since this principle cannot be violated by
manual exploration, redefining the default sequence
by capturing user interaction is perfectly consistent
with the hierarchically clustered graph.
4 INTERACTIVE LEARNING
As we have just shown, a hierarchically clustered
graph can be explored in many distinct ways. To map
one exploration sequence among the many possible to
the ‘exploration slider’ thus involves a default choice
which can be based on several criteria. In the previous
section, this choice was made on the basis of two con-
siderations: first, the exploration sequence must be
sufficiently fine-grained to be mapped to an (approxi-
mately) continuous measure; second, it must be possi-
ble to modify subsequences of the default sequence in
case the user interacts directly with the graph. Nev-
ertheless, the choice of the default sequence is still
highly arbitrary and it is thus convenient to introduce
more criteria (i.e. constraints) to further reduce the
set of feasible sequences. Most importantly, it is pos-
sible to introduce constraints that reflect user prefer-
ences or patterns in the graph exploration behavior.
By keeping track of user interactions with the graph,
it is possible to ‘learn’ the exploration behavior of the
user with machine learning algorithms. The rules ac-
quired through learning can then be used to update
the default exploration sequence in such a way that it
infers the natural behavior of the user.
4.1 Learning Framework
(Clustered) vertices and edges in a graph have differ-
ent characteristics that can be integrated as parameters
in an interest (or preference) function. The character-
istics (i.e. criteria) we consider are structural:
• the number of neighbors of a vertex;
• the number of entities in a cluster (which reflects
the size of a node in the clustered graph);
• the depth of the hierarchy in a clustered node and
• ‘edge width’ (which reflects its weight).
From a record of user interactions (which evolves in
real-time as the user explores the graph), it is possible
to deduce and quantify which (combination of) cri-
teria best reflect user behavior. In what follows, we
detail the model and the learning framework.
We denote the set of possible actions as A =
{a
0
, a
1
, . . . , a
n
}. Each of these actions corresponds to
collapsing or expanding a specific node. When the
user chooses to perform action e.g. a
0
, we can de-
duce that action a
0
is preferred to all the other avail-
able actions, i.e. a
0
≻ a
i
, where i = 1, . . . , n and ≻
is the notation for ‘preferred to’. Since action a
0
is
performed on a specific node, we can deduce that the
specific characteristics of the node are what made this
node relevant for the user. The interest function (also
known as ‘utility’ or ‘value function’ in the decision
Real-timeIntelligentClusteringforGraphVisualization
475

theoretic contexts) is a function u : A → R that satis-
fies a
i
≻ a
k
⇔ u(a
i
) ≥ u(a
k
) for all a
i
, a
k
∈ A , i 6= k
(Mehta, 1998; Aleskerov et al., 2007). In other terms,
u(a
i
) is the ‘value’ of action a
i
as perceived by the
user (Keeney and Raiffa, 1976). The utility function
is a parametric function that aggregates (i.e. takes into
account) all the criteria listed above. More precisely,
u(a
i
) is a function of the marginal utilities u
j
(a
i
),
which model the value of action a
i
on criterion j. The
most frequently used aggregation model is the addi-
tive model, which leads to
u(a
i
) =
J
∑
j=1
u
j
(a
i
) ∀a
i
∈ A , (2)
where J is the total number of criteria. With this
model, the utility of an action is thus the sum of its
marginal utilities. To define the marginal utilities,
we use a simple linear model. Before we detail the
equations, we must first take into account the fact that
some criteria should be minimized (i.e. the smaller,
the better for the user) or maximized (the larger, the
better). Let
s
j
=
(
−1 if criterion j is minimized and
1 otherwise.
(3)
Marginal utility functions are then defined as
u
j
(a
i
) = w
j
1− s
j
2
+ s
j
a
ij
− min
j
max
j
−min
j
, (4)
where w
j
is the weight of criterion j, a
ij
is the ac-
tual (non-subjective) value of action i on criterion
j and [min
j
, max
j
] is the domain of criterion j (i.e.
a
ij
∈ [min
j
, max
j
], ∀i, j). For example, for the crite-
rion ‘number of entities in a cluster’ and a cluster i
containing 20 entities, we would have a
ij
= 20.
The weights are the parameters that we seek to
estimate. Every interaction of the user can be trans-
lated into a constraint a
i
≻ a
k
⇔ u(a
i
) ≥ u(a
k
) using
the model described above; the goal of the learning
procedure is to determine the weights in such man-
ner that as many constraints as possible are satis-
fied. To learn the weights, we apply the UTA method
(Jacquet-Lagr`eze and Siskos, 1982; Siskos and Yan-
nacopoulos, 1985) which consists in solving the fol-
lowing linear optimization problem:
min
∑
a
i
∈A
σ(a
i
)
s.t. u(a
i
) + σ(a
i
) ≥ u(a
k
) + σ(a
k
) if a
i
≻ a
k
∑
j
w
j
= 1
w
j
≥ 0 ∀ j
σ(a
i
) ≥ 0 ∀a
i
∈ A ,
(5)
where the σ(a
i
) are error-variables assigned to each
action a
i
∈ A . By minimizing the sum of the error
variables, this linear program determines the weights
that allow most closely matching the preference con-
straints derived from user interactions. For more de-
tails on this and other topics in UTA and other related
methods, the reader may refer to (Siskos et al., 2005;
Bous et al., 2010).
A final remark is due. In decision theoretic con-
texts, it is known in advance whether a criterion
should be maximized or minimized, i.e. the value of
s
j
is given (the decision maker provides this informa-
tion ‘orally’ to the analyst). In our context, however,
this information must be interpreted from user inter-
actions directly. To estimate the signs, we define a set
of points in the neighborhood of the origin (in utility-
function space) and compute the distance to the con-
straints for those points. Then we take the signs of the
point in the set that minimizes the total error (sum of
the errors).
In the following section, we describe the ‘learning
procedure’, i.e. how user interactions are recorded
and interpreted in view of applying the learning algo-
rithm.
4.2 Learning Process
Learning from user interactions implies storing the
preference constraints and solving the optimization
problem discussed in the previous section. Figure 5
gives an overview of the different steps of the real-
time learning process: first, every interaction is trans-
lated into preference constraints (on the basis of the
criteria defined in the previous section), which must
be stored. The set of constraints is then used to deter-
mine whether criteria should be minimized or maxi-
mized (sign detection); next, both the constraints and
the signs are used to calculate the weights of the inter-
est function by the resolution of (5). Once the interest
function has been ‘learned’, it is used to define the
default sequence for the exploration of the graph with
the slider.
In addition to these steps, we emphasize that
learning and updating the ‘interest function’ of the
user in real-time raises several questions. For in-
stance, how frequently should the interest function be
updated? And, how should the record of user inter-
actions (i.e. the set of constraints) be managed and
updated?
With respect to the record of user interactions,
there are several possible solutions. The first and sim-
plest one is to keep all constraints generated, but this
has the disadvantage to lead to a very high number
of constraints, which may pose storage problems. Al-
IVAPP2013-InternationalConferenceonInformationVisualizationTheoryandApplications
476
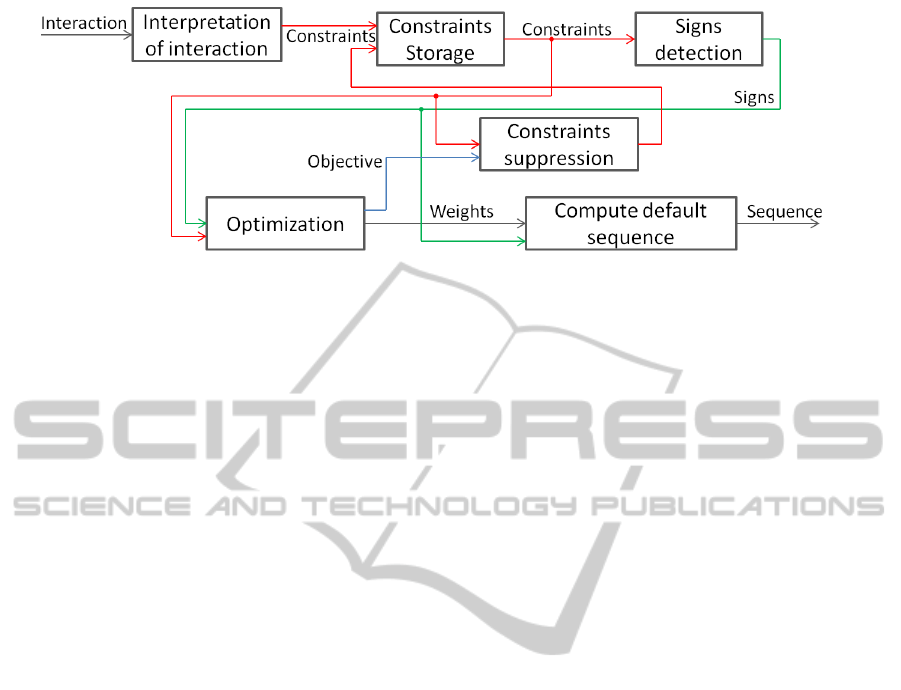
Figure 5: Diagram of the real-time learning process.
ternatively, it is possible to reinitialize the set of con-
straints on a regular basis, e.g. for each graph ex-
plored or each use of the software. More advanced
update procedures are possible, but, for testing and
experimentation purposes, we chose to reinitialize the
history at each use of the software.
For a given record of user interactions, the next
challenge is to decide which constraints should be
used in the optimization problem (i.e. we here distin-
guish between storage and optimization issues). As
the number of constraints grows, the error variables
in the optimization problem may increase. This is
typically the case if the interaction pattern changes
over time. For example, the user may start exploring
a graph with a few ‘random’ actions before starting
to show a consistent exploration behavior. Large er-
ror variables can thus be considered as indicators re-
flecting that the set of preference constraints may no
longer be relevant and require an update. However,
determining which constraint needs to be removed
from the record in order to maximally reduce the ob-
jective function of (5) is a combinatorial problem and
its exact resolution is difficult to implement in a real-
time learning environment. To solve this problem,
we therefore implemented and tested several heuris-
tic methods.
A fast and simple heuristic to address the prob-
lem is to simply remove the constraints that trigger
the highest error variables. Our experiments show that
this heuristic approach yields good results (see figure
6(a)) compared to the optimal solution (computed by
exhaustive enumeration). In our implementation, as
soon the objective function of (5) exceeds a certain
threshold, the heuristic method is applied (one or sev-
eral times) to bring the value of the objective function
below the threshold.
A second heuristic method tested was to remove
the oldest constraints. The idea here is that, if the in-
teraction pattern has changed, then old constraints are
obsolete and should thus be removed. However, this
technique does not work well as it does not signifi-
cantly reduce the objective function. The reason for
this is that, when the change in the interaction pattern
occurs, it may take many more constraints to exceed
the threshold of the objective function. In our experi-
ments, this method required removing more than half
of the constraints for a given threshold in order to re-
duce the value of the objective function significantly
(see figure 6(b)).
A third approach is to define a lifetime for each
constraint. As soon as a constraint is generated, it
is included in the optimization problem for a limited
number of steps (counted in user interactions) only.
The intuition behind this technique is that, if the user
is consistent and continues to explore the graph with
the same goals, then similar constraints should ‘natu-
rally’ reappear regularly. This method not only pro-
duces good results (see figure 6(c)), but it also allows
to solve the storage and memory problem evoked ear-
lier in this section. While this solution is the most
technically and conceptually satisfying, ‘preference
constraint management’ is an important component of
systems which learn from user interaction; therefore
it is important to test this and other methods with a
larger pool of users to evaluate which approaches are
most ‘natural’ to users. We leave this question open
for further research.
5 DISCUSSION
Our main goal in this investigation was to analyze the
feasibility and technical requirements of an ‘intelli-
gent visual analysis system’ for complex data struc-
tures on the basis of ‘simple’ controls. The combina-
tion of fields like Visual Analytics and Artificial In-
telligence are still at a pioneering stage and the chal-
lenges left to address and topics that still have to be in-
vestigated are many. The model, the learning set and
the interpretation of man-machine interactions are the
three ingredients that ultimately define the ‘behavior’
and quality of a learning-based system. Therefore, it
Real-timeIntelligentClusteringforGraphVisualization
477
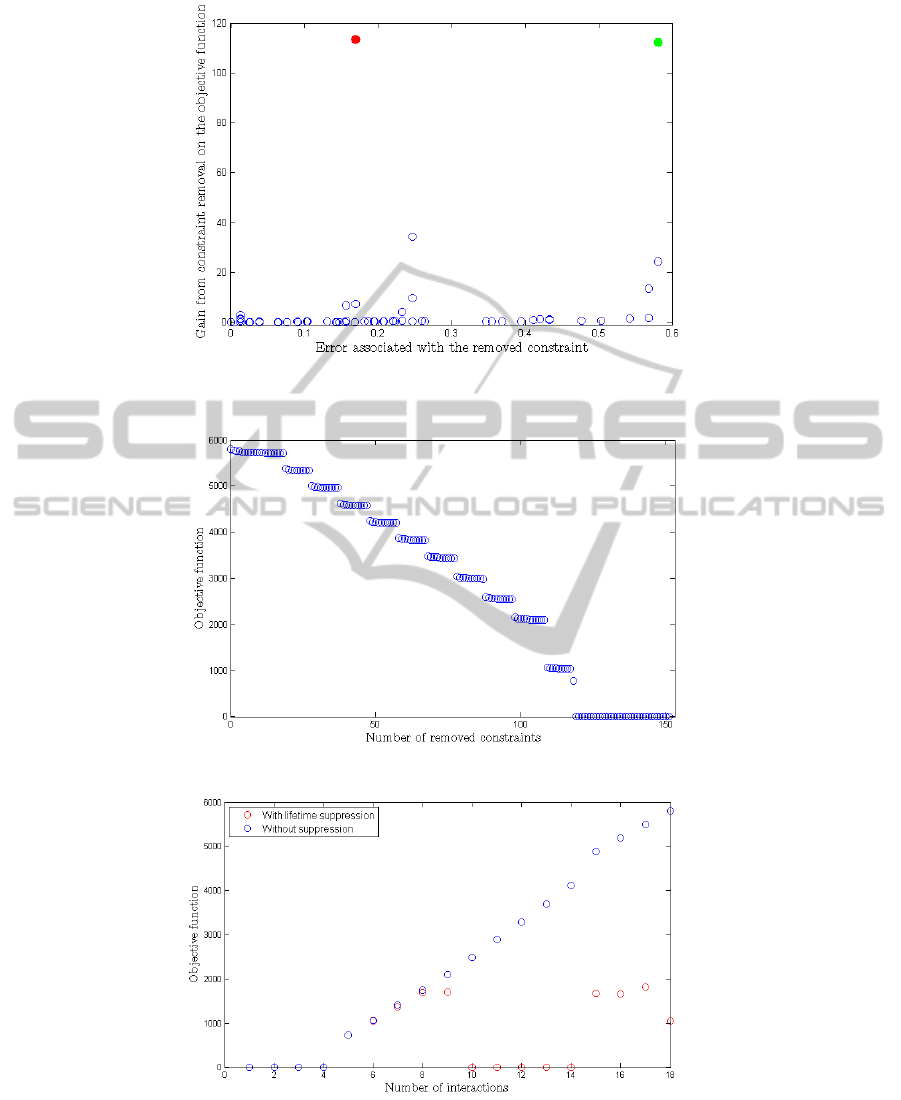
(a) Test on constraint suppression that shows that the removal of the constraint with the
largest slack variable (in green) is one of the best solutions to minimize the objective func-
tion (optimum is in red).
(b) Evolution of the objective function when removing the constraints one by one from the
oldest to the most recent.
(c) Evolution of the objective function when constraints are taken into account only in the
5 steps that follow their apparition.
Figure 6: Experimental results of constraint management heuristics.
is necessary to experiment with several models and
‘constraint management techniques’ in order to un-
derstand how real-time learning systems for visual an-
alytics should be designed to better reflect user behav-
IVAPP2013-InternationalConferenceonInformationVisualizationTheoryandApplications
478

ior and maximize user satisfaction.
In addition to the ‘conceptual’ and system-design
oriented challenges, it is worthwhile to address the
‘behavioral aspects’ of graph exploration, which also
play a key role in a system designed to learn from
man-machine interactions. For instance, it is worth
investigating whether preferred interactions differ
from graph to graph or application area or whether
they are particular to a user. Moreover, in depth ex-
perimental evaluations would allow to analyze the ef-
ficiency of exploration strategies, as well as to deter-
mine how and when ‘good strategies’ should be rec-
ommended to users in view of avoiding confinement
to systematic routine exploration mechanisms.
Finally, many technical challenges have to be ad-
dresses as well. In addition to a formalization of the
methods and techniques we presented here, many di-
rections for future research exist. To name a few, we
cite the interest function described used in our inves-
tigation, which is only based on criteria related to the
structure of the graph; a relevant extension is to in-
troduce attribute-based criteria as well. In addition,
it is worthwhile to further analyze how sequences of
interactions should be interpreted for real-time ma-
chine learning algorithms. Indeed, a single action on
a graph may not necessarily reflect user intention. In
other terms, certain goals of the user may require a se-
quence of actions to be met. The challenge is then not
only to define a model capable of modeling prefer-
ences on such sequences, but ultimately also to detect
or interpret them in what is otherwise nothing but a
long list of interaction events.
6 CONCLUSIONS
In this paper we presented a new tool developed to
understand and improve user experience in the explo-
ration of graphs. The tool empowers users to con-
trol the granularity of the graph, either by direct inter-
action (collapsing/expanding clusters) or via a slider
that automatically computes a clustered graph of the
desired size. Moreover, we explored the use of learn-
ing algorithms to capture graph exploration prefer-
ences based on a history of user interactions. The
learned parameters are then used to modify the action
of the slider in view of mimicking the natural interac-
tion/exploration behavior of the user.
Our work is a first step toward the use of machine
learning algorithms to define the actions associated
to simple interactive controls, like sliders, for the ex-
ploration of complex data structures like graphs. We
show that such an approach is technically feasible and
encourage further research in this direction in view
of bringing graphs and graph analysis closer to users.
In general, visual analysis systems designed to learn
from user interactions with the goal of enhancing user
experience deserve more attention and have many fas-
cinating research challenges to offer.
ACKNOWLEDGEMENTS
The authors gratefully acknowledge the valuable
comments of the anonymous referees, which helped
to improve the initial version of this manuscript.
REFERENCES
Aleskerov, F., Bouyssou, D., and Monjardet, B. (2007).
Utility Maximization, Choice and Preference.
Springer, Berlin.
Archanbault, D., Munzner, T., and Auber, D. (2002). Tug-
graph: path-preserving hierarchies for browsing prox-
imity and paths in graphs. In Proceedings of IEEE
Pacific Visualization Symposium, page 113120.
Archanbault, D., Munzner, T., and Auber, D. (2008).
Grouseflocks: Steerable exploration of graph hierar-
chy space. IEEE Transactions on Visualization and
Computer Graphics, 14:900913.
Blondel, V. D., Guillaume, J.-L., Lambiotte, R., and Lefeb-
vre, E. (2008). Fast unfolding of communities in large
networks. Journal of Statistical Mechanics: Theory
and Experiment, 2008:P10008.
Bous, G., Fortemps, P., Glineur, F., and Pirlot, M. (2010).
ACUTA: A novel method for eliciting additive value
functions on the basis of holistic preference state-
ments. European Journal of Operational Research,
206:435–444.
Card, S., MacKinlay, J., and Schneiderman, B. (1999).
Readings in Information Visualization: Using Vision
to Think. Morgan Kaufmann, Burlington.
Duch, J. and Arenas, A. (2005). Community detection in
complex networks using extremal optimization. Phys-
ical Review E, 72:027104.
Elmqvist, N., Do, T.-N., Goodell, H., Henry, N., and Fekete,
J.-D. (2008). Zame: Interactive large-scale graph vi-
sualization. In Proceedings of the IEEE Pacific Visu-
alization Symposium, pages 215 –222.
Elmqvist, N. and Fekete, J.-D. (2010). Hierarchical aggre-
gation for information visualization: Overview, tech-
niques and design guidelines. IEEE Transactions on
Visualization and Computer Graphics, 16:439–454.
Fortunato, S. (2010). Community detection in graphs.
Physics Reports, 486:75 – 174.
Ghoniem, M., Fekete, J.-D., and Castagliola, P. (2005). On
the readability of graphs using node-link and matrix-
based representations: A controlled experiment and
statistical analysis. Information Visualization, 4:114–
135.
Real-timeIntelligentClusteringforGraphVisualization
479

Girvan, M. and Newman, M. E. J. (2002). Com-
munity structure in social and biological networks.
Proceedings of the National Academy of Sciences,
99:78217826.
Heer, J. and Boyd, D. (2005). Vizster: visualizing online so-
cial networks. In Proceedings of the IEEE Symposium
on Information Visualization, page 3239.
Heer, J. and Perer, A. (2011). Orion: A system for model-
ing, transformation and visualization of multidimen-
sional heterogeneous networks. In Proceedings of the
2011 IEEE Conference on Visual Analytics Science
and Technology (VAST), pages 51 –60.
Henry, N. and Fekete, J.-D. (2006). Matrixexplorer: a
dual-representation system to explore social networks.
IEEE Transactions on Visualization and Computer
Graphics, 12:677–684.
Henry, N., Fekete, J.-D., and McGuffin, M. (2007). Node-
trix: a hybrid visualization of social networks. IEEE
Transactions on Visualization and Computer Graph-
ics, 13(6):1302 –1309.
Jacquet-Lagr`eze, E. and Siskos, Y. (1982). Assessing a set
of additive utility functions to multicriteria decision-
making: the UTA method. European Journal of Op-
erational Research, 10:151–164.
Keeney, R. L. and Raiffa, H. (1976). Decisions with multi-
ple objectives: Preferences and value tradeoffs. Wi-
ley, New York.
Kernighan, B. W. and Lin, S. (1970). An efficient heuristic
procedure for partitioning graphs. Bell System Techni-
cal Journal, 49:291307.
Latapy, M., Magnien, C., and Vecchio, N. D. (2008). Basic
notions for the analysis of large two-mode networks.
Social Networks, 30:31 – 48.
Liu, Z., Navathe, S., and Stasko, J. (2011). Network-based
visual analysis of tabular data. In Proceedings of the
2011 IEEE Conference on Visual Analytics Science
and Technology (VAST), pages 41 –50.
Mehta, G. B. (1998). Preference and utility. In Barber`a, S.,
Hammond, P. J., and Seidl, C., editors, Handbook of
Utility Theory, volume 1, pages 1–47. Kluwer, Dor-
drecht.
Newman, M. (2004). Detecting community structure in net-
works. The European Physical Journal B - Condensed
Matter and Complex Systems, 38:321–330.
Newman, M. E. J. and Girvan, M. (2004). Finding and eval-
uating community structure in networks. Physical Re-
view E, 69:026113.
Radicchi, F., Castellano, C., Cecconi, F., Loreto, V., and
Parisi, D. (2004). Defining and identifying com-
munities in networks. Proceedings of the National
Academy of Sciences, 101:2658–2663.
Shneiderman, B. and Aris, A. (2006). Network visualiza-
tion by semantic substrates. IEEE Transactions on Vi-
sualization and Computer Graphics, 12:733 –740.
Siskos, Y., Grigoroudis, E., and Matsatsinis, N. (2005).
UTA methods. In Figueira, J., Greco, S., and Ehrgott,
M., editors, Multiple Criteria Decision Analysis:
State of the Art Surveys, pages 297–344. Springer,
Berlin.
Siskos, Y. and Yannacopoulos, D. (1985). UTASTAR: an
ordinal regression method for building additive value
functions. Investigaao Operacional, 5:39–53.
Suaris, P. R. and Kedem, G. (1988). An algorithm
for quadrisection and its application to standard cell
placement. IEEE Transactions on Circuits and Sys-
tems, 35:294–303.
van Ham, F. and Perer, A. (2009). Search, show context, ex-
pand on demand: supporting large graph exploration
with degree-of-interest. IEEE Transactions on Visual-
ization and Computer Graphics, 15:953960.
von Landesberger, T., Kuijper, A., Schreck, T., Kohlham-
mer, J., van Wijk, J. J., Fekete, J.-D., and Fellner,
D. W. (2011). Visual analysis of large graphs: State-
of-the-art and future research challenges. Computer
Graphics Forum, 30:17191749.
Wattenberg, M. (2006). Visual exploration of multivariate
graphs. In Proceedings of the SIGCHI conference on
Human Factors in computing systems, pages 811–819.
Wu, A. Y., Garland, M., and Han, J. (2004). Mining scale-
free networks using geodesic clustering. In Proceed-
ings of the tenth ACM SIGKDD international confer-
ence on Knowledge discovery and data mining, pages
719–724.
IVAPP2013-InternationalConferenceonInformationVisualizationTheoryandApplications
480
