
Reducing Power Consumption in Hydrometric Level Sensor
Networks using Support Vector Machines
Marco Pellegrini
1
, Renato De Leone
2
, Pierluigi Maponi
2
and Maurizio Ferretti
3
1
LIF srl, Via di Porto 159, 50018 Scandicci (FI), Italy
2
Università di Camerino, Via Madonna delle Carceri 9, 62032 Camerino (MC), Italy
3
Regione Marche - Centro Funzionale Multirischi, Via del Colle Ameno 5, 60126 Ancona (AN), Italy
Keywords: Adaptive Systems, Support Vector Machines, Environmental Engineering.
Abstract: Environmental monitoring is a challeging task for both researchers and technical operators. Data loggers for
ultrasonic hydrometric level sensors are compact devices equipped with microprocessor input channels and
data storage. One of the critical issues that electronic engineers have to face in designing this kind of sensors
is the energy consumption during the sensor startup phase preceding the level measurement. In this paper
we propose a new methodology to reduce the power consumption by decreasing the sensor sampling rate
when no flood events are occurring. This procedure allows the sampling rate to dynamically self-adapt
based on the error between observed and predicted water level time-trend. Support Vector Machines are
used to predict the hydrometric level given a limited number of previous samples. The method effectiveness
has been tested on a real-world stage-discharge dataset.
1 INTRODUCTION
The interaction with the physical world is the key
role of embedded software (Lee, 2002). The design
of software for programmable embedded systems is
crucial in real-time or near real-time devices (Graaf
et al., 2003).
Data loggers are used to collect readings from
sensors for environmental parameters such as
temperature, pressure, humidity, wind speed and
direction, incoming solar radiation or stream flow
water level.
In this work we focus our attention on data
loggers for hydrometric level sensors. One of the
critical issues that engineers have to face in
designing ultrasonic water level sensors is the
energy consumption during the sensor startup phase.
Water level time-trend of a stream flow has high
frequency components for short periods of time and
low frequency components for relatively long
periods (i.e., when no flood events are occurring at a
given stream cross section). Many natural signals are
often of this type.
Here we propose a methodology allowing a
sensor to dynamically adjust the data logger
sampling strategy in order to reduce its energy
consumption. In particular, the sensor sampling rate
will be decreased when no flood events are
occurring, and then re-established so as to be able to
measure a flood peak as accurate as possible.
As a consequence, the objective is to predict the
water level time-trend based on previous
measurements only. The sampling period is then
adapted depending on the error committed by the
predictor.
The two main groups of techniques currently
used in modelling hydrological processes and
generating synthetic stream-flows include physically
based conceptual models and time-series models.
Such methodologies are deficient due to: (i)
instability and lack of convergence in the numerical
solution of the highly nonlinear flow equations
(Tayfur and Singh, 2006), (ii) nonlinear dynamics
inherent in the transformation of rainfall to runoff
(Zealand et al., 1999).
In a recent work (Pellegrini et al., 2012) we
assessed the feasibility of using Support Vector
Machines (SVMs) in embedded software systems
for predicting hydrometric level time-trend applying
radial basis function on sample data.
The paper is organized as follows. An overview
of SVMs is given in Section 2. Data from a real-
world monitoring sensor network have been used to
build and test the SVM models. The dataset is
described in Section 3 together with the results
229
Pellegrini M., De Leone R., Maponi P. and Ferretti M..
Reducing Power Consumption in Hydrometric Level Sensor Networks using Support Vector Machines.
DOI: 10.5220/0004312602290232
In Proceedings of the 3rd International Conference on Pervasive Embedded Computing and Communication Systems (PECCS-2013), pages 229-232
ISBN: 978-989-8565-43-3
Copyright
c
2013 SCITEPRESS (Science and Technology Publications, Lda.)

obtained from the practical application of SVMs.
Section 4 presents the adaptive sampling strategy
and finally our conclusions are reported.
2 SUPPORT VECTOR
MACHINES
Support Vector Machines are a very effective
technique based on statistical learning theory
(Vapnik, 1998). SVMs basic idea is to map the
original input data using a nonlinear kernel function
into a high dimensional feature space and determine
an optimal separating hyperplane. Algorithms based
on SVMs can be applied to both classification
(SVC) and regression (SVR) problems. In a
classification problem the aim is to find an optimal
hyperplane that separates sample data into two
classes. In a regression problem the normal to the
hyperplane defines a function for which the target
and the estimated values are as close as possible
(Smola and Schölkopf, 2004).
The objective in a SVR problem is to estimate a
function based on a given data set. Considering a set
of N data points D = {(x
1
, t
1
), …, (x
N
, t
N
)} where x
i
represents the input vector and t
i
is the
corresponding sample datum, the general form of -
SVR (Schölkopf et al., 2000) estimating function is:
f(x) = w
T
(x) + b
(1)
where (x) is the nonlinear map to the feature space
and coefficients w and b are obtained by solving the
following minimization problem:
min ½ ||w||
2
+ C( + 1/N
N
(
i
+
i
*
))
(2)
subject to
(w
T
(x
i
) + b) – t
i
≤
i
t
i
– (w
T
(x
i
) + b) ≤
i
*
i
,
i
*
0, i = 1, …, N, C>0, 0
where C is the regularization parameter, 0 ≤ ≤ 1,
i
and
i
*
are slack variables and the -insensitive loss
function means that no loss is assumed if f(x) is in
the [t ±] range.
Nonlinear -SVR in its dual formulation is given
by (Chang and Lin, 2002):
min ½ (–
)
T
Q (–
) + t
T
(–
)
(3)
subject to
e
T
(–
)
e
T
(+
) ≤ C,
0 ≤
i
,
i
≤ C/N, i = 1, …, N
where Q(x
i
, x
j
) = (x
i
)
T
(x
j
) represents the kernel,
i
and
i
*
are the Lagrange multipliers and e is the
vector with all components equal to 1.
In this study -SVR is used to predict
hydrometric level averaged over six hours at a given
location. The period of six hours has been chosen to
be easily used in combination with location-specific
rainfall nowcasting (Wilson, 2006). When the
dynamics of the underlying experiment are
nonlinear, it is known (Sakhanenko et al., 2006) that
SVR with Gaussian Radial Basis Function (RBF),
where
Q(x
i
, x
j
) = exp( – ||x
i
– x
j
||
2
) with >0,
(4)
trains faster and returns more satisfactory results
than polynomial kernel. Therefore, in this paper
RBF kernel was adopted. All -SVR computations
were performed using the open source scikits.learn
Python module (Pedregosa et al., 2011).
3 PRACTICAL APPLICATION
Marche Region (East-central Italy) meteorological-
hydrological SIRMIP database (available on line at
http://84.38.48.145/sol) includes readings
of several weather parameters recorded with a
sample rate of 30 minutes (15 minutes for rain data).
Hydrometric level data of Marche Region for a
period of five years (2006–2010) have been used to
build SVM models, and data for year 2011 have
been used for testing.
Data have been pre-processed in order to obtain
time series representing the averages over six hours
at any given stream cross-section and then min-max
normalized to scale them into the [0, 1] range. The
objective was to predict 6-hours average of
hydrometric level at a stream cross-section based on
n previous 6-hours averages.
Since the rainfall occurred in the last 5 days is a
crucial information to define the antecedent moisture
condition (SCS, 1993), a value of n=20 was adopted.
The performance of the SVM models has been
verified after de-normalizing the output generated by
the models and computing the Mean Square Error
(MSE):
MSE = 1/N
N
( f(x
i
) – t
i
)
2
(5)
where ( f(x
i
) – t
i
)
2
represents the ith squared error
(SE) between -SVR predicted and measured
values. In this work the sample datum t
i
is computed
as
t
i
= 1/k
k
m
j
(6)
PECCS2013-InternationalConferenceonPervasiveandEmbeddedComputingandCommunicationSystems
230
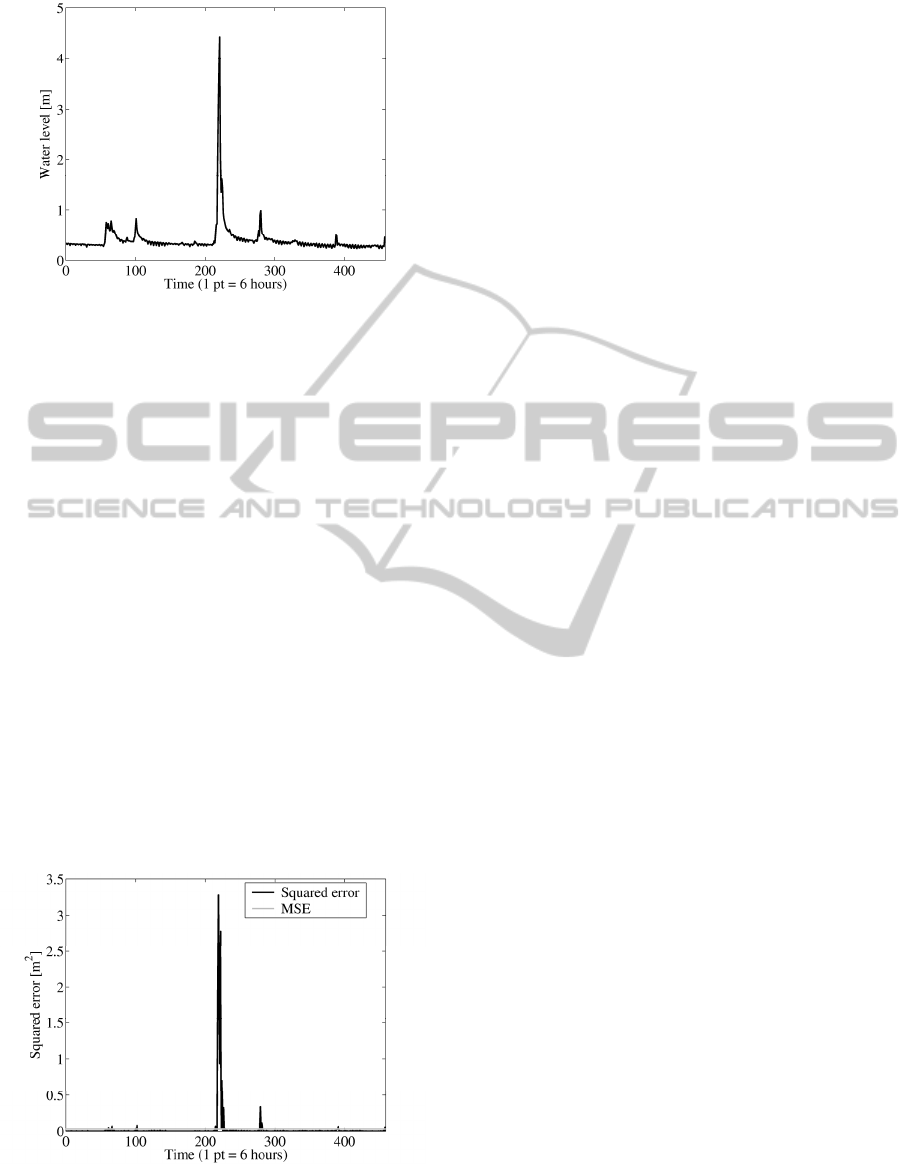
Figure 1: Aspio Terme (SIRMIP station code: 113)
averaged water level from January to April 2011.
where m
j
is the effective measured hydrometric
level and k is the number of measurements between
two consecutive predictions (i.e., 12 samples in 6
hours).
The following parameters have been found to be
optimal for the SVM training phase: C=0.5; =0.5
and =0.1. Such values have been obtained using a
coarse/fine grid search in the parameters space.
As an example to illustrate the performance of
the algorithm, six-hours averages of water level
measured at Aspio Terme section (few kilometres
far from Ancona city) during the test period (from
January to April 2011) are reported in Figure 1. First
sample corresponds to the average of 2011, January
6 from midnight to 6 AM local time (UTC+1).
Figure 2 shows the squared error between
measured and -SVR predicted values together with
the MSE obtained during the SVM model
optimization. It is possible to observe that only when
the water level rises rapidly and a flood peak occurs,
the corresponding SE results greater than MSE.
Figure 2: Squared error between SVM predicted and
measured water level at Aspio Terme during the test
period (black line) and MSE obtained in the training phase
(gray line).
Based on the prediction error, in the next section a
self-adaptive strategy is presented to adjust the
sensor sampling rate in order to reduce the power
consumption when no flood event is occurring. In
particular, the current sampling rate for the sensor is
decreased when SE is less than MSE and increased
again when SE results greater than MSE for a 6-
hours averaged hydrometric level.
4 PROPOSED SAMPLING
STRATEGY
The goal of the proposed event-driven sampling
strategy is to provide a cost effective monitoring of a
stream level. The basic idea of the method is the
exploitation of the considerable prediction error
committed by the SVM model only during a flood
event.
When SE
i
is greater than MSE for a 6-hours
averaged hydrometric level, it means that
| f(x
i
) – t
i
| > RMSE (7)
or equivalently
k
m
j
< T
–
k
m
j
> T
+
(8)
where RMSE is the root mean square error and the
thresholds T
±
are defined as
T
±
= k( f(x
i
) ± RMSE) (9)
The proposed strategy consists of the following
steps:
a. calculate and keep in memory 20 previous 6-
hours averaged levels;
b. run the regression model in order to predict next
6-hours averaged level;
each time a new measurement m
j
is taken
1. compare the partial sum of levels with threshold
T
+
to test for an under-prediction;
2. increase the sampling rate if T
+
is exceeded;
3. compare the total sum of levels with threshold T
−
to test for an over-prediction;
4. hold the sampling rate increased if at least one of
the two inequalities in (8) is verified;
5. decrease the sampling rate when (7) is not
verified.
According to the proposed strategy, only 19
samples out of 460 exceeded the RMSE threshold
level during the four-months test period at Aspio
Terme section. In other words, flood events occurred
during the test period lasted less than 5% of the
whole time.
ReducingPowerConsumptioninHydrometricLevelSensorNetworksusingSupportVectorMachines
231

For example halving the sampling rate when no
flood events are occurring, more than 47% of the
overall power consumption can be saved.
5 CONCLUSIONS
In this paper an event-driven adaptive sampling
strategy is proposed for embedded software systems.
Since Support Vector Machines can be
successfully used in time series regression, a new
efficient sampling strategy for sensor was devised
based on the difference between measured and
predicted level.
Although the method is also suitable for other
natural signals, we assumed that hydrometric level
sensors equipped with embedded software and data
storage are available.
SVMs model was built using real world
hydrometric data minimizing the mean square error,
and the model was then used to predict the water
level average over six hours. The system sample rate
can be so self-adapted using information from the
SVM optimization.
The proposed method does not require any a
priori information such as catchment characteristics
or alert flood thresholds.
Future research activity will face the feasibility
of combining information from different sensors to
improve prediction quality. In fact, when a sensor is
part of a larger hydrometric monitoring network,
information coming from available upstream level
sensors can be helpfully used in order to improve the
effectiveness of the sampling strategy.
ACKNOWLEDGEMENTS
This research was supported by Marche Region and
University of Camerino.
REFERENCES
Chang, C.-C., Lin, C.-J., 2002. Training -Support Vector
Regression: Theory and Algorithms. Neural
Computation 14 (8), 1959–1977.
Graaf, B., Lormans, M., Toetenel, H., 2003. Embedded
Software Engineering: The State of the Practice.
Software, IEEE 20 (6), 61–69.
Lee, E. A., 2002. Embedded software. Advances in
Computers 56, 55–95.
Pedregosa, F., Varoquaux, G. et al., 2011. Scikit-learn:
Machine Learning in Python. J. of Machine Learning
Research 12, 2825–2830.
Pellegrini, M., De Leone, R., Maponi, P., 2012. Adaptive
Sampling for Embedded Software Systems using
SVM: Application to Water Level Sensors. In Proc. of
the 11th Cologne-Twente Workshop on Graphs and
Combinatorial Optimization (CTW 2012), Brieden, A.,
Gorgulu, Z.-K., Krug, T., Kropat, E. Meyer-Nieberg,
S., Mihelcic, G., Pickl, S. W. (Eds.), 210–214.
Sakhanenko, N. A., Luger, G. F., Makaruk, H. E., Aubrey,
J. B., Holtkamp, D. B., 2006. Shock Physics Data
Reconstruction Using Support Vector Regression. Int.
J. of Modern Physics C 17 (9), 1313–1325.
Schölkopf, B., Smola, A., Williamson, R. C., Bartlett, P.
L., 2000. New Support Vector Algorithms. Neural
Computation 12, 1207–1245.
Soil Conservation Service (SCS), 1993, National
Engineering Handbook, Sect. 4: Hydrology, The U.S.
Department of Agriculture (USDA), Washington DC.
Smola, A., Schölkopf, B., 2004. A Tutorial on Support
Vector Regression. Statistics and Computing 14 (3),
199–222.
Tayfur, G., Singh. V. P., 2006. ANN and Fuzzy Logic
Models for Simulating Event-Based Rainfall-Runoff.
J. of Hydraulic Engineering 132 (12), 1321–1330.
Vapnik, V., 1998. Statistical Learning Theory, Wiley,
New York.
Wilson, J. W., 2006. Very Short Period (0-6) Forecasts of
Thunderstorms. In Proc. of the WMO-PWS Workshop
on Warnings of Real-Time Hazards by Using
Nowcasting Technology, Sidney, Australia, 2006,
October 9–13, WMO Final Report.
Zealand, C. M., Burn, D. H., Simonovic, S. P., 1999. Short
term streamflow forecasting using artificial neural
networks. J. of Hydrology 214, 32–48.
PECCS2013-InternationalConferenceonPervasiveandEmbeddedComputingandCommunicationSystems
232
