
An in-Field Calibrating Method for the Bilateral Filter Applied to
X-ray Flat Panel Grayscale Images with High Spectral Resolution
Fabiana Oliveira Paixão Fernandes
1
, Cássio Alves Carneiro
2
, Petr Iakovlevitch Ekel
1
,
Zélia Myriam Assis Peixoto
1
and Flávia Magalhães Freitas Ferreira
1
1
Graduate Program in Electrical Engineering, Pontifical Catholic University of Minas Gerais,
500 Dom José Gaspar Avenue, Belo Horizonte, Brazil
2
University Center of Sete Lagoas, Sete Lagoas, Brazil
Keywords: Bilateral Filter, Image Denoising, X-ray Images, Flat Panel.
Abstract: Several spatial filters applied to images are available in technical and scientific literature. Besides the
reduction of the noise level, some of them also aim at the preservation of edges and details. Those filters are
commonly applied to the processing of X-ray medical image sequences, which are usually noised due to the
low doses of radiation suitable for medical procedures but where the loss of any detail may impair a
diagnosis. In this context, the bilateral filter is well suited. However, an adequate calibration of the bilateral
filter is required for reaching the best cost benefit between reducing the noise level and preserving the image
edges. Calibration procedures are still underexplored in the literature thereby, this paper proposes a new
method that allows in-field calibration of the bilateral filter embedded into a piece of equipment for
angiography, which uses a flat panel X-ray detector. The proposed method can be applied to images with
any spectral resolution and surpasses the performance of the calibration method presented in the literature.
1 INTRODUCTION
The acquisition of X-ray images is carried out under
strict conditions of exposure time of the patient to
radiation and X-ray dosage. However, decreasing
the dose implies increasing the image noise level
suppressing important details and thus hindering the
diagnosis. Therefore, denoising of medical X-ray
images is of great importance as there is also the
concern to preserve the characteristics of the image
(Zhang et al., 2009).
In those cases, temporal filtering techniques are a
good tool for preserving image details, beyond of its
low complexity of implementation. However, in
sequences of images where some movement is
present, e.g. digital angiography for hemodynamic
tests, the classic temporal filtering techniques cannot
be applied, because they cause trails in the motion
direction. Thus, spatial filters may be used instead.
These filters are accomplished with convolution
masks applied to the pixels of the image. As a result
they reduce the noise level but also cause edge
smoothing usually. This shortcoming precludes their
use for medical purposes since losses are not
commonly allowed in accurate diagnosis. However,
some spatial filters are more likely to preserve
edges. A suitable example is the bilateral filter,
which combines a domain filter to a range filter. The
first takes into account the spatial distance between
neighboring pixels to calculate the mask weights,
while the second is concerned about the difference
between their gray intensities (Tomasi and
Manduchi, 1998).
In (Gabiger-Rose et al., 2011) a procedure to
calculate the parameters of the bilateral filter for
grayscale images with spectral resolution of 8 bits
was proposed. However, there are few works in the
literature that carry out studies on the application of
the bilateral filter to medical images with high
spectral resolution, e.g., 14 bits.
In this paper, major concerns of the authors are
to guarantee an industrial in-field calibration method
for bilateral filter embedded into medical apparatus
of angiography that are built with an X-ray flat panel
detector. Nowadays the denoising process applied in
this kind of equipment to process sequences of
moving images is the same as 50 years ago, i.e.,
consisting of same classical spatial filters, such as
the averaging filter. Firstly our study proposes a
slight modification into the equations for the filter`s
163
Oliveira Paixão Fernandes F., Alves Carneiro C., Iakovlevitch Ekel P., Assis Peixoto Z. and Magalhães Freitas Ferreira F..
An in-Field Calibrating Method for the Bilateral Filter Applied to X-ray Flat Panel Grayscale Images with High Spectral Resolution.
DOI: 10.5220/0004315201630168
In Proceedings of the 3rd International Conference on Pervasive Embedded Computing and Communication Systems (PECCS-2013), pages 163-168
ISBN: 978-989-8565-43-3
Copyright
c
2013 SCITEPRESS (Science and Technology Publications, Lda.)

parameters presented in Gabiger-Rose et al., (2011)
in order to extend the adjusting method of the
parameters to images with any bit resolution.
However, the largest contribution is the change in
that calibration methodology itself which results in
major gains in quality metrics when comparing to
the method of Gabiger-Rose et al., (2011).
This paper is organized as follows. After a brief
introduction of the bilateral filter in Section 2, a
short overview of the calibration method described
in Gabiger-Rose et al., (2011) is given in Section 3.
The proposed contributions that allow the in-field
calibrating method can be seen in Section 4. Section
5 shows experimental results already obtained and in
Section 6 one can find the conclusion of this work.
2 BILATERAL FILTER
The bilateral filter was firstly proposed by Tomasi
and Manduchi (1998) consisting of a discrete filter
applied in the spatial domain by using a convolution
mask, according to the Equation (1),
(,)( )
()
(,)
N
nN
N
nN
Wknxk n
yk
Wkn
(1)
where W(k,n) weighs the contribution of each
neighboring pixel x(k-n) inside the mask regarding
the calculation of the value of the processed pixel
x(k), k is the location of the central pixel of the mask
and n is the distance between the central pixel and
its neighbor. The two-dimensional filtering can be
performed in two one-dimensional steps.
In the bilateral filter, the contribution W(k,n) of
each neighboring pixel corresponds to the product of
the weight W
d
(n) of a domain filter that depends on
the spatial distance between the two pixels and on
the weight W
r
(k,n) of a range filter that depends on
the difference between the intensities of both
(Giraldo et al., 2009). The weights W
d
(n) and
W
r
(k,n) are determined by Equations (2) e (3), in
which σ
d
and σ
r
are adjusting parameters of the
decay curve of the filters weights in function of the
spatial distance n and of the difference of intensities
x(k-n) and x(k), respectively. The idea is that even
neighboring pixels very close, but very different in
intensity, provide a small contribution in the result
of the spatial filtering. Thus, the image edges are
better preserved and the noise level is reduced
mainly in the regions in which intensity levels are
more uniform.
2
2
() exp
2
d
d
n
Wn
(2)
2
2
() ( )
(,) exp
2
r
r
xk xk n
Wkn
(3)
The calibration of the bilateral filter consists of
determining the parameters
and
. It is
necessary to reach the best-cost benefit between
reducing the noise level and preserving the image
edges, objectives that are conflicting in nature.
3 ADJUSTMENT
3.1 Domain Filter
In Gabiger-Rose et al., (2011) it was presented a
method for the adjustment of the parameter σ
d
,
which depends only on the size of the convolution
mask. In order to approximate an ideal low-pass
filtering, the authors claim that the weighting
coefficients that would be outside the mask have to
be smaller than or equal to 10
-3
. This condition is
expressed in Equation (4), in which the size of the
one-dimensional mask is 2N+1.
3
max ( ) 10
d
nN
Wn
(4)
For a convolution mask of dimension 7x1, which
proved to be in our experiments the most appropriate
for filtering purposes, the calculated value for the
parameter σ
d
obeying Equation 4, with N=3 and n=4,
was 1.08.
Figure 1: Weights of masks 5x1 and 7x1 using σ
d
=1.08.
However, if
is equal to 1.08 in the 7x1 mask,
the value of the last coefficient inside the mask
(n=3) is very close to zero. Our first criticism of the
method refers to the mask 7x1 behaving very
similarly to the mask 5x1 as it can be observed in
PECCS2013-InternationalConferenceonPervasiveandEmbeddedComputingandCommunicationSystems
164

Figure 1, which depicts the weights W
d
(n), for n
varying from –N to +N, for masks 7x1 (blue circles)
and 5x1 (red bars).
3.2 Range Filter
The parameter σ
r
must be adjusted based on the level
of noise present in the image in order to reach the
best-cost benefit between reducing the noise level
and preserving the image edges.
Thus, in Gabiger-Rose et al., (2011) it was
proposed the determination of the parameter
as
the product of the noise standard deviation and a
factor R (Equation 5) which must be determined in
order to maximize either of the quantitative
performance metrics. The suggested metrics are the
PSNR (Peak Signal to Noise Ratio) and the MSSIM
(Mean Measure Structural Similarity) (Wang et al.,
2004), as a means of gaining perceptual proximity
with the Human Visual System (HVS). While PSNR
is measured in dB, MSSIM varies between 0 and 1
and evaluates quantitatively how close the output
image is of a reference image, in terms of intensity,
structure and contrast. Best results reflect on values
of MSSIM near 1.
*
r noise
R
(5)
To check the dependence of R in relation to the
statistical characteristics of noise, Gabiger-Rose et
al., (2011) used a test database composed by 50
images of 8-bit whose pixels were not normalized,
where it was included an additive Gaussian noise of
zero mean and variable standard deviation
noise
(variation in the range of 1 to 64, in steps of 4).
Images were filtered using a bilateral filter with
fixed
(calculated using Equation 4) and with
σ
r
calculated according to Equation (5), trying values
of R in the range of 0.5 to 16, in steps of 0.5. The
metrics PSNR and MSSIM are calculated separately
for each image, and finally, the average of these
metrics, considering all the images for each pair
(
noise
, R) is determined. These mean values then
become the characteristic values of the metrics for
each specific pair (
noise
, R). The idea is to choose
the parameter R that maximizes both characteristic
metrics, for each value of the parameter
noise
.
In order to highlight the differences among the
characteristic metrics obtained by using different
values of R, the characteristic metrics which refer to
a specific
noise
are normalized in relation to the
maximum value of that same set, in accordance with
Equation 6. Thus, the highest value of the
characteristic metrics for a specific
noise
is mapped
to the value 0 and its null value is mapped to the
value 1. If we generate a grayscale image aiming at
easier viewing and interpretation of these values, the
dark line at this image corresponds to the best
performance for different
noise
. Figure 2 shows the
visualization of data relating to the normalized
characteristic PSNR.
0.2
metrics
metrics 1
metrics
average
norm
max
(6)
Figure 2: Normalized characteristic PSNR as a function of
R and
noise
(Gabiger-Rose et al., 2011).
4 SENSITIVITY ANALYSIS OF
THE BILATERAL FILTER AND
THE IN-FIELD CALIBRATION
Unlike Gabiger-Rose et al., (2011), that found the
most presumably suitable parameter
d
according to
Equation 4 and kept this value invariant while
seeking the optimal R for different
noise
, our method
consists in applying a sensitivity analysis of the filter
regarding the parameters
d
and R, in order to
improve the adjustment of these parameters aiming
at optimizing either of the metrics, at a specific level
of
noise
.
Furthermore, the calibration method presented in
Gabiger-Rose et al. (2011) was applied only to 8 bits
grayscale images. However, medical images are
generally encoded with 14 bits. Thereby, in order to
make the calibration procedure independent of
spectral resolution, we first normalize the image
pixels between 0 and 1.
In the calibration procedure, an industrial
phantom acquired in real conditions of medical
procedures must be used due to the need for having
sequential multiple still images in order to find a
reference image, presumably noise-free, for the
calculation of the metrics. This procedure is not
possible with real medical images since it would
submit the patient to long exposures to X-rays. The
calibration phantom must have density
Anin-FieldCalibratingMethodfortheBilateralFilterAppliedtoX-rayFlatPanelGrayscaleImageswithHighSpectral
Resolution
165
characteristics that simulate different tissues of the
human body as well as frequency components that
simulate structures present in the medical procedures
such as blood vessels, bone structures, calcifications
and catheters. The phantom image is processed by
bilateral filter and the filtered image is compared to
the reference image in order to compute the metrics.
The reference image is obtained from a temporal
average of 8 frames of the calibration phantom,
acquired at different times. The value of
noise
,
necessary to compute
r
in accordance with
Equation 5
is estimated from the histogram of the
difference between one of the noisy image frames
and the reference image after normalizing their
pixels.
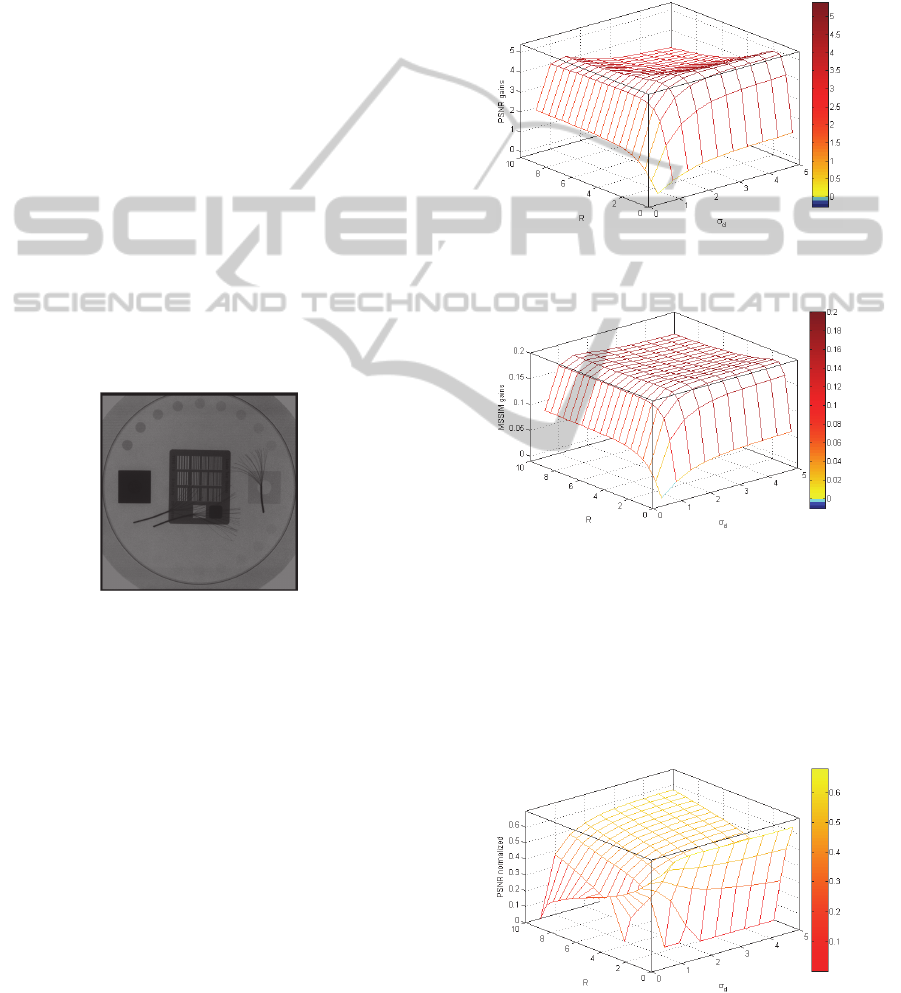
In our experiments, the calibration phantom
image shown in Figure 3 was acquired with the
equipment AngiX III FD, manufactured by Brazilian
company Xpro. The estimated value for
noise
was
0.026. The sensitivity analysis with respect to the
filter parameters was performed by varying both σ
d
and R. The first varied from 0.5 to 5, in steps of 0.5
and the second varied from 0.5 to 10, in steps of 0.5.
The metrics PSNR and MSSIM were calculated for
the calibrating phantom image for each (
, R) pair.
Figure 3: Calibrating phantom image.
Figures 4 and 5 provide visualization of PSNR
and MSSIM gains for helping with the analysis of
filter sensitivity to the parameters adjustment in
which the hot colors correspond to positive gains
while the cold colors correspond to negative gains,
respectively. The metrics gain refers to the
difference between the metrics for the filtered image
and the metrics for the noisy image, before the
application of the filter. The graphs in Figures 6 and
7, in turn, correspond to the metrics (PSNR and
MSSIM, respectively) normalized in accordance
with Equation (6), where metrics
max
corresponds to
the maximum value of each metrics for a fixed value
of
. These figures do not intend to compare the
performance of the filter to each (
, R) pair.
Instead, they just give an insight into the
determination of the optimum R for a specific value
of
,since they assign, with a zero value in the z-
axis, the value of R that optimizes the filter
performance at each
.
From Figures 4 and 5, it can be noticed that the
best performance of the bilateral filter is achieved
for larger values of
d
, which contradicts the choice
of the parameter
d
proposed in Gabiger-Rose et al.
(2011).
Figure 4: PSNR gains (dB) as a function of
d
and R using
the calibrating phantom.
Figure 5: MSSIM gains as a function of
d
and R using the
calibrating phantom.
From Figures 6 and 7, it can be verified that the
lower the value of
d
, the larger the expected value
of R aiming at optimizing performance. However,
for values of
d
greater 2.5, the optimum R does not
change and it is equal to 2 for the calibration
phantom.
Figure 6: Normalized values for PSNR (dB) as a function
of σ
d
and R using the calibrating phantom.
PECCS2013-InternationalConferenceonPervasiveandEmbeddedComputingandCommunicationSystems
166
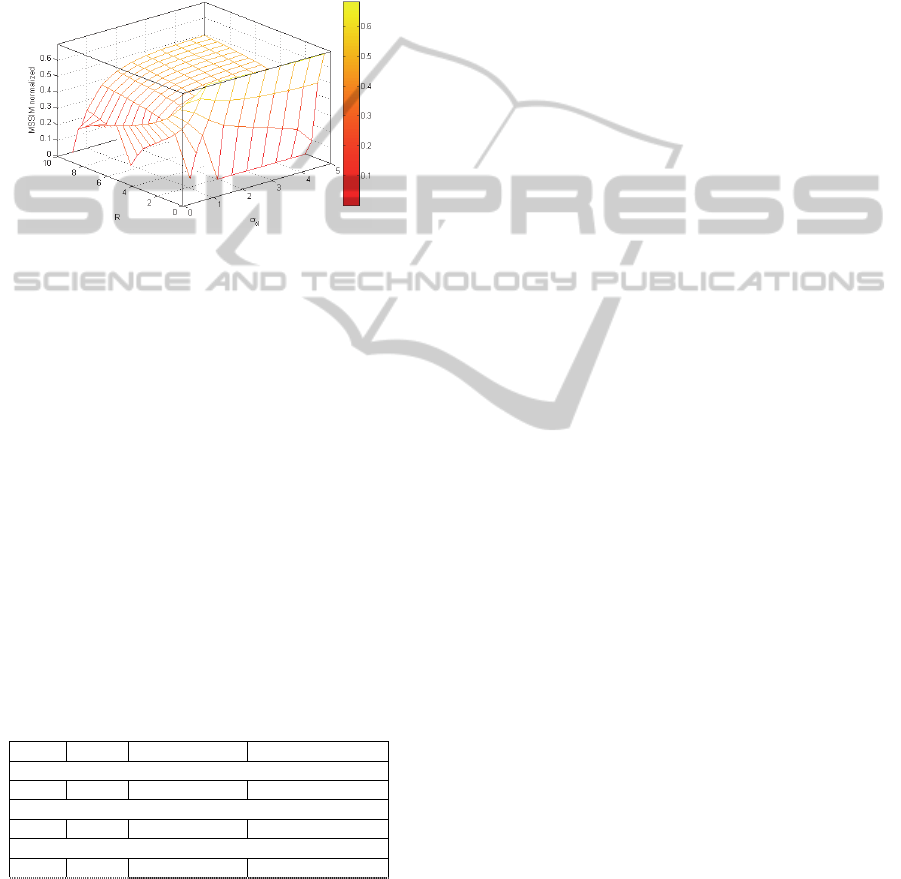
It is worth noticing that the classic average filter
is equivalent to the bilateral filter with the highest
values of
d
and R. In other words, it corresponds to
the worst performance of the bilateral filter.
It is concluded from the proposed calibration
method and using the shown calibration phantom,
we choose to adjust the two parameters of the
bilateral filter with values
3 and R=2, using a
7x1 convolution mask.
Figure 7: Normalized values for MSSIM as a function of
σ
d
and R using the calibrating phantom.
5 RESULTS
The in-field calibrated bilateral filter (implemented
in Matlab) was then used to reduce the noise level at
the image of a test phantom, shown in Figure 8, also
acquired by AngiX III FD in equivalent conditions
of real medical procedures. The achieved gains of
PSNR and MSSIM are shown in Table 1 at three
different conditions: first,
1.08 and R=5 which
are the values found through the method presented
in Gabiger-Rose et al., (2011); second,
3 and
R=2 which are the optimum values found by our
calibrating method; and third,
3 and R=10
which corresponds to the classic average filter for
which the PSNR presented a decrease of 0.231dB.
Table 1: PSNR and MSSIM gains using the test phantom.
R
PSNR gains
MSSIM gains
Gabiger-Rose et al. (2011)
1.08 5 2.7093 0.0948
Our in-field calibratin method
3 2 3.0753 0.1085
Classic average filter
3 10 -0.231 -0.0327
Making a subjective analysis on images of
Figure 8, it is noticed that with
3 and R=10 the
image is plainly blurry, that is, visible losses occur at
the edges. With the method presented in Gabiger-
Rose et al., (2011),
1.08 and R=5, the noise
level is not reduced as expected.
The bilateral filter was also applied on a real
medical image with 14 bits, shown in Figure 9.
Although the metrics PSNR and MSSIM cannot be
calculated due to the lack of the reference image, we
compared the performance of our in-field calibration
procedure to the performance of the method
presented in Gabiger-Rose et al., (2011) by
analyzing the visual quality of the filtered images.
Visual inspection of the image obtained from the
classic average filter is also performed. It can be
noted that the perceptual analysis carried out for the
real medical image leads to the same achievements
gotten for the test phantom.
6 CONCLUSIONS
The bilateral filter is used in several recent papers
and it is notable for owning the feature of preserving
edges. However, the literature lacks a clear and
efficient procedure to calibrate the parameters of this
filter. The majority of papers that process grayscale
images encoded with 8 bits only mentions the values
of the used parameters of the filters and do not show
the way they were determined. Fortunately, from the
calibration procedure presented in Gabiger-Rose et
al., (2011) for 8 bits images, we were able to
generalize the original proposal to the case of
images with any spectral resolution. Besides that, we
present a more accurate industrial in-field procedure
to find the values of the parameters of the filter that
optimize either PSNR or MSSIM using a phantom
image acquired by the X-ray flat panel equipment
itself. The denoising process of X-ray images using
the bilateral filter properly calibrated gave us a
superior result in terms of noise level reduction and
edge preservation, when comparing to works
presented in recent literature. This was verified not
only from metrics calculated from phantom images
but also from visual inspection of filtered real
medical images. It is important to stress that our
proposal is that this industrial in-field calibration
procedure can be applied in practical operation
conditions of medical pieces of equipment of
angiography that use X -ray flat panel detector. The
method intends to provide X-ray images with higher
quality independent of flat panel manufacturer, as
well as of total harmonic distortion of the network
power distribution and of other parameters that
influence the quality of the acquired images, like
local temperature and humidity.
Anin-FieldCalibratingMethodfortheBilateralFilterAppliedtoX-rayFlatPanelGrayscaleImageswithHighSpectral
Resolution
167
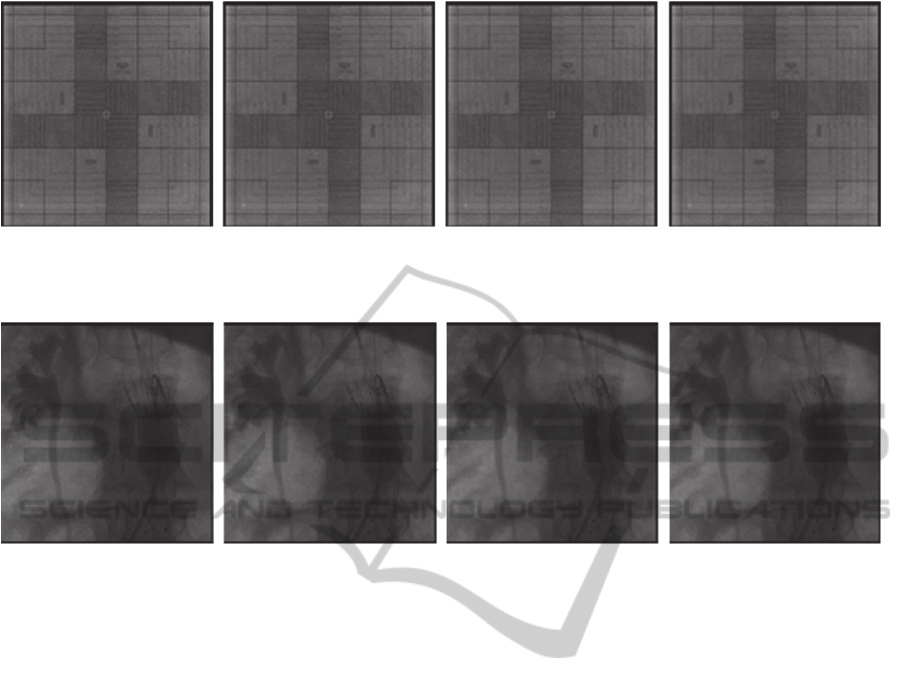
(a) (b) (c) (d)
Figure 8: Test phantom (a) noisy image (b) denoised image:
1 and R=5 (c) denoised image:
3 and R=2 (d)
denoised image:
3 and R=10.
(a) (b) (c) (d)
Figure 9: Medical Image (a) noisy image (b) denoised image: σ
d
=1 and R=5 (c) denoised image: σ
d
=3 and R=2 (d) denoised
image: σ
d
=3 and R=10.
REFERENCES
Gabiger-Rose, A., Kube, M., Schmitt, P., Weigel, R., &
Rose, R., (2011). Image Denoising Using Bilateral
Filter With Noise-Adaptive Parameter Tuning. 37th
Annual Conference on IEEE Industrial Electronics
Society.
Giraldo, J., Kelm, Z., Guimaraes, L., Yu, L., Fletcher, J.,
Erickson, B. and McCollough, C., (2009).
Comparative Study of Two Image Space Noise
Reduction Methods for Computed Tomography:
Bilateral Filter and Nonlocal Means. 31st Annual
International Conference of the IEEE EMBS.
Minneapolis, Minnesota, USA.
Tomasi, C., and Manduchi, R., (1998). Bilateral Filtering
for Gray and Color Images. IEEE International
Conference on Computer Vision. Bombay, India.
Wang, Z., Bovik, A., Sheikh, H. and Simoncelli, E.,
(2004). Image Quality Assessment: From Error
Visibility to Structural Similarity. IEEE Transactions
on Image Processing, 13, 600-612.
Zhang, L., Chen, J., Zhu, Y. and Luo, Z., (2009).
Comparisons of Several New De-Noising Methods for
Medical Images. 3rd International Conference on
Bioinformatics and Biomedical Engineering.
PECCS2013-InternationalConferenceonPervasiveandEmbeddedComputingandCommunicationSystems
168
