
Performability Modeling of Manual Resolution of Data
Inconsistencies for Optimization of Data Synchronization Interval
Kumiko Tadano, Jianwen Xiang, Fumio Machida, and Yoshiharu Maeno
NEC corporation, Tokyo, Japan
Keywords: Performability, Stochastic Reward Net, Data Synchronization.
Abstract: For disaster recovery, many database systems with valuable data have been designed with database
synchronization between main and backup sites. The data synchronization interval affects the performability
of system which is a combined measure of performance and availability. It is important to determine the
optimal synchronization interval in terms of performability so as to satisfy customers' requirements.
However, existing techniques to identify the optimal synchronization interval do not consider the
performability impacts of time-consuming manual resolution task for inconsistent data. To address this issue,
this paper proposes a method to identify the data synchronization interval which optimizes performability
by solving a stochastic reward net model describing the manual and automatic failure-recovery behavior of
a database system. Several numerical examples are given to demonstrate the proposed method and its
potential practical applicability.
1 INTRODUCTION
For disaster recovery, many database systems with
valuable data have been designed with database
synchronization between main and backup sites. A
system designer needs to select a proper database
synchronization method so as to satisfy customer’s
requirements such as performance, availability,
recovery point objective (RPO) and recovery time
objective (RTO). Hereafter, a system which
synchronizes databases for backup and fast failover
is called a database synchronization system, or
shortly DB system.
In general, the system designer needs to
determine a synchronization interval for the DB
system by considering both of performance and
availability, i.e., performability. For example, if high
performance of processing requests from users is
required, a primary server which processes the
requests in the main site often needs to commit
transactions without synchronization (writing the
transactions in a disk of a secondary server in the
backup site) for a relatively long time (some widely-
used commercial relational database management
systems, such as Microsoft SQL Server 2008 with
high performance mode, exhibit this behavior.). In
this case, as the synchronization interval becomes
longer, the performance of the DB system increases
at the cost of that the probability of occurrence of
data inconsistencies between the primary and
secondary servers also increases. This is because
that the transaction logs in the primary server are
sent to the secondary server after a certain amount of
transaction logs are accumulated, and the
accumulated unsent transaction logs are at risk of
lost due to DB system failure. On the other hand, if
the system designer shortens the synchronization
interval for higher availability, the primary server
has to wait for the synchronization more frequently.
This may result in lower performance, but the
possibility of occurrence of data inconsistencies may
decrease.
When the DB system fails, if data inconsistencies
caused by the lost transaction logs are unacceptable
in terms of RPO, a system operator needs to resolve
data inconsistencies so as to satisfy the RPO before
the DB system resumes its services. RPO is used to
represent the maximum tolerable time interval in
which data might be lost when system failure occurs.
However, it is generally difficult to resolve data
inconsistencies especially in large-scale enterprise
DB systems. The system operator needs to
determine and resolve data inconsistencies in order
to resume services of the DB system. Since the
determination and resolution of data inconsistencies
233
Tadano K., Xiang J., Machida F. and Maeno Y..
Performability Modeling of Manual Resolution of Data Inconsistencies for Optimization of Data Synchronization Interval.
DOI: 10.5220/0004318602330240
In Proceedings of the 1st International Conference on Model-Driven Engineering and Software Development (MODELSWARD-2013), pages 233-240
ISBN: 978-989-8565-42-6
Copyright
c
2013 SCITEPRESS (Science and Technology Publications, Lda.)

require manual system operations by the system
operator, it takes long time to recover from the
system failure. This long downtime of the DB
system results in low system availability.
Consequently, the probability of that the time
interval in which data might be lost is within RPO is
highly affected by the synchronization interval. The
probability increases as the ratio of RPO to the
synchronization interval increases. Meanwhile, as
mentioned previously, the shorter synchronization
interval leads to lower performance of the DB
system.
In order to handle the trade-off between
performance and availability, many techniques to
determine the optimal checkpoint interval in terms
of performance, availability and reliability have been
studied. Many researchers proposed performance
models based on periodic checkpoint (e.g., (Dohi,
Ozaki and Kaio, 2002), (Young, 1974), (Chandy,
1975), (Baccelli, 1981), and (Gelenbe and
Hernandez, 1990)). The aperiodic checkpoint
placement methods to minimize execution time of
programs or tasks were proposed in the literatures
such as (Duda, 1983) and (Toueg and Babaoglu,
1984), and the methods to identify the optimal
checkpoint placement in terms of cost could be
found in (Fukumoto et al., 1992), (Ling et al., 2001),
(Dohi et al., 2002), (Ozaki et al., 2004), and (Ozaki
et al., 2006). However, these existing works do not
consider the effect of the time-consuming manual
resolution of data inconsistencies on performability.
To address this issue, we propose a method to
identify a synchronization interval which optimizes
performability by taking into account the effect of
the time-consuming manual resolution of data
inconsistencies on performability. The proposed
method identifies the optimal synchronization
interval by solving a stochastic reward nets (SRNs)
model (Trivedi, 2001) describing manual and
automatic failure-recovery behaviors of the DB
system with a given RPO. The proposed method is
quantitatively investigated in numerical examples of
identification of the optimal synchronization interval
in terms of performability. The proposed method
was studied as a part of a development project of an
in-house model-based system design and non-
functional property evaluation environment called
CASSI (Izukura et al., 2011). In design phase of a
system, CASSI predicts performance and
availability based on analytic models which are
automatically synthesized from system design in the
form of Systems Modeling Language (SysML). We
proposed several techniques for the automatic model
synthesis (e.g., (Machida et al., 2011) and (Tadano
et al., 2012)) and proposed model in this paper is
studied as an analytic model to improve the
prediction for DB systems.
This paper is organized as follows. Section 2
proposes performability optimization method.
Section 3 shows some numerical examples of the
proposed method. Section 4 gives summary and
future directions.
2 OPTIMAL
SYNCHRONIZATION
INTERVAL IDENTIFICATION
METHOD
This section describes the proposed method to
identify the optimal synchronization interval in
terms of performability. In order to identify the
optimal synchronization interval by taking into
account the effect of the time-consuming manual
resolution of data inconsistencies on performability,
a performability model for representing the behavior
of manual and automatic failure-recovery of the DB
system is introduced.
2.1 Overview
The proposed method identifies the optimal
synchronization interval based on the performability
model. As shown in Figure 1, in the proposed
method, the following steps are performed:
1. Input of parameters’ values of the
performability model
2. Performability model analysis
3. Identification of the optimal
synchronization interval
4. Modification of design of the DB system
In Step 1, the system designer inputs parameters
of the performability model according to the current
design of the DB system.
In Step 2, the proposed method analyzes the
performability based on the performability model
with the input parameter values.
In Step 3, based on the analysis results, the
proposed method identifies the optimal
synchronization interval which maximizes
performability.
In Step 4, the system designer modifies the
design of the DB system based on the identified
optimal synchronization interval.
MODELSWARD2013-InternationalConferenceonModel-DrivenEngineeringandSoftwareDevelopment
234
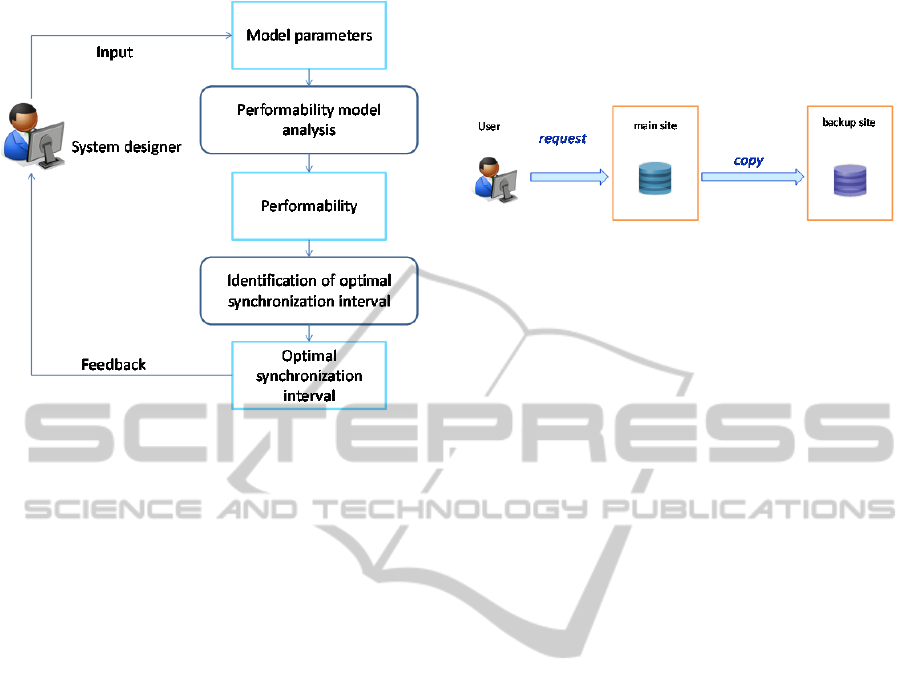
Figure 1: Overview of the proposed optimal
synchronization interval identification method.
2.2 Target DB Systems
Figure 2 shows our target DB system including the
primary and secondary servers in the main and
backup sites. In the DB system, we assume the
following four conditions.
1. When the DB system failed, if the time interval
in which data might be lost is more than RPO,
the system operator resolves data inconsistencies
with the manual system operations. Otherwise,
automatic failover to the secondary server is
performed in time much shorter than that
required for the manual resolution of data
inconsistencies. In this case, the DB system
automatically performs roll-forward of the
database, system reconfiguration to resume its
services and roll-back in the background (Such
automatic recovery of database systems is
performed in Microsoft SQL Server 2012 for
example).
2. The time to resolve data inconsistencies caused
by system failure increases, as the database
synchronization interval increases. This is
because the longer synchronization interval leads
to the larger amount of the unsent, remaining
transaction logs in the primary server.
3. Database synchronization always succeeds, and
the DB system with a synchronization interval
smaller than RPO always satisfies RPO.
Therefore, in this paper we consider the
synchronization interval larger than RPO only.
4. As the ratio of RPO to the synchronization
interval increases, the probability at which the
time interval in which data might be lost is
within RPO increases, as mentioned in Section 1.
Figure 2: Target DB system.
2.3 Performability Model
To characterize the behavior of the DB system in
terms of performability, we introduce a
performability model in the form of stochastic
reward nets (SRNs) which represents the behavior of
occurrence of software failure, detection of the
failure, and manual and automatic recovery from the
failure in a DB system. In this paper, we define
performability as average throughput over both up
time and down time of the DB system.
Figure 3 shows the performability model of the
DB system. In the performability model, each state
of the DB system is described as a place represented
by a circle as shown in Table 1. The performability
model contains seven places: P
u
, P
f
, P
d
, P
rf
, P
rc
, P
rb
and P
dr
. The current state of the DB system is
represented by a place which has a token. Each
transition from one state to another state is
represented by firing of a transition, with transition
rates/probabilities as shown in Table 2. Performance
is defined as throughput of the DB system per unit
time. Performance in each state is represented by a
reward rate r
i
associated with a place P
i
(i=u, f, d, dr,
rf, rc or rb), as shown in Table 3. The performability
model includes the following parameter values: six
transition rates (t
f
, t
d
, t
rf
, t
rc
, t
rb
and t
dr
), seven reward
rates (r
u
, r
f
, r
d
, r
rf
, r
rc
, r
rb
and r
dr
), a value of RPO
(t
rpo
) and a range of a value of a synchronization
interval (t
s
). We define a as probability at which the
target system satisfies the RPO (i.e., the time
interval in which data might be lost is within RPO)
when the system failed. Based on the assumptions
mentioned in the previous subsection, the value of a
is calculated by “RPO (t
rpo
) / synchronization
interval (t
s
)”. Since we assume that roll-back can be
performed in the background, the value of r
rb
is set
to non-zero value smaller than r
u
. The reward rates
other than r
u
and r
rb
are considered to be zero,
because the DB system usually cannot process
requests from users. As described earlier in the
assumptions, t
dr
increases as t
s
increases. The values
PerformabilityModelingofManualResolutionofDataInconsistenciesforOptimizationofDataSynchronizationInterval
235

of these parameters vary depending on the systems.
These parameters’ values are input by the system
designer.
The behavior of the performability model is as
follows. Initial marking in Figure 3 means that the
DB system starts from a properly-functioning state,
which is represented by the token in the place P
u
.
After a certain time interval, the DB system goes to
a failure state, which is represented by firing of a
timed transition T
f
, and the token goes from P
u
to P
f
at a transition rate 1/t
f
. After a certain time interval
(e.g. an interval of heartbeat or health check query),
the token goes to a detected state represented by the
place P
d
. Immediately after that, the token goes to
the place P
dr
at a transition probability a, which
represents a manual recovery state in which
unacceptable data inconsistencies in terms of RPO
are caused by the system failure and the system
operator resolves it manually. Then the token finally
returns to its initial place P
u
at a transition rate 1/t
dr
.
The value of
t
dr
depends on the size of the remaining
logs in the primary server which could not send to
the secondary server, and the system operator’s skill.
Otherwise, the system failed but data inconsistencies
are small enough to be ignored and automatic
recovery can be performed. In this case the token
goes to the place P
rf
for roll-forward, at a transition
probability 1-a. Then the token goes to the place P
rc
for system reconfiguration, at a transition rate 1/t
rf
.
Then the token moves to the place P
rb
for roll-back,
at a transition rate 1/t
rc
. Then the token finally
returns to its initial place P
u
at a transition rate 1/t
rb
.
The values of transition rates and t
rpo
vary depending
on the systems.
The proposed method analyzes the
performability based on the model by varying the
value of t
s
in the range specified by the system
designer. Based on the analysis results,
performability of the DB system is calculated. Let p
be performability of the DB system, let r
i
be a
reward rate assigned to a place P
i
(i=u, f, d, dr, rf, rc
or rb), and let
i
be the expected number of tokens in
P
i
in steady-state. p is calculated using the following
formula:
∙
.
(1)
The optimal synchronization interval is identified
as the value of t
s
which achieves the largest value of
performability. Based on the identified optimal
synchronization interval, the system designer
improves the design of the DB system to achieve
higher system performability.
Figure 3: Performability model capturing the behavior of
failure-recovery of DB system including manual
resolution of data inconsistencies.
Table 1: Places of the Performability Model.
Place Description
P
u
The DB system is properly-functioning
P
f
The DB system failed and the failure is not detected yet
P
d
The failure of the DB system is detected
P
rf
The DB system is performing roll-forward
P
rc
The DB system is performing reconfiguration
P
rb
The DB system resumed its service and is performing
roll-back
P
dr
System operator is resolving data inconsistencies caused
by the failure with the manual system operations
Table 2: Parameters of the performability model.
Parameter Description
t
s
Synchronization interval of the DB system
t
rpo
Recovery point objective (RPO)
a
Probability at which the DB system does not satisfy
the RPO when the DB system failed (=t
r
p
o
/ t
s
)
t
dr
Time to resolve data inconsistencies caused by the
failure of the DB system
t
f
Time to failure of the DB system
t
d
Time to detect the failure of the DB system
t
rf
Time to finish roll-forward of database of the DB
system
t
rc
Time to re-configure the DB system
t
rb
Time to finish roll-back of the database of the DB
system
Table 3: Reward rates of the performability model.
Reward
rate
Description
r
u
P
erformance of the DB system per unit time durin
g
p
roperly-functioning
r
f
P
erformance of the DB system per unit time from whe
n
t
he system failed to when the system failure is detected
r
d
P
erformance of the DB system per unit time from whe
n
t
he system failure is detected to when the recover
y
o
peration is started
r
rf
P
erformance of the DB system per unit time durin
g
r
olling forward
r
rc
P
erformance of the DB system per unit time durin
g
r
econfiguration of the system
r
rb
P
erformance of the DB system per unit time durin
g
r
olling bac
k
r
dr
P
erformance of the DB system per unit time durin
g
m
anual resolution of data inconsistencies by the syste
m
o
perato
r
a
1‐a
1/t
d
P
f
P
d
P
rc
P
rf
P
dr
1/t
f
P
u
P
rb
1/t
rf
1/t
rc
1/t
rb
1/t
dr
MODELSWARD2013-InternationalConferenceonModel-DrivenEngineeringandSoftwareDevelopment
236
3 NUMERICAL EXAMPLES
We analyze performability by solving the
performability model of the DB system with given
parameter values under several assumptions using
SPNP (Hirel et al, 2000).
3.1 Assumptions
We computed performability under the following
assumptions. Performance of the DB system in
properly-functioning state decreases as the data
synchronization interval increases. Roll-back is
performed as background process after the failed DB
system resumes its services. When performing roll-
back, the performance decreases to a half of the
performance when the system is properly-
functioning. The transition rates are exponentially
distributed.
3.2 Parameters Settings
The parameters’ values are as follows. We set t
rpo
, t
f,
t
d
, t
rf
, t
rc
, and t
rb
to 1[h], 1440[h], 40[sec], 1[min],
1[min], and 2[min], respectively. Note that the
parameters’ values may vary with system
configuration. For t
d
and t
rf
, we used default values
of SQL server 2012. For other parameters, we used
arbitrary but reasonably set parameters’ values under
the mentioned assumptions. Since the value of t
dr
highly depends on systems (e.g., the ratio of RPO to
t
s
, frequency of data updates by users and
complexity of data structure), we set t
dr
to 1, 12, and
24 [h]. Since throughput during properly-functioning
state decreases as the
t
s
increases, r
u
is set to 1-c/t
s
where c is a parameter representing the size of
contribution of
t
s
to performance in the properly-
functioning state. r
rb
is set to r
u
/2. Other reward rates
are set to 0.
3.3 Analysis Results
Based on the parameters’ values, we calculate
performability, by varying the value of t
s
in the
range of [1.0-50.0] at a step 0.1. The details of the
analysis results are as follows.
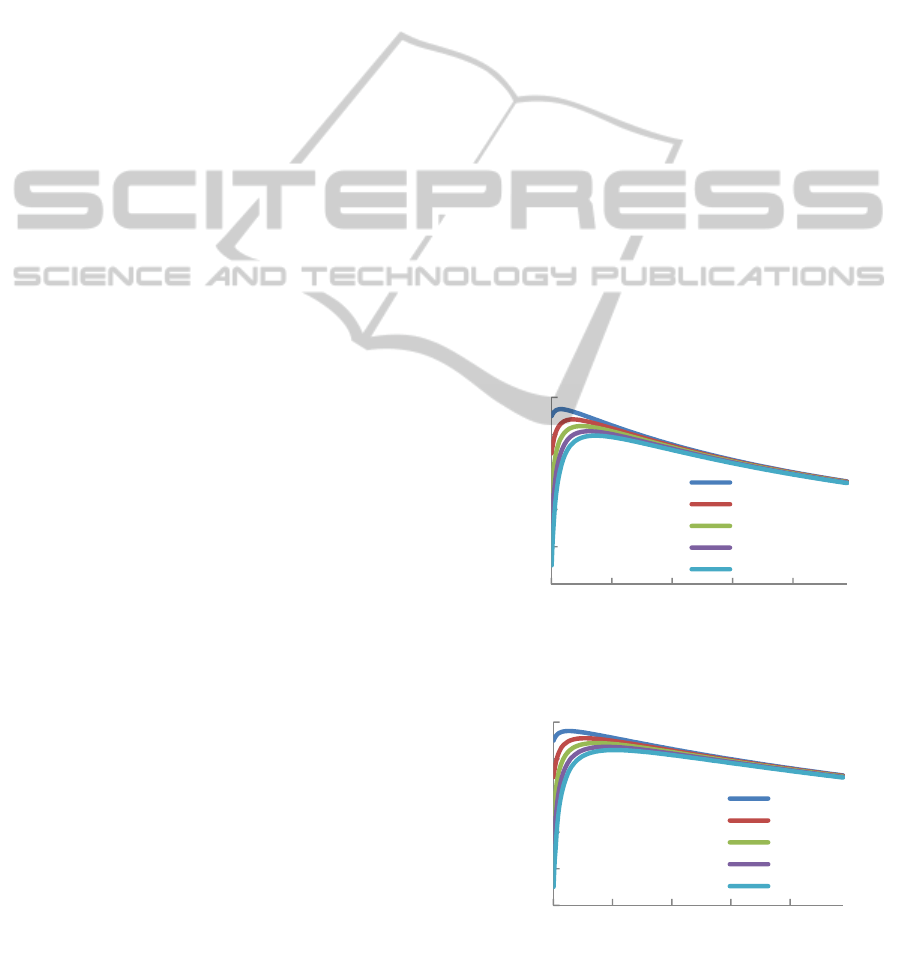
Figures 4, 5 and 6 show the analysis results
where t
dr
is 24, 12 and 1, respectively. The
horizontal axis represents the synchronization
interval
t
s
, and the vertical axis represents
performability. The results indicate that with
increasing c, performability decreases and the value
of
t
s
which maximizes performability increases.
Differences in performability for different values of
c decreases with an increase in
t
s
. When the value of
t
s
is infinity, theoretically performability for all
values of c becomes the same, since no
synchronization occurs in this condition. When
t
s
is
smaller than the value which maximizes
performability, performability sharply rises with an
increase of
t
s
. Meanwhile, when t
s
is larger than the
value, change in performability becomes smaller.
Figures 7 through 11 show analysis results where
c is 0.1, 0.3, 0.5, 0.7 and 0.9, respectively. The
results indicate that the value of
t
s
which maximizes
performability increases as t
dr
increases. The larger
value of t
dr
leads to greater change in performability.
Table 4 summarizes the value of
t
s
which
maximize performability and the maximum value of
performability, for each value of t
dr
and c. The
results clearly indicate that as t
dr
increases, the
values of t
s
which maximize performability decrease
and the maximum values of performability also
decrease, for all values of c.
In summary, the analysis results show that the
value of t
dr
is highly influential to performability. By
taking into account the effect of t
dr
on performability,
the proposed method enables the system designer to
identify the optimal synchronization interval in
terms of performability. The identification would be
useful for design improvement of the DB systems.
Figure 4: The relationship between performability and
synchronization interval at t
dr
= 24.
Figure 5: The relationship between performability and
synchronization interval at t
dr
= 12.
0
0,2
0,4
0,6
0,8
1
1 11213141
Performability
Synchronizationintervalts[hours]
c=0.1
c=0.3
c=0.5
c=0.7
c=0.9
0
0,2
0,4
0,6
0,8
1
1 11213141
Performability
Synchronizationintervalts[hours]
c=0.1
c=0.3
c=0.5
c=0.7
c=0.9
PerformabilityModelingofManualResolutionofDataInconsistenciesforOptimizationofDataSynchronizationInterval
237
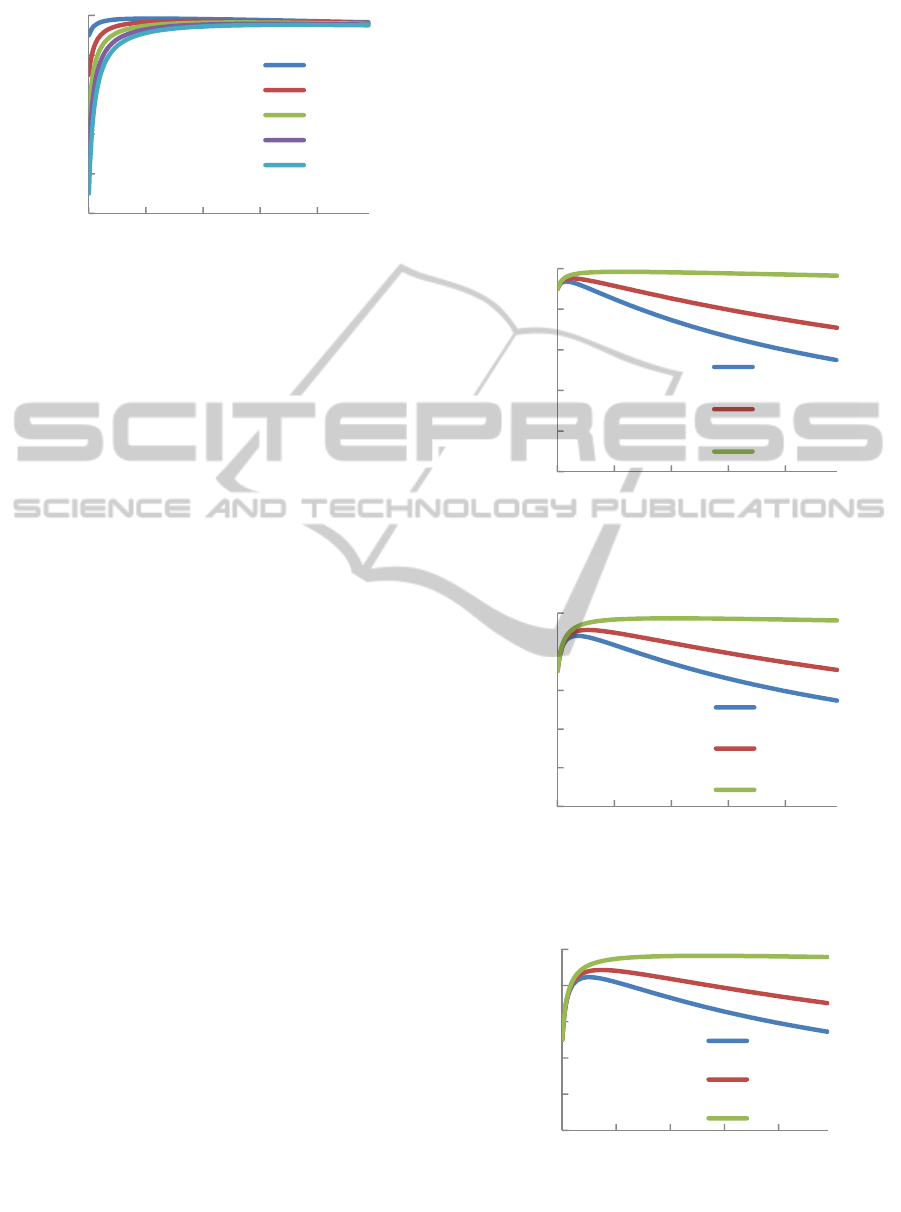
Figure 6: The relationship between performability and
synchronization interval at t
dr
= 1.
3.4 Discussion
In this section, we have solved the performability
model capturing the time-consuming resolution of
data inconsistencies. The analysis results indicate
that with increasing t
dr
, the values of t
s
which
maximize performability decrease (i.e., overhead for
synchronization increases) and the achievable values
of performability decrease. As can be seen in the
numerical examples, the value of t
dr
has a large
impact on performability. Therefore, for system
design improvement, not only common methods to
increase
r
u
such as to utilize broader bandwidth
network between the main and backup sites, to
upgrade hardware to enhance performance, to add
servers to distribute load for processing the request
from the users, but also methods to reduce
t
dr
such as
to train the system operator for higher skill and to
prepare scripts for various situations of failure-
recovery in advance are considered important. The
value of t
dr
highly depends on the system operator’s
skill. The value of t
dr
also would vary with many
factors such as complexity of data stored in the DB
system, system configuration, human errors under
time pressure. We need to estimate the value of t
dr
by properly taking the factors into consideration.
Although the proposed method is applicable to
various DB systems, the limitation of the proposed
method is that the value of t
s
needs to be variable. If
it is difficult or impossible to set the value of t
s
to the
optimal value obtained from the proposed method in
the DB system (for instance, the synchronization
interval cannot be reduced to the values less than a
certain value because of limitation of network
bandwidth in the DB system), the proposed method
helps the system designer to determine the
synchronization interval which maximizes
performability within the allowable range of t
s
.
In this paper, we focus on incorporating system
designer’s behaviour into the performability model,
by considering the time-consuming resolution of
data inconsistencies. In contrast, we do not consider
the behaviour of users (clients) such as temporal
trend of incoming requests from the users. For
example, many failed systems tend to have sharp
increase in access from the users immediately after
service resumption, which might make the system
unstable. Considering the trend of external load will
be an issue in the future.
Figure 7: The relationship between performability and
synchronization interval at c = 0.1.
Figure 8: The relationship between performability and
synchronization interval at c = 0.3.
Figure 9: The relationship between performability and
synchronization interval at c = 0.5.
0
0,2
0,4
0,6
0,8
1
1 11213141
Performability
Synchronizationintervalts[hours]
c=0.1
c=0.3
c=0.5
c=0.7
c=0.9
0
0,2
0,4
0,6
0,8
1
1 11213141
Performability
Synchronizationintervalts[hours]
tdr=24
tdr=12
tdr=1
0
0,2
0,4
0,6
0,8
1
1 11213141
Performability
Synchronizationintervalts[hours]
tdr=24
tdr=12
tdr=1
0
0,2
0,4
0,6
0,8
1
1 11213141
Performability
Synchronizationintervalts
[hours]
tdr=24
tdr=12
tdr=1
MODELSWARD2013-InternationalConferenceonModel-DrivenEngineeringandSoftwareDevelopment
238
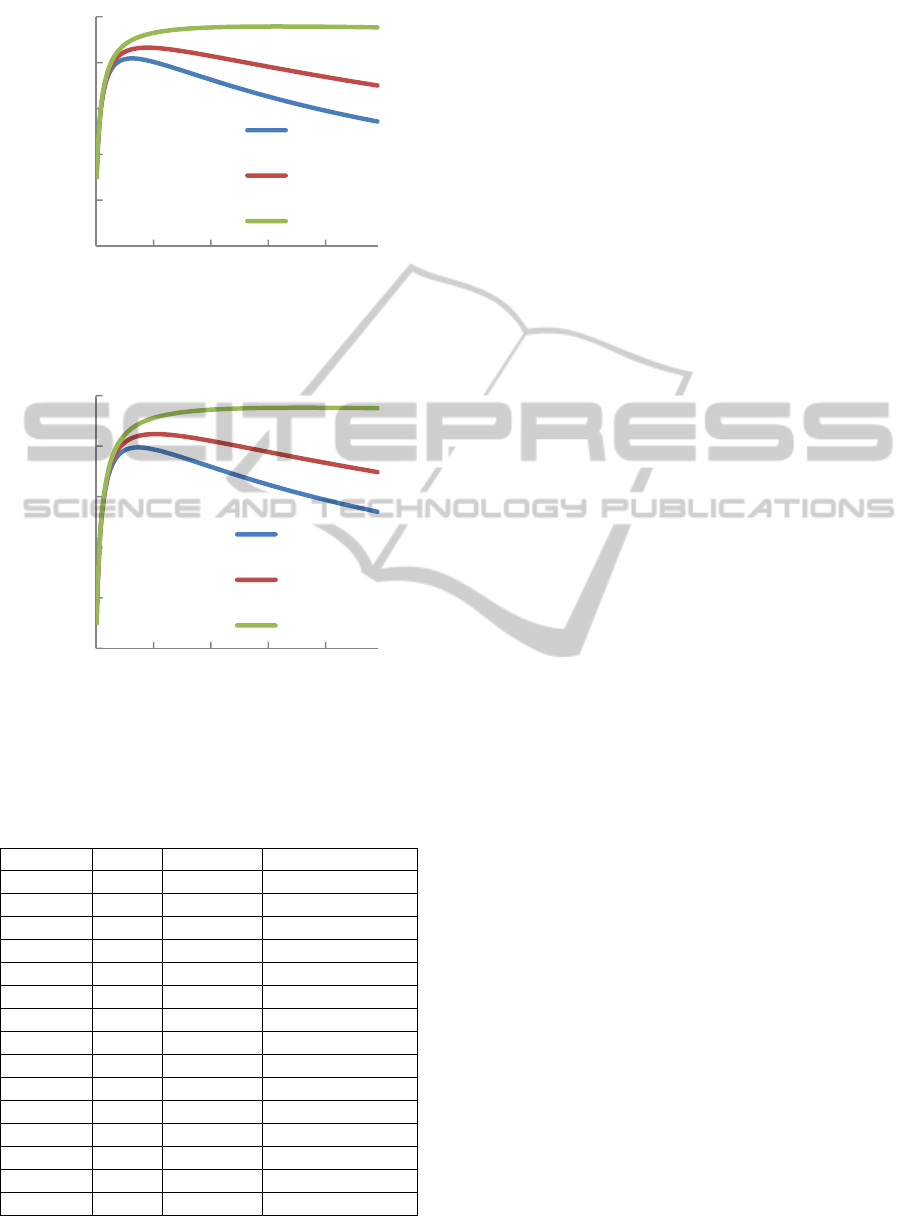
Figure 10: The relationship between performability and
synchronization interval at c = 0.7.
Figure 11: The relationship between performability and
synchronization interval at c = 0.9.
Table 4: The values of t
s
when the values of performability
become largest.
c t
d
r
t
s
Performability
0.1 24 2.5 0.936566
12 3.6 0.951588
1 12 0.984139
0.3 24 4.5 0.881877
12 6.3 0.912085
1 21.1 0.972203
0.5 24 6 0.846143
12 8.2 0.885862
1 27.3 0.964069
0.7 24 7.2 0.818218
12 9.8 0.86512
1 32.4 0.957508
0.9 24 8.2 0.794852
12 11.3 0.847593
1 36.8 0.951871
4 SUMMARY AND FUTURE
WORK
In this paper, we have proposed a method to identify
the synchronization interval that maximizes
performability by taking into account the effect of
the time-consuming manual resolution of data
inconsistencies on performability. The proposed
method identifies the optimal synchronization
interval by solving a SRN describing manual and
automatic failure-recovery behaviors of a DB system
under a given RPO. Our numerical results show that
the value of the time to resolve data inconsistencies
has a significant impact on performability. The
proposed method enables system designers to
identify the optimal synchronization interval in
terms of performability.
We plan to improve the performability model by
considering more human factors and external load,
and to develop a method to obtain accurate values of
the transition rates and the reward rates.
REFERENCES
Dohi, T., Ozaki, T. and Kaio, N., 2006. Optimal
Checkpoint Placement with Equality Constraints. In
DASC'06, 2
nd
Symp. on Dependable, Autonomic and
Secure Computing, 77-84, IEEE CS Press.
Young, J. W., 1974. A first order approximation to the
optimum checkpoint interval. Comm. of the ACM, 17
(9), 530–531.
Chandy, K. M., Browne, J. C., Dissly, C. W. and Uhrig, W.
R., 1975. Analytic models for rollback and recovery
strategies in database systems. IEEE Trans. on
Software Eng., SE-1 (1), 100–110.
Dohi, T., Kaio, N. and Trivedi, K. S., 2002. Availability
models with age dependent-checkpointing. In SRDS-
2002, 21st Sympo. on Reliable Distributed Systems,
130–139, IEEE CS Press.
Baccelli, F., 1981 Analysis of service facility with
periodic checkpointing, Acta Informatica, 15, 67–81.
Gelenbe, E. and Hernandez, M., 1990. Optimum
checkpoints with age dependent failures, Acta
Informatica, 27, 519–531.
Duda, A., 1983. The effects of checkpointing on program
execution time, Information Processing Letters, 16 (5),
221–229.
Toueg, S. and Babaoglu, O., 1984. On the optimum
checkpoint selection problem. SIAM J. of Computing,
13 (3), 630–649.
Fukumoto, S., Kaio, N. and Osaki, S., 1992. A study of
checkpoint generations for a database recovery
mechanism, Computers Math. Applic., 24(1/2), 63–70.
Ling, Y., Mi, J. and Lin, X., 2001. A variational calculus
0
0,2
0,4
0,6
0,8
1
1 11213141
Performability
Synchronizationintervalts[hours]
tdr=24
tdr=12
tdr=1
0
0,2
0,4
0,6
0,8
1
1 11213141
Performability
Synchronizationintervalts[hours]
tdr=24
tdr=12
tdr=1
PerformabilityModelingofManualResolutionofDataInconsistenciesforOptimizationofDataSynchronizationInterval
239

approach to optimal checkpoint placement, IEEE
Trans. on Computers, 50 (7), 699–707.
Ozaki, T., Dohi, T., Okamura, H. and Kaio, N., 2006.
Distribution-free checkpoint placement algorithms
based on min-max principle, IEEE Trans. on
Dependable and Secure Computing, 3 (2), 130–140.
Ozaki, T., Dohi, T., Okamura, H. and Kaio, N., 2004.
Min-Max Checkpoint Placement under Incomplete
Failure Information. In DSN’04, 2004 Int. Conf. on
Dependable Systems and Networks, 721-730, IEEE CS
Press.
Trivedi, K. S., 2001. Probability and Statistics with
Reliability, Queuing, and Computer Science
Applications. John Wiley, New York, 2001.
Izukura, S., Yanoo, K., Osaki, T., Sakaki, H., Kimura, D.,
Xiang, J., 2011. Applying a Model-Based Approach to
IT Systems Development Using SysML Extension. In
MoDELS 2011, 14th Int. Conf. on Model Driven
Engineering Languages and Systems, 563-577.
Hirel, C., Tuffin, B., and Trivedi, K. S., 2001. SPNP:
Stochastic Petri Nets. Version 6.0. In TOOLS 2000,
354-357.
Tadano, K., Machida, F., Xiang, J., and Maeno, Y., 2012,
Identification of Minimal Unacceptable Combinations
of Simultaneous Component Failures in Information
Systems. IN PRDC’12, 18th IEEE Pacific Rim Int.
Symp. on Dependable Computing, 21-30.
Machida, F., Andrade, E.C., Kim, D., and Trivedi, K.,
2011. Candy: Component-based availability modeling
framework for cloud service management using
SysML, In SRDS’11, Int. Symp. on reliable
distributed systems.
MODELSWARD2013-InternationalConferenceonModel-DrivenEngineeringandSoftwareDevelopment
240
