
Identification of Molecular Properties Coding Areas in Rat’s
Olfactory Bulb by Rank Products
Raquel Santano-Martínez
2
, Raquel Leiva-González
2
, Milad Avazbeigi
1,2,3
,
Agustín Gutiérrez-Gálvez
1,2
and Santiago Marco
1,2
1
Institut for Bioengineering of Catalonia, Baldiri i Rexach 4-8, 08028-Barcelona, Spain
2
Departament d’Electrònica, Universitat de Barcelona, Martí i Franqués 1, 08028-Barcelona, Spain
3
European Center for Soft Computing, Gonzalo Gutiérrez Quirós s/n, 33600-Mieres, Asturias, Spain
Keywords: Olfaction, Odour Coding, Feature Selection, Olfactory Bulb, Chemotopy, 2-Deoxyglucose Uptake.
Abstract: Neural coding of chemical information is still under strong debate. It is clear that, in vertebrates, neural
representation in the olfactory bulb is a key for understanding a putative odour code. To explore this code,
in this work we have studied a public dataset of radio images of 2-Deoxyglucose uptake (2-DG) in the
olfactory bulb of rats in response to diverse odorants using univariate pixel selection algorithms: rank-
products and Mann-Whitney U (MWU) test. Initial results indicate that some chemical properties of
odorants preferentially activate certain areas of the rat olfactory bulb. While non-parametric test (MWU) has
difficulties to detect these regions, rank-product provides a higher power of detection.
1 INTRODUCTION
Olfaction is the main chemical sense and it is key for
basic animal survival since it determines food
intake, sexual mating among others basic functions.
It is known that humans are able to differentiate
thousands of low molecular mass, typically organic
compounds. This sense is the least studied and, it is
not known how olfaction encodes chemical
information about the odorants yet. While due to the
advances in genomics, we know today the family of
G-coupled protein receptors in sequenced species,
the affinity those receptors have for the huge number
of putative ligands is only barely known (Hallem
and Carlson, 2006); (Mori et al., 2006). However, it
is well known that chemical information is coded in
a combinatorial way and that OR are only partially
selective. That is, a single odorant may excite many
diverse OR and an OR responds to a set of ligands
with diverse affinity levels (Malnic et al., 1999).
The current dogma of olfaction is that olfactory
sensory neurons (OSN) express a single type of
olfactory receptor (OR) and that sensory neurons
expressing the same receptor converge to the same
glomerolous. The system is characterized by a large
degree of convergence where millions of OSN
converge to few thousands of glomeruli. In the rat
about 1200 OR are supposed to be active for a total
number of glomeruli of about 2400 (Johnson and
Leon, 2007); (Meister and Bonhoeffer, 2001).
Since each glomerulus only receives inputs from
OSN featuring the same OR receptor, it has been
argued that glomerular activity maps could be a
convenient way to explore how chemical
information is encoded in the olfactory bulb. In this
sense, Leon and Johnson (LJ), in a long and
persistent effort, have acquired 2-DG uptake radio
images for a large number of diverse odorants (Leon
and Johnson, 1999). In this work, we attempt to
determine if certain molecular properties excite
particular areas or modules within the olfactory
bulb. This hipothesis has been formulated by Leon
and Johnson, but without backing statistical analysis
of the available data. This Leon and Johnson dataset
has been previously analyzed by the authors for
clustering (Falasconi et al., 2012), coding capacity
(Fonollosa et al., 2012) and properties coding
(Auffarth et al., 2011). In this work, we go deeper in
this last point using a non-parametric hypothesis
testing and newer state of the art feature selection
methods originally proposed for Microarray data
analysis.
383
Santano-Martínez R., Leiva-González R., Avazbeigi M., González-Gutiérrez A. and Marco S..
Identification of Molecular Properties Coding Areas in Rat’s Olfactory Bulb by Rank Products.
DOI: 10.5220/0004327403830387
In Proceedings of the International Conference on Bio-inspired Systems and Signal Processing (BIOSIGNALS-2013), pages 383-387
ISBN: 978-989-8565-36-5
Copyright
c
2013 SCITEPRESS (Science and Technology Publications, Lda.)
2 MATERIALS AND METHODS
2.1 Activity Maps and Molecular
Features Datasets
In order to carry out this study we employed the
olfactory bulb (OB) activity dataset obtained by the
group of Leon & Johnson at the University of
California in Irvine. They captured OB activity in
response to a large set of odorants with diverse
chemical structures. This activity was measured
crossways the complete glomerular layer of the rat
OB and mapped using uptake of [14C]-radio labeled
2-deoxyglucose (2DG) (Leon and Johnson, 2003). A
remarkable advantage of this technique is that it
allows observation of the complete olfactory bulb,
but the main drawback is that one can examine the
image for just one odor at one concentration per
experimental animal (Johnson and Leon, 2007).
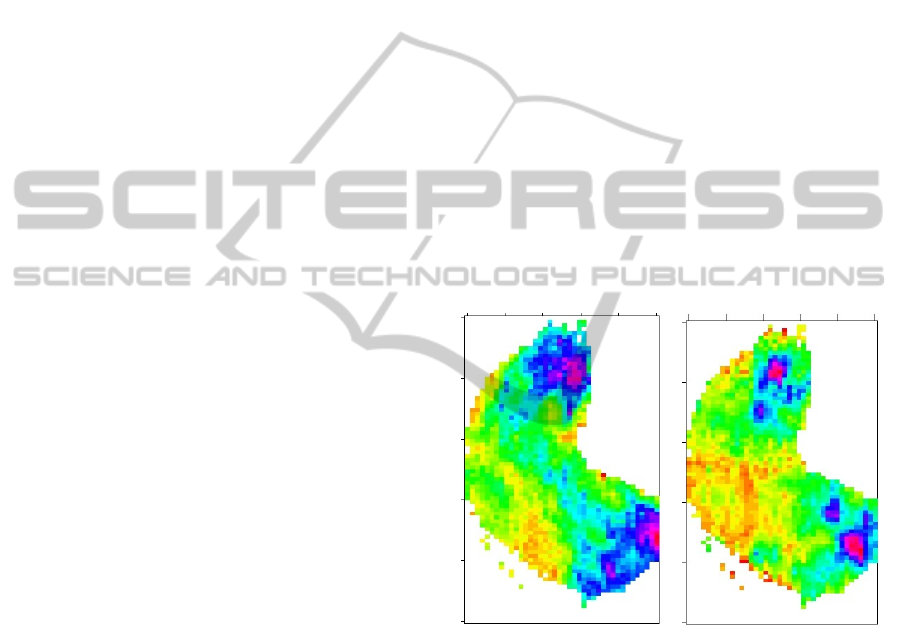
Examples of glomerular activity maps are shown
in figure 1 for two selected odorants. It is important
to realize that these glomerular maps are not the
result of direct imaging of the olfactory bulb, but
synthetic images built from a series of
autoradiographies of sections of the OB. The exact
imaging procedure is described in detail by Johnson.
(Johnson et al., 1999). For the sake of completeness
here we present a short summary of the process to
build these images. For more details, please refer to
the original publication.
The OB was cut perpendicularly to the long axis
and every sixth 20µm section was used to
autoradiography. The original autoradiographies
were digitized at 108 pixels/mm achieving
glomerular resolution.
A main objective of the image formation process
is to align the images in order to standardize the
anatomical differences from animal to animal. On
the one hand, three anatomical landmarks were used
to standardize rostral–caudal distances between
bulbs: the first cresyl violet–stained section that
possessed an external plexiform layer, the first
section that contained an accessory olfactory bulb
and the last section that contained a mitral cell layer
on its medial aspect. Using a total of 78 animals they
found that the average bulb measures 3.0 mm (25
sections) from the first external plexiform layer to
the first accessory bulb and 2.28 mm (19 sections)
from here to the last mitral cell section. These 44
sections correspond to the columns of the image. On
the other hand, they created a standard grid for y
axis of the image with 80 pixels by row. The image
has 80 active pixels in the section with the largest
glomerular layer. For the other sections, the number
of active pixels is reduced in such a way that each
pixel corresponds to the mean activity in circular
areas of about 120µm of diameter. Due to these
image formation procedures, the resulting maps are
aligned to anatomical landmarks and do not require
further alignment.
The data across five rats exposed to the same
stimulus was averaged to obtain the two-
dimensional (80x44 pixels) activity maps reducing
biological variability. Possibly, if authors only had
used one image per rat, the resolution of the images
could be glomerular (the magnification is 108
pixels/mm).
The complete dataset has 472 group-averaged
maps in response to 339 diverse odorants, some of
them at different concentrations. Furthermore, as a
result of the experimental process, most of the
activity maps include missing values, generally
dispersed in the ventro-caudal and dorsal parts and
on the border of the activity map (Falasconi et al.,
2012). We restricted our analysis to the 1778 pixels
that were represented in all the maps; these pixels
cover almost the entire OB, except its borders.
Figure 1: The activity maps of 4-tert-butylpyridine (left),
and 2-acetylpyridine (right).
Besides the activity dataset, we have a molecular
descriptor dataset for some of odorant stimuli. It
contains a list of odorants, identified with their CAS
number, and with 67 molecular properties that
describes them (Leon and Johnson, 2003). From the
initial 339 individual odorants, for this work we
performed the analysis with 155 odorants and a set
of binary molecular properties. Table 1 lists the
selected binary properties that refer to different
functional groups and different cyclization
structures.
BIOSIGNALS2013-InternationalConferenceonBio-inspiredSystemsandSignalProcessing
384
2.2 Data Analysis
For each molecular descriptor, we statistically tested
whether a pixel was differentially activated in the
target group vs. the control group. For this analysis
we have used, as baseline technique, a non-
parametric hypothesis test: the Mann-Whitney U
test. However, in the last decade permutation tests
have been proposed to improve test power. Among
the different options for permutation tests, we have
chosen rank-products.
2.2.1 Rank Products
Rank Products is a rather new technique mostly used
to identify differentially expressed genes in
microarray experiments. This procedure is derived
from biological analysis and provides us a simple
way to establish the significance level of each
element analyzed calculating rank products (RP)
from replicate experiments (Breitling et al., 2004).
In our case we will use it in order to detect
differentially activated pixels in a neuroimage. This
test can be used in other application domains: for the
analysis of diverse –omics data and general feature
selection (Smit et al., 2007). As far as we know, it
has not been previously used for the analysis of
brain activity.
The underlying assumptions for this technique
are fairly weak thanks to its non-parametric nature
and, additionally, the results also are consistent in
highly noisy data or when a small amount of
replicates are obtainable, and it is very robust against
outliers. For this analysis we used the RankProd
Package for R. The used function permits to control
the estimated percentage of false predictions (pfp)
(Hong et al., 2006). We performed 1000
permutations and we selected the pixels that have a
pfp < 10
-5
.
2.2.2 Mann-Whitney U Test
The Wilcoxon rank-sum test, also called Mann-
Whitney U test (MWU), is a non-parametric
statistical hypothesis test that determines if one
distribution is stochastically greater than the other.
When we use conventional hypothesis testing in
this context, we must take into account the multiple
comparison problems. The p-values have to be
adjusted to control the probability of any pixel
hypothesis. This is formally known as family-wise
Type I error rate. To carry out this test we use
multtest package of R (Pollard et al., 2005). To cope
with the multiple comparison problems we have
used the Benjamini and Yekutieli correction
(Yekutieli and Benjamini, 1999).We selected the
pixels with a corrected p-value < 0.05.
3 RESULTS
In order to obtain the significant pixels of each
molecular feature analyzed, we compute both
statistics. For the MWU, more demanding p-values
resulted in few selected pixels. Even at this
significance level (p<0.05) there are some molecular
properties that do not show significant pixels. Table
1 shows the number of significant pixels obtained
for the selected molecular features, by Rank
Products and by MWU Test. It can be observed that
even at very demanding pfp rank-products selects
more pixels than MWU.
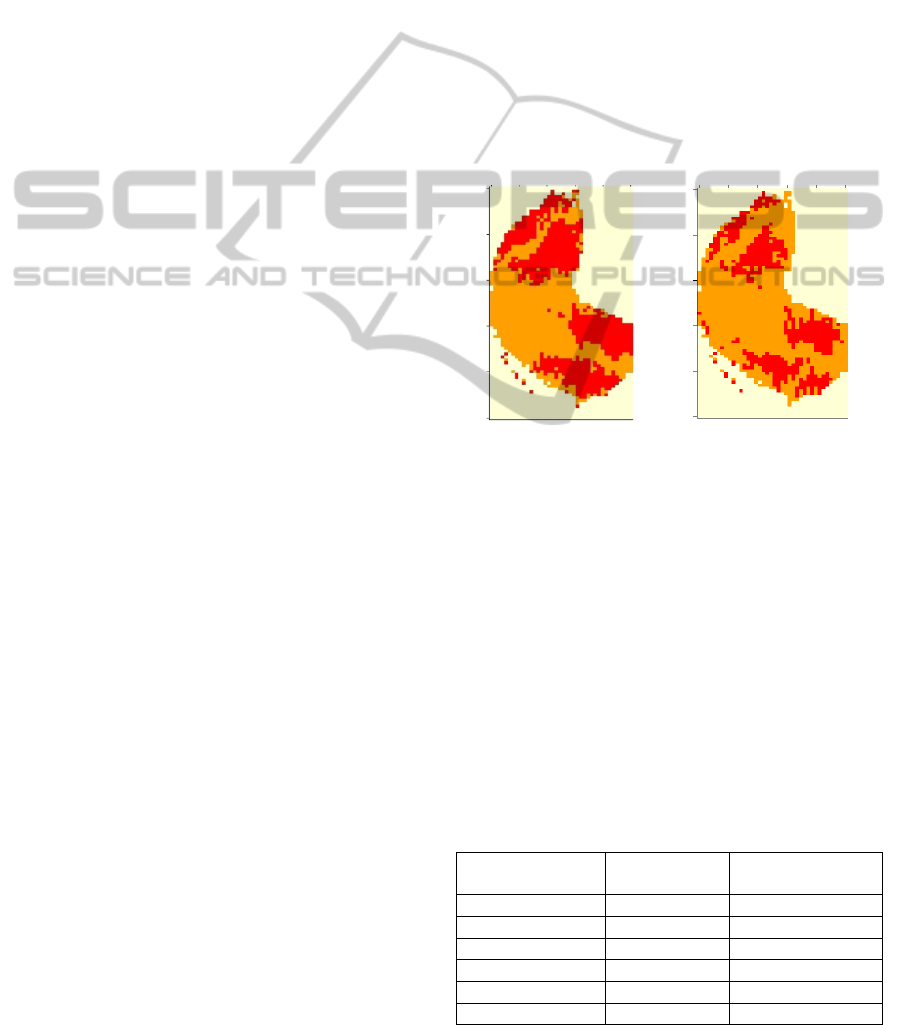
Figure 2: Active regions in olfactory bulb for aromatic
descriptor obtained by RP (left), and MWU Test (right).
We can locate the significant pixels obtained in
the olfactory bulb to visualize the active areas. In
figure 2 we can observe the results of both tests for
the aromatic feature. As we can observe both tests
show approximately the same active regions, but the
Rank-products seems less noisy.
At figure 3 we can notice that there are different
actives areas for each molecular feature. For some
properties (aromatic, alcohol or ketone) the
technique identifies clear regions that show the well-
known image symmetry of the activation in the OB.
Instead, other properties show scattered pixels and
the interpretation is not so clear.
Table 1: Number of significant pixels for each method.
Molecular feature Rank Products
(pfp < 10
-5
)
Wilcoxon Test
(p-value < 0.05)
Aromatic 796 530
Alcohol 512 39
Alicyclic 127 0
Heterocyclic 126 0
Ester 311 0
Ketone 303 62
IdentificationofMolecularPropertiesCodingAreasinRat'sOlfactoryBulbbyRankProducts
385
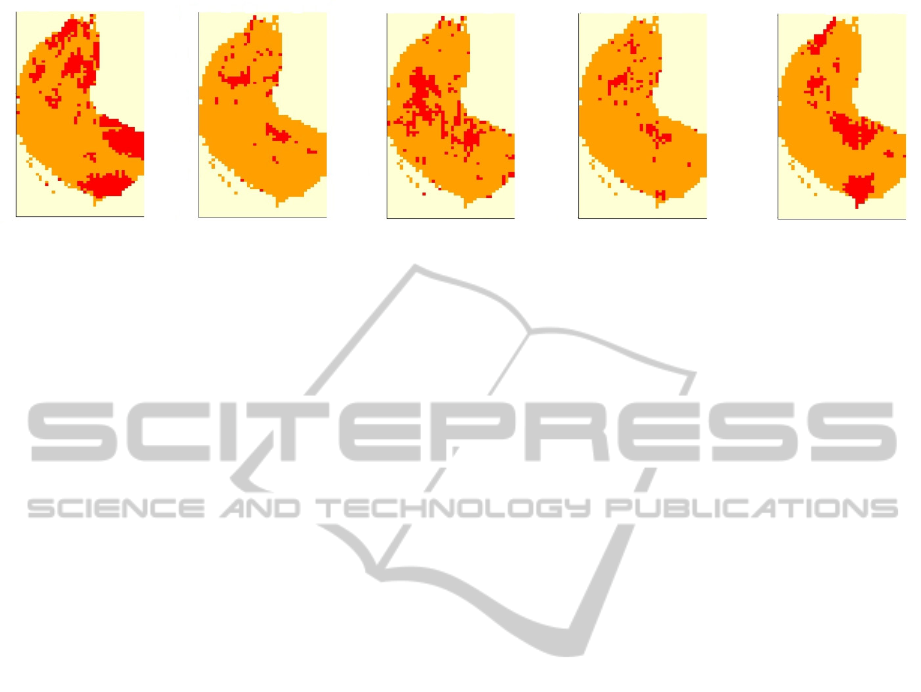
Figure 3: From left to right alcohol, alicyclic, ester, heterocyclic and ketone significant regions obtained by Rank Products
with pfp=10
-5
.
4 DISCUSSION
A first outcome of this analysis is the clear
difference in hypothesis test power from rank-
products to the MWU test. This was somewhat
expected, but the results clearly show that MWU
fails completely to identify differentially active areas
for some properties.
Concerning the biological interpretation of the
present results, we have to consider that the
existence of a chemotopical organization at the level
of the OB is controversial. While few groups
consider this proven (Johnson and Leon, 2007);
(Mori et al., 2006), recent results seem to prove the
contrary (Soucy et al., 2009).
The chemotopic organization in the OB has been
supported observing that odorants containing similar
functional groups have similar responses of the
activation in the olfactory bulb (Mori et al., 2006);
(Takahashi et al., 2004). Eventually, this could allow
the prediction of the neural activation pattern from
an odorant and vice versa. This is not proved yet.
The identification of coding areas for different
chemical properties is hindered by the high
dimensionality of chemical information, that is, one
odorant can be described by hundreds (or thousands)
of chemical properties. When the target group shares
one property, all the rest may change introducing a
high level of noise.
While for some properties our results are very
clear (aromatic or ketones), many recent studies
claim that the real code is spatio-temporal, and that
2-DG images fully neglect the temporal dimension
of the code. While this could be true, these results
seem to indicate that the spatial part of the code can
convey important information at least for selected
properties.
The authors are aware of the limitations of the LJ
dataset, and consider the present analysis and
discussion limited to the analyzed data. Further
elaboration on this topic will come from the analysis
of newer imaging techniques with glomerular
resolution that additionally are able to see the
activation dynamics in response to the odorant pulse.
5 CONCLUSIONS
Reported results indicate rank-products as a
convenient pixel selection technique to locate
differentially active areas in response to particular
stimulus (in this case odorants sharing certain
molecular descriptors). This technique succeeds for
properties where conventional non-parametric
testing catastrophically fails.
Previously discussions on the existence of
chemotopy in the OB lacked a supporting statistical
analysis of the available data. This results support
the argument that at least for selected chemical
properties, there are differentially active areas that
are topologically connected (Takahashi et al., 2004).
This goes against recent studies that report that
particular chemical properties are encoded in
scattered glomeruli in the OB (Meister and
Bonhoeffer, 2001); (Ma et al., 2012).
ACKNOWLEDGEMENTS
The authors are members of the SGR2009-0753
consolidated research group (Generalitat de
Catalunya, Spain). The authors thank the group
around Michael Leon and Brett Johnson at the
University of California at Irvine for collecting and
providing the data.
BIOSIGNALS2013-InternationalConferenceonBio-inspiredSystemsandSignalProcessing
386

REFERENCES
Auffarth, B., Gutierrez-Galvez, A. and Marco, S., 2011.
Statistical analysis of coding for molecular properties
in the olfactory bulb. Frontiers in systems
neuroscience, 5, pp. 62.
Breitling, R., Armengaud, P., Amtmann, A. and Herzyk,
P., 2004. Rank products: a simple, yet powerful, new
method to detect differentially regulated genes in
replicated microarray experiments. FEBS letters,
573(1-3), pp. 83-92.
Falasconi, M., Gutierrez-Galvez, A., Leon, M., Johnson,
B.A. and MARCO, S., 2012. Cluster analysis of rat
olfactory bulb responses to diverse odorants. Chemical
senses, 37(7), pp. 639-653.
Fonollosa, J., Gutierrez-Galvez, A. and Marco, S., 2012.
Quality coding by neural populations in the early
olfactory pathway: analysis using information theory
and lessons for artificial olfactory systems. PloS one,
7(6), pp. e37809.
Hallem, E. A. and Carlson, J. R., 2006. Coding of odors
by a receptor repertoire. Cell, 125(1), pp. 143-160.
Hong, F., Breitling, R., Mcentee, C. W., Wittner, B. .,
Nemhauser, J. L. and Chory, J., 2006. RankProd: a
bioconductor package for detecting differentially
expressed genes in meta-analysis. Bioinformatics
(Oxford, England), 22(22), pp. 2825-2827.
Johnson, B. A. and Leon, M., 2007. Chemotopic odorant
coding in a mammalian olfactory system. The Journal
of comparative neurology, 503(1), pp. 1-34.
Johnson, B. A., Woo, C. C., Hingco, E. E., Pham, K. L.
and Leon, M., 1999. Multidimensional chemotopic
responses to n-aliphatic acid odorants in the rat
olfactory bulb. The Journal of comparative neurology,
409(4), pp. 529-548.
Leon, M. and Johnson, B. A., 2003. Olfactory coding in
the mammalian olfactory bulb. Brain research.Brain
research reviews, 42(1), pp. 23-32.
Ma, L., Qiu, Q., Gradwohl, S., Scott, A., Yu, E. Q.,
Alexander, R., Wiegraebe, W. and Yu, C. R., 2012.
Distributed representation of chemical features and
tunotopic organization of glomeruli in the mouse
olfactory bulb. Proceedings of the National Academy
of Sciences of the United States of America, 109(14),
pp. 5481-5486.
Malnic, B., Hirono, J., Sato, T. and Buck, L.B., 1999.
Combinatorial receptor codes for odors. Cell, 96(5),
pp. 713-723.
Meister, M. and Bonhoeffer, T., 2001. Tuning and
topography in an odor map on the rat olfactory bulb.
The Journal of neuroscience: the official journal of the
Society for Neuroscience, 21(4), pp. 1351-1360.
Mori, K., Takahashi, Y. K., Igarashi, K. M. and
Yamaguchi, M., 2006. Maps of odorant molecular
features in the Mammalian olfactory bulb.
Physiological Reviews, 86(2), pp. 409-433.
Pollard, K. S., Dudoit, S. and Van Der Laan, M. J., 2005.
Multiple Testing Procedures: the multtest Package and
Applications to Genomics. In: V. Carey, W. Huber, R.
Irizarry and S. Dudoit Spinger., eds, Bioinformatics
and Computational Biology Solutions Using R and
Bioconductor. Gentleman.
Smit, S., Van Breemen, M. J., Hoefsloot, H. C., Smilde,
A. K., Aerts, J. M. and De Koster, C. G., 2007.
Assessing the statistical validity of proteomics based
biomarkers. Analytica Chimica Acta, 592(2), pp. 210-
217.
Soucy, E. R., Albeanu, D. F., Fantana, A. L., Murthy, V.
N. and Meister, M., 2009. Precision and diversity in an
odor map on the olfactory bulb. Nature neuroscience,
12(2), pp. 210-220.
Takahashi, Y. K., Kurosaki, M., Hirono, S. and Mori, K.,
2004. Topographic representation of odorant
molecular features in the rat olfactory bulb. Journal of
neurophysiology, 92(4), pp. 2413-2427.
Yekutieli, D. and Benjamini, Y., 1999. Resampling-based
false discovery rate controlling multiple test
procedures for correlated test statistics. Journal of
Statistical Planning and Inference, 82(1–2), pp. 171-
196.
IdentificationofMolecularPropertiesCodingAreasinRat'sOlfactoryBulbbyRankProducts
387
