
Does Low B-value can Handle Q-ball and DTI Reconstructions?
Diffusion MRI Experiment of Ex-vivo Pigs Spinal Cord Phantom
Aleksandra Klimas
2
, Kamil Gorczewski
1
, Przemysław Pencak
3
, Zofia Drzazga
2
and Uwe Klose
1
1
Section for Experimental Methods for MR in the CNS, University of Tuebingen, Germany
2
Department of Medical Physics, University of Silesia, Katowice, Poland,
3
Radiology Department, Mielecki University Hospital of Silesian Medical University, Katowice, Poland
Keywords: Q-ball Reconstruction, Diffusion Tensor Imaging, Diffusion Phantom, Fibre Crossing.
Abstract The direction of axons in white matter can be estimated using a deterministic fibre tracking algorithms and
diffusion weighted imaging. The aim of this work was to evaluate the data, obtained from pig spines
phantom measurements with relatively low b-value, using two types of reconstructions: diffusion tensor
imaging (DTI) and q-ball approach. Pigs spines submerged in agar gel were used to prepare a phantom with
two crossing populations of fibres. The phantoms were measured in 3T MR scanned for b-value of 1000 and
2000 s/mm
2
for q-ball and 200-2000s/mm
2
for DTI reconstruction. Analysis of crossing and single fibre
population regions in the scanners showed that the median dispersions from the reference directions in case
of single fibre population were c.a. 4° and for crossing area c.a. 12° and 6.5° for b-value of 1000 s/mm
2
and
2000 s/mm
2
respectively. The q-ball approach was able to resolve crossing problem for both low b-values. It
was shown here that coherent results can be achieved even with lower b-values than proposed by the theory.
1 INTRODUCTION
The clinical applications of MR diffusion
measurement were suggested in 90s by LeBihan and
Basser when the development of echo planar
imaging (EPI) technique made MR imaging faster.
The diffusion measurement relays on MR signal
attenuation from water molecules. Those molecules
can move inside and in-between axons in the
presence of field gradient. The change in the spin
position results in phase shift in precession and
a signal loss. The obstacles, like cell membranes,
keep the phases coherent. The attenuation level is
proportional to the free path that molecules can
travel so the signal is attenuated along axons. The
anisotropic diffusion behaviour can be coupled to
the orientation of fibers what gives the possibility to
brain connectivity.
One can choose how strong images depend on
the diffusion using the diffusion-sensitizing factor,
called b-value, which can be calculated as follows:
b = (γδG)
2
(Δ-
δ
/
3
) [s/mm
2
]
where: γ - gyromagnetic coefficient, δ - duration of
diffusion gradients, G - gradient strength, Δ - time
from the beginning of the first gradient to the
beginning of the second one.
There are several ways to evaluate the main
direction of diffusion from measured data. The most
common is diffusion tensor imaging (DTI) described
in details by Bammer (2003) and Jones in (2004),
which requires at least 7 measurements with gradient
applied in different directions. A diffusion tensor is
fitted to data to obtain only one direction of
diffusion. The degree of diffusion anisotropy,
enabling biological information about the integrity
and orientation of white matter tracts in the brain can
be determined by fractional anisotropy (FA) which
is independent of the orientation of the diffusion in
the voxel (FA = 0 – isotropic diffusion, FA = 1 –
infinite anisotropy). Some regions of brain white
matter such as the corpus callosum and the splenium
show very high FA (c.a. 0.8) while others have
considerably lower FA (Jellison et al. 2004);
(Masutani et al. 2003.). If the direction of diffusion
is known in each point of the brain it is possible to
follow those directions in order to reconstruct
pathway of connection. DTI provides just an
approximation of direction of diffusion, since the
real diffusion is more complex. The idea of using
excised animal nerve tissue to MR diffusion
measurements has already been introduced in
literature, in example by Madi et al. (2005).for the
401
Klimas A., Gorczewski K., Pencak P., Drzazga Z. and Klose U..
Does Low B-value can Handle Q-ball and DTI Reconstructions? - Diffusion MRI Experiment of Ex-vivo Pigs Spinal Cord Phantom.
DOI: 10.5220/0004329304010406
In Proceedings of the International Conference on Bio-inspired Systems and Signal Processing (BIOSIGNALS-2013), pages 401-406
ISBN: 978-989-8565-36-5
Copyright
c
2013 SCITEPRESS (Science and Technology Publications, Lda.)

testing of diffusion sequences, to develop new fibre
tracking algorithms proposed by Campbell et al. in
2005, for the validation of diffusion models such as
the composite hindered and restricted model of
diffusion (CHARMED) described in details in 2004
by Y. Assaf et al. Another application of mentioned
nerve tissue was the method validation on phantom
showed by M. Perrin et al. in 2005, spherical
harmonics presented in 2007 by Descoteaux et al.
and tissue classification (Freidlin, et al., 2007).
These different MR diffusion methods were also
successfully applied in neuroimaging applications
and described by P. C. Sundgren et al. (2004).
However, some parts of the brain remained
untraceable. Disagreement between complex
diffusion situation and rather simple approximation
by one direction of diffusion leads to errors in
tracking.
Recently introduced methods of diffusion
measurements with high-angular-resolution
diffusion imaging (HARDI) allow to retrieve more
complex shape of diffusion than in case of DTI
showing more than one direction of diffusion. A
couple of reconstruction algorithms were proposed.
The first one was the q-ball evaluation by D. Tuch,
2004. Afterwards, other techniques were shown, like
a diffusion orientation transform (DOT) shown in
2006 by Ozarslan, et al., a spherical deconvolution
(Tournier et al. 2004) or PAS-MRI presented by
Parker and Alexander in 2005. In its original
proposed form, the q-ball methodology requires high
diffusion weighting (b-values > 3000 s/mm
2
) in
respect to those used in DTI. The spherical
deconvolution technique depends on the used b-
value (Tuch, 2004). For low b-values the angular
dependency of the signal (from layer which contains
both fibre directions) is relatively small and the
reconstruction of the fibre orientation distribution
function (ODF) is very sensitive to noise. When
using high b-values, the angular dependency is
better defined, but the noise is too big and it begins
to dominate. It was suggested that optimal value is
between 3000 and 4000 s/mm
2
because the strong
angular dependence is necessary to resolve the fibre
orientations without attenuating the signal down to
the noise level. However, the use of high b-value
causes the decrease of SNR. Therefore to obtain a
good quality images one has to increase averaging.
Diffusion tensor imaging calculations and q-ball
method require a quality control of the reconstructed
directions, but it is very difficult to produce an
artificial phantom, that could simulate anisotropy
levels found in a human brain. In case of q-ball
methods it is even more difficult because the
phantom should not only have high anisotropic
properties but also would simulate areas of crossing
fibre bundles. We examined the possibilities to
design a phantom using ex-vivo spinal cord from
slaughtered pigs.
The motivation for this work was the validation
of q-ball and diffusion tensor imaging reconstruction
accuracy of direction extraction using chosen
acquisition parameters. The aim was also to show
the comparison of both techniques presenting their
possibilities and limitations.
2 METHODS
2.1 Phantom Construction
Fresh samples of spinal cord from pigs were
obtained from the local slaughterhouse. The
phantom productions were performed within 6 hours
post mortem.
The pig spinal cords of 12 mm in diameter were
fixed in 2% agar-agar solution in a rectangular
container (suitable to insert into the head-coil of the
MR scanner) in order to create a cross. The crossing
spines were put in two layers – one above the other.
Only one spine went through the crossing area on
each layer, spines in second direction were just
approaching crossing region (which were cut in a
half) what is presented in detail in Figure 1.
Several phantoms were performed, in example
by A. Klimas et al. in 2008, with fibers crossing at
different angles but phantoms with 90° crossing
seem to be the best for studies due to minimization
of the influence of interaction between sampling
angle density and the fibres crossing angle (the 90°
can fulfill the Nyquist condition). The representative
model analyzed in this work showed the deviation
about 5,5° in Z and about 3,5° in X direction of the
MR system (see Figure 1).
2.2 Data Acquisition
The prepared phantom was inserted into head-coil of
3T MR system (Trio–Siemens, Erlangen, Germany).
Diffusion data were obtained in 252 directions,
equally distributed over the sphere. Gradient
directions were obtained by tessellation of an
icosahedron. A double refocusing spin echo MR
sequence was used as it was proposed in 2003 by
Reese, T. G et al. One unweighted image and 252
diffusion weighted images were acquired with
following parameters: TE=126ms, TR=2000ms, b-
values: 1000 and 2000 s/mm
2
.
BIOSIGNALS2013-InternationalConferenceonBio-inspiredSystemsandSignalProcessing
402
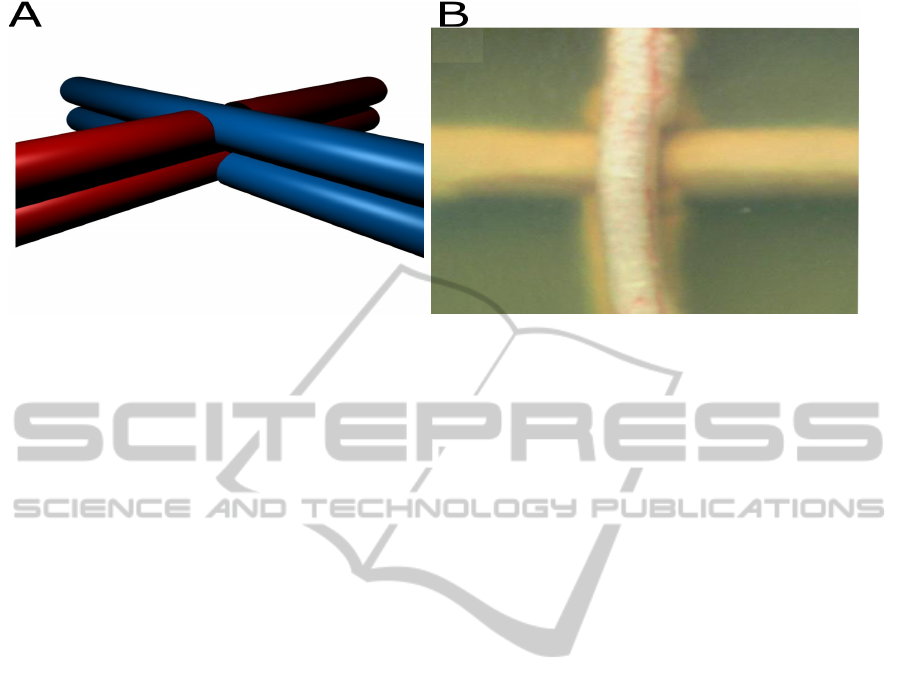
Figure 1: Pigs spinal 90 crossing phantom. This way of construction was minimizing the partial volume effects and it was
assuring no fibres had to be bent during preparation. A) model of construction, B) photo of pigs spines submerged in agar
gel used in measurement.
Field of view (FoV) was 256mm with pixel size of
2mm. The slice thickness was set to 10mm in order
to cover fibres from both layers of phantom.
The diffusion measurement returns an average
signal over the full volume of the voxel. Phase-read
plane was aligned to XZ plane of the MR system.
Eight averages were taken for each image, resulting
in total acquisition time of c.a. 70min.
DTI data acquisition was made at wide range of
parameters: b-value 200–2000 s/mm
2
, TE 70–
110ms, TR 1300–1600ms. The orientation of
acquired slices was parallel to the direction of the
spinal cords. A high in-plane resolution of 2x2mm
was used, while a large slice thickness of 10mm was
chosen to obtain signals from both layers in the
crossing area. Twelve gradient directions were
derived from the vertices of an icosahedron as it was
shown in 2003 by T. G Reese et al.
2.3 Direction Estimation in Linear and
Crossing Region
Data were analyzed with MATLAB software
(MathWorks, MA, USA). The q-ball reconstruction
algorithm was implemented basing on the work
shown by Tuch (2004) with smoothing kernel
σ = 0.009 rad (0.5°). More details about used
algorithm and the smoothing kernel can be found in
the PhD thesis presented in 2010 by Gorczewski.
The directions of diffusion were obtained from
the orientation distribution function (ODF). The
maxima in ODF shapes were extracted using
following algorithm: starting from a random seed
point, it was advancing towards the direction of the
maximal gradient of ODF function. The procedure
was repeated for a hundred times starting from a
different seed point each time. In this way, the
algorithm was independent of starting point position.
The resulting directions were grouped into distinct
directions of diffusion present in the ODF shape.
Each maximum was treated as direction of diffusion.
The principal diffusion direction in q-ball shape was
the direction of the maximum with the highest value
of orientation distribution function.
The phantoms crossing area was in XZ plane.
The directions of diffusion were divided into two
groups: voxels with single fibre population pointing
X direction (group A) and voxels with single fibre
population pointing Z direction (group B).
An average direction from all voxels was
calculated in both groups. Dispersion of the
diffusion directions was estimated by a median
value.
The average directions of diffusion found in the
arms of the cross served as references in analysis of
reconstruction stability. The angles between
reference direction and directions of diffusion found
in each voxel belonging to the crossing area were
calculated. To estimate the angle dispersion in a
given diffusion direction a median from all angles
was calculated. The standard deviation cannot be
used since the distribution of angles is not a
Gaussian one. A median angle draws a cone
containing half of the reconstructed diffusion
directions. In this article, it is referred to as
dispersion cone angle (DCA). The more stable
direction, the narrower the cone is. Averaged
directions of diffusion were calculated in each group
and those directions were used to estimate the
dispersion. The results from the arms (single fibre
population) were compared with the corresponding
diffusion directions found in the crossing area (two
DoesLowB-valuecanHandleQ-ballandDTIReconstructions?-DiffusionMRIExperimentofEx-vivoPigsSpinalCord
Phantom
403
fibre populations).
3 RESULTS
3.1 Visualization of Diffusion in DTI
and Q-Ball
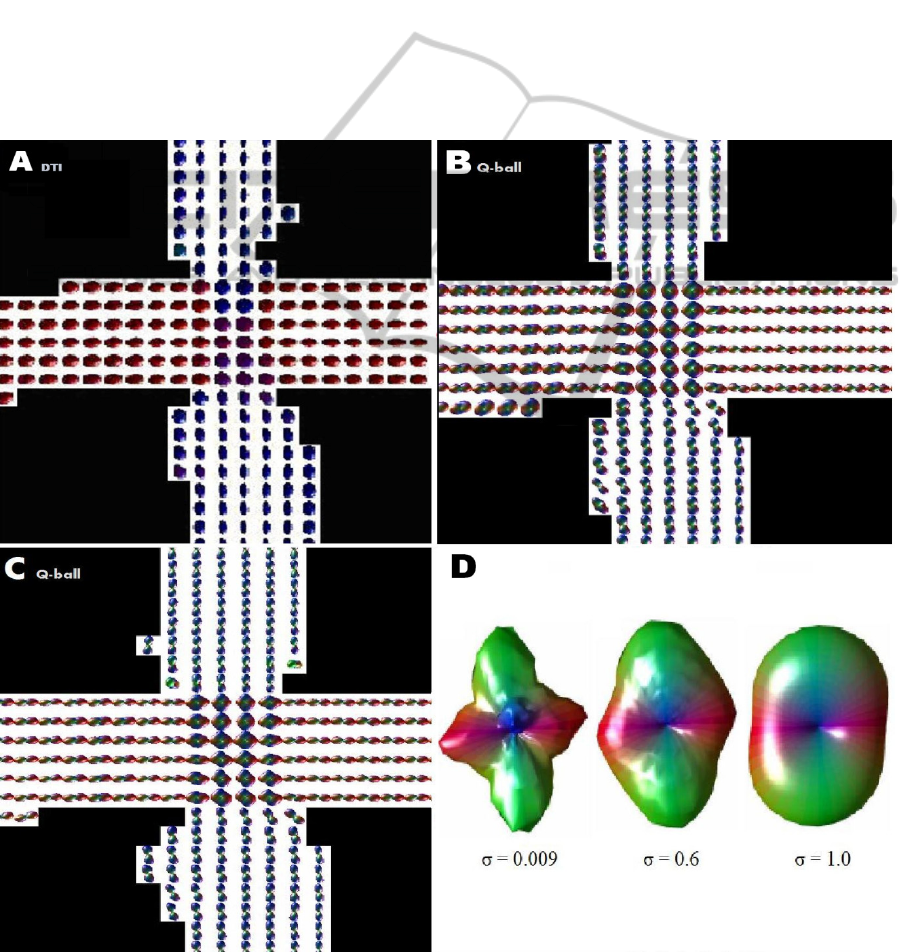
Q-ball reconstruction was able to identify regions of
higher anisotropy properly. Figure 2B and C shows
the q-ball reconstruction of the selected areas of
interest. Both low b-values visually reveal the
directional structure of the phantom. The ODF in
arms of the phantom have a peanut-shape which
represents the single fibre population as assumed.
However the directions of diffusion in each arm are
parallel.
Diffusion tensor imaging measurements reveal
high FA index of 0.7 in arm-regions proving validity
of constructed spine phantom for a clinical scanner.
DTI shapes within the voxel presented in Figure 2A
confirm that the detected orientations are coherent
with the underlying fibre directions.
3.2 Estimation of Diffusion Direction in
Single Fibre Population and
Crossing Area
A comparison between Figure 2A, B, and C
demonstrates how both methods deal with the
Figure 2: Visualization of phantom obtained by A) DTI with b-value of 800s/mm
2
, B) Q-ball shapes obtained with b-value
of 1000 s/mm
2
, C) Q-ball shapes obtained with b-value of 2000 s/mm
2
. D) Examples of reconstructed ODFs as a function
of smoothing kernels σ (2009 Gorczewski et al., modified).
BIOSIGNALS2013-InternationalConferenceonBio-inspiredSystemsandSignalProcessing
404

multiple fibre populations. One can see that the main
direction of diffusion in arms in DTI reconstruction
can be clearly visible unlike in the crossing area
where obtained diffusion tensors have a plate-shape.
Q-ball technique gives better results in the crossing
area because the first diffusion direction is separated
from the second one.
In the q-ball approach the analysis of the
directions acquired with b-value 1000 s/mm
2
in arm-
regions shows that the median is equal to 4.0° for X
(group A) and 4.4° for Z direction (group B). In case
of b-value 2000 s/mm
2
both medians are equal to
3.8°. Stability of diffusion direction estimation for
double fibre population resulted in a DCA of 12.7°
in X, 10.8° in Z for 1000 s/mm
2
and 6.6° in X, 5.5°
in Z direction for 2000 s/mm
2
.
The influence of the reconstruction stability was
examined by calculating DCA in the crossing area
against the smoothing kernel σ from reconstruction
algorithm like in the work of D. Tuch, 2004. The
example of the blurring influence is shown in Figure
2D. Two initially distinct directions of diffusion in
q-ball shape disappear when the σ is increased. As
we can observe, the two directions are replaced by
one, averaged diffusion direction. Reasonably low
smoothing kernels should be used to maintain good
directional data quality.
4 DISCUSSION
Fibre tracking becomes an effective tool in clinical
practice as well as in research combined with
functional imaging. Recent development of methods
for multiple diffusion direction extraction prepares
even better data for connectivity exploration. New
methods of water molecules diffusion measurement
with HARDI methods provide more detailed
information about the structure of the white matter.
The tensor model for single fibre populations works
very well. The error estimation and its propagation
in relation to acquisition factors such as sampling
directions, b-value or SNR was shown earlier in
2004 by Jones D.K. The tensor approach was
successfully used in clinical routine (the sequence
duration was acceptable) but it cannot fulfill all of
the assumptions of the theoretical model. In case of
multiple fibre population the tensor model shows a
decrease of FA and two eigenvalues of similar
amplitude manifesting in a plate-shape of diffusion
tensors. In this way only a plane of crossing was
determined, but it was impossible to retrieve
information about the directions of the crossing
fibres. In our study the diffusion directions provided
by tensor model were successfully applied in single
fibre population unlike to in crossing area. The q-
ball algorithm has an assumption about high b-value,
which cannot be fulfilled in clinical due to the long
measurement time - a clinical routine always have to
consider a trade between quality of measurement
and time. The building time of the b-value is
dependent on the integral over the gradients
amplitudes. Using short gradient time implies TE
shorting, so stronger signal is acquired and less
averages is needed.
It was shown here, that even not being strict with
the assumptions of the q-ball measurement theory
gives coherent results. When acquiring patients, it is
important to reduce time of acquisition as much as it
is reasonably possible.
Moreover it should be noted that the decrease of
b-value, which has a major impact on the acquisition
time, still provides data that can be used to resolve
fibre crossing problem.
Another possibility to shorten the time of the
measurements is the reduction of diffusion direction
number. According to the Nyquist condition
sampling frequency should be at least 2n+1, where n
is the highest expected frequency in data.
Decreasing the angular resolution double the
minimal angle that can be distinguished. It is better
to speed up acquisition by other means, than by
losing the angular resolution. That is the reason why
the reduction of the diffusion directions is unwanted.
However, recently the Nyquist theorem has been
improved as was shown in 2011 by McEwen and
Wiaux an successfully applied in the same year by
A. Daducci et al.
Half of the diffusion directions felt into 5 degree
wide cone for a single fibre bundle case. The fibre
crossing area was successfully resolved. Two pairs
of maxima were present in all voxels.
This work deals with the reconstruction of data
from phantom measurements whereas a comparison
between diffusion tensor imaging and q-ball results
obtained from in-vivo measurements can be found in
the work shown by Gorczewski et al. in 2009.
5 CONCLUSIONS
To conclude, we show that even if the condition of
high b-value is not met q-ball reconstruction can
successfully retrieve proper directions of diffusion in
single as well as in multi fibre population cases. The
stability of this evaluation is still in ranges of
degrees. The data measured in lower b-values ranges
can be properly processed by fibre tracking
DoesLowB-valuecanHandleQ-ballandDTIReconstructions?-DiffusionMRIExperimentofEx-vivoPigsSpinalCord
Phantom
405

algorithms.
REFERENCES
Le Bihan D., Turner R., Douek P., Patronas N. (1992).
Diffusion MR imaging: clinical applications.
American Journal of Roentgenology,159(3), 591-599.
Basser P. J., Mattiello J., LeBihan D. (1994). Estimation
of the effective self-diffusion tensor from the NMR
spin echo. Journal of Magnetic Resonance - Series B,
103(3), 247-254.
Bammer R. (2003). Basic principles of diffusion-weighted
imaging. European Journal of Radiology, 45(3), 169-
184.
Jones D.K. (2004). The Effect of Gradient Sampling
Schemes on Measures Derived From Diffusion Tensor
MRI: A Monte Carlo Study. Magnetic Resonance in
Medicine. 51(4), 807-815.
Jellison B. J., Field A. S., Medow J., Lazar M., M. Shariar
Salamat and Alexander A. L. (2004). Diffusion Tensor
Imaging of Cerebral White Matter: A Pictorial Review
of Physics, Fiber Tract Anatomy, and Tumor Imaging
Patterns. American Journal of Neuroradiology. 25,
356–369.
Masutani Y., Aoki S., Abe O., Hayashi N., Otomo K.
(2003). MR diffusion tensor imaging: recent advance
and new techniques for diffusion tensor visualization.
European Journal of Radiology, 46, 53-/66.
Madi, S., Hasan, K. M., Narayana, P. A. (2005). Diffusion
tensor imaging of in vivo and excised rat spinal cord at
7 T with an icosahedral encoding scheme. Magnetic
Resonance in Medicine, 53, 118-125.
Campbell, J. S., Siddiqi, K., Rymar, V. (2005). Flow-
based fiber tracking with diffusion tensor and q-ball
data: validation and comparison to principal diffusion
direction techniques. Neuroimage; 27(4) 725-736.
Assaf, Y., Freidlin, R. Z., Rohde, G. K., Basser, P. J.
(2004). New Modeling and Experimental Framework
to Characterize Hindered and Restricted Water
Diffusion in Brain White Matter. Magnetic Resonance
in Medicine, 52, 965–978.
Perrin, M., Poupon, C., Rieul, B., Leroux, P. (2005).
Validation of q-ball imaging with a diffusion fibre-
crossing phantom on a clinical scanner. Philosophical
Transactions of the Royal Society B: Biological
Sciences, 360, 881-891.
Descoteaux, M., Angelino, E., Fitzgibbons, S., Deriche, R.
(2007). Regularized, Fast, and Robust Analytical Q-
Ball Imaging. Magnetic Resonance in Medicine, 58,
497–510.
Freidlin, R. Z., Ozarslan, E., Komlosh, M. E., Chang, L.
(2007). Parsimonious Model Selection for DTI Tissue
Segmentation and Classification: Study on Simulated
and Experimental Data. IEEE Transactions on
Medical Imaging,26(11), 1576-1584.
Sundgren, P. C., Dong, Q., Gómez-Hassan, D., Mukherji
(2004). Diffusion tensor imaging of the brain: review
of clinical applications. Neuroradiology,
46, 339-350.
Tuch D. S. (2004). Q-ball imaging. Magnetic Resonance
in Medicine, 52( 6), 1358-1372.
Ozarslan, E., Shepherd, T. M., Vemuri, B. C., Blackband,
S. J. (2006). Resolution of complex tissue
microarchitecture using the diffusion orientation
transform (DOT). Neuroimage, 31(3), 1086-1103.
Tournier, J. D., Calamante, F., Gadian, D. G., Connelly,
A. (2004). Direct estimation of the fiber orientation
density function from diffusion-weighted MRI data
using spherical deconvolution. Neuroimage, 23( 3),
1176-1185.
Parker, G. J., Alexander, D. C. (2005). Probabilistic
anatomical connectivity derived from the microscopic
persistent angular structure of cerebral tissue.
Philosophical Transactions of the Royal Society B:
Biological Sciences, 360, 893-902.
Klimas, A., Gorczewski, K., Klose, U., Drzazga, Z.
(2008). Preparation and validation of an easy-to-make
organic DTI phantom. 41st Polish Seminar on Nuclear
Magnetic Resonance and Its Applications.
Reese, T. G., Heid, O., Weisskoff, R. M., Wedeen, V. J.
(2003). Reduction of eddy-current-induced distortion
in diffusion MRI using a twice-refocused spin echo.
Magnetic Resonance in Medicine, 49(1), 177-182.
Gorczewski K. (2010). Multi-directional diffusion
weighted imaging: Implementation, verification and
clinical application, PhD thesis.
McEwen J. D., Wiaux Y. (2011). A novel sampling
theorem on the sphere. IEEE Transactions on Signal
Processing, 59, 5876–5887.
Daducci A., McEwen J., Van De Ville D., Thiran J. P.,
Wiaux Y. (2011). Harmonic analysis of spherical
sampling in diffusion MRI. Proceedings of the
International Society for Magnetic Resonance in
Medicine, 3929.
Gorczewski, K., Mang, S, Klose, U. (2009).
Reproducibility and consistency of evaluation
techniques for HARDI data. Magnetic Resonance
Materials in Physics Biology and Medicine, 22(1), 63-
70.
BIOSIGNALS2013-InternationalConferenceonBio-inspiredSystemsandSignalProcessing
406
