
Prototype and Graphical Interface for Selective Exhaled Air
Acquisition
Fábio Dias
1
, José Alves
1
, Fábio Januário
2,3
, José Luís Ferreira
1,3
and Valentina Vassilenko
1,3
1
Centre of Physics and Technological Research (CeFITec), Faculty of Sciences and Technology, NOVA University of
Lisbon, Campus FCT UNL, 2829-516 Caparica, Portugal
2
Electrical Engineering Department, Faculty of Sciences and Technology, NOVA University of Lisbon, Campus FCT UNL,
2829-516 Caparica, Portugal
3
NMT, S.A, Edifício Madan Parque, Rua dos Inventores, 2825-182 Caparica, Portugal
Keywords: Exhaled Air, Selective Air Acquisition, Capnography, Ion Mobility Spectrometry.
Abstract: The recent advances in technology and detection methods, as well as its economic viability have pointed the
analysis of exhaled breath as a promising tool for medical diagnosis or therapy monitoring. Since the
concentration of the most Volatile Organic Compounds (VOCs) present in the exhaled breath is very low
(ppb
v
– ppt
v
range) it is important to have a selective sampling system for alveolar air. In this work we
present the design and instrumentation of a prototype that allows real time monitoring of the breathing cycle
and automatically decide the correct moment for acquisition and channel the acquired sample to the Ion
Mobility Spectrometer with Multi-Capillary Column pre-separation (MCC-IMS). The prototype is
composed by a flow meter, signal packaging circuits and a flow commuting circuit (three-way valve). Two
graphical interfaces were also developed to help controlling the whole process of acquisition making it easy,
quick and reliable.
1 INTRODUCTION
Nowadays the development of a fast, effective, non-
invasive, low-cost and painless diagnosis method is
under special interest of medical and scientific
community (Mashir and Dweik, 2009). From this
point of view breath analysis is extremely attractive,
sometimes even appointed as an alternative method
of biochemical blood analysis (Baumbach, 2009).
It is well known in the medical community that
the Volatile Organic Compounds (VOCs) present in
the exhaled air can provide important information
about the health status (Kim et al., 2012). More than
200 different compounds have been detected in the
exhaled breath and some of them are identified as
biomarkers of common diseases such as diabetes,
liver or kidney failure, pulmonary cancer (Spanel et
al., 1999) or allograft rejection (Miekisch et al.,
2004).
The VOCs present in the exhaled breath are in
very low concentrations, typically from parts-per-
billion (ppb) or microgram/litre (μg/l) to parts-per-
trillion (ppt) or nanogram/litre (ng/l). Thus the
spectrometric methods used for the detection of the
different metabolic processes products must have a
high sensitivity (low ppb range) and provide a direct
analysis in real time or in a few minutes (Baumbach
2006). All these requirements can be realised by Ion
Mobility Spectrometry (IMS). This technique is
based on the drift of ions given their mobility in the
gas phase, at ambient pressure, under the influence
of an electric field (Baumbach, 2006). Compared
with other methods of breath analysis, the IMS
offers a tenfold higher detection rate of VOCs.
By coupling the ion mobility spectrometer with a
multi-capillary column as a pre-separation unit, IMS
offers the advantage of an immediate twofold
separation of VOCs with visualisation in a three-
dimensional chromatogram (Jünger et al., 2010).
From other side, direct breath analysis by
analytical methods implies to use an effective
sample collection system in order to provide the
VOCs of endogenous origin only. These compounds
are present in the alveolar air which is in chemical
equilibrium with the alveolar capillary blood vessels.
Therefore it is necessary to develop selective
acquisition systems that are able to identify and
collect only the alveolar air.
216
Dias F., Alves J., Januário F., Luís Ferreira J. and Vassilenko V..
Prototype and Graphical Interface for Selective Exhaled Air Acquisition.
DOI: 10.5220/0004329402160219
In Proceedings of the International Conference on Biomedical Electronics and Devices (BIODEVICES-2013), pages 216-219
ISBN: 978-989-8565-34-1
Copyright
c
2013 SCITEPRESS (Science and Technology Publications, Lda.)
2 CAPNOGRAPHY
One of the most used techniques to do that selection
is capnography. This technique provides information
about the CO
2
levels, pulmonary perfusion,
ventilation and respiratory patterns.
Capnography consists in the graphic display of
the instantaneous concentration of CO
2
in function
of Time or in function of Volume during a breathing
cycle.
The time capnogram is the most used and can be
divided into two segments, inspiration (Phase 0) and
expiration (comprises Phases I, II and III) (Bhavani-
Shankar et al., 1995).
There are different terminologies to designate the
different phases of a capnogram and we decided to
adopt the one suggested by Bhavani-Shankar,
Kumar, Moseley and Ahyee-Hallsworth (1995).
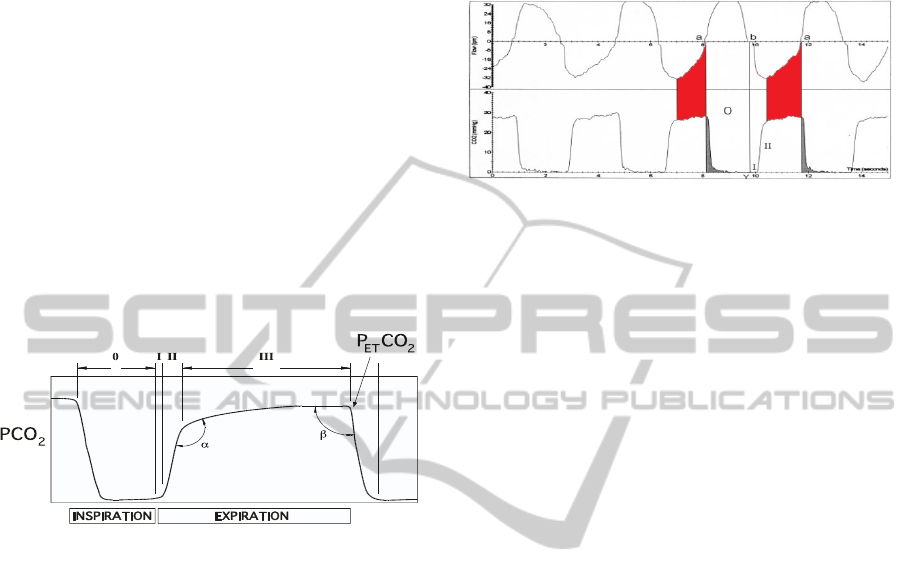
Figure 1: Phases of a time capnogram.
During the first portion of expiration (Phase I)
the PCO
2
is zero. This phase corresponds to the
anatomic dead space and the equipment dead space.
As expiration continues, a sigmoid curve
corresponding to the abrupt rise on CO
2
concentration appears, (Phase II) at this stage there’s
already a mix of alveolar air and dead space air.
In the last segment of the expiration we find a
plateau in the PCO
2
(Phase III) which represents the
alveolar region, this is the portion of the exhaled
breath we are looking to acquire as it’s entirely
composed of alveolar air.
3 FLOWMETRY AND
REFERENCE RESPIRATORY
RHYTHMS
Fluxogram is the graphical monitoring of respiratory
air variation with time. A time capnogram
overlapped with a fluxogram (Bhavani-Shankar and
Philip, 2000) can provide a clear identification for
the area of end-tidal breath (see figure 2). By this
only a flow meter can be used for selective
assessment to the last segment of the expiration
which represents the alveolar region with high CO
2
concentration.
Figure 2: Comparison between respiratory flow rate and
time capnogram. (Adapted from Bhavani-Shankar and
Philip, 2000).
As a first step it was necessary to create
reference rhythms which the user shall follow during
the flow measurements. Taking into consideration a
probability to need use our breath acquisition system
in different situations, we choose to use three kinds
of rhythms: Slow, Normal and Fast.
For each of these reference rhythms were
determined the average frequency and the mean time
for each breathing cycle. Mean values were
calculated from the statistical analysis of
measurements of respiratory flow of healthy persons
of both gender, male and female. Each volunteer
have performed the test for approximately 60
seconds at three different paces. The respiratory
flow was monitored by SS11LA flow transducer
connected to the MP35 acquisition unit from Biopac
Systems, INC. The BSL PRO 3.7 graphical software
was used for further calculations of the average
values for each breathing cycle and determination
the reference value for the phase of inspiration and
expiration.
The reference values for the breathing cycle
were established as follows: for the normal rhythm
the total cycle´s time is 3,66 seconds, where 1,63
seconds are for inspiration; the slow rhythm has 7,01
seconds cycle, from which 3,25 seconds are for
inspiration; finally the fast rhythm takes 2,23
seconds to fulfill a cycle, being 1,22 seconds of the
inspiratory phase.
4 PROTOTYPE FOR SELECTIVE
SAMPLING OF ALVEOLAR
AIR
The prototype for selective acquisition of exhaled
PrototypeandGraphicalInterfaceforSelectiveExhaledAirAcquisition
217
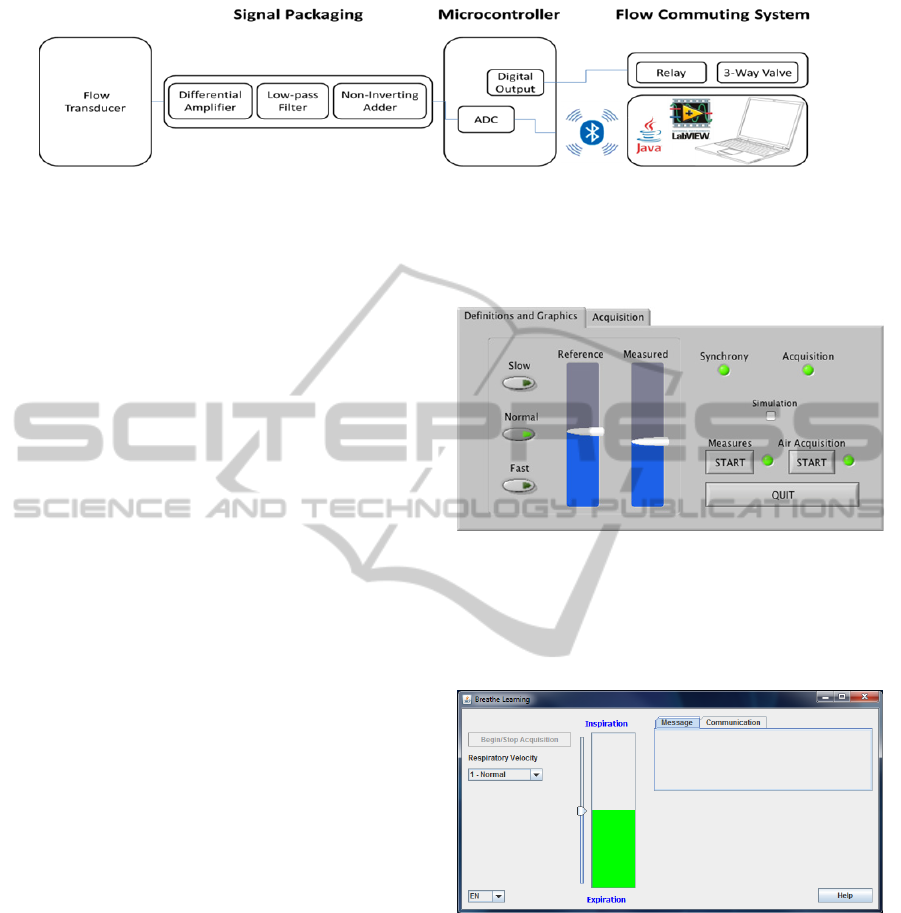
Figure 3: Block diagram from the prototype for exhaled air acquisition.
breath was developed in two different cells,
hardware and software.
The hardware is responsible for the data
acquisition, analog to digital conversion and data
transmission to the computer, a flow commuting
system was also developed (see figure 3).
The software is a graphical interface that helps
the user pace his breathing cycle and by using some
algorithms identifies and triggers the correct sample
to be acquired.
4.1 Selective Acquisition System
The developed physical part of the prototype is
divided in four blocks: (1) SS11LA flow transducer;
(2) the signal packaging circuit; (3) acquisition and
communication circuit; (4) flow commuting circuit.
The user breathes through the flow transducer
which has a differential output proportional to the
measured flow.
The signal packaging circuit is divided in three
parts, a differential amplifier which detects the
differential output, single waves it and gives it a
4000 gain, one low-pass filter which cuts the
existing noise and a non-inverting adder that places
the whole signal in the digital window of the
microcontroller.
The acquisition and communication circuit uses a
microcontroller that through its AD converter
digitalizes the electrical signal from the packaging
circuit and sends this data to a computer with the
help of a Wireless Bluetooth module.
The flow commuting circuit is composed of a
relay, a three-way valve and a coupling circuit
connecting it to the microcontroller.
4.2 Graphical Interfaces
We have developed two graphical interfaces, one in
LabVIEW
®
and the other in Java™, both with the
ability to instruct the user to follow a desired
breathing rhythm.
The LabVIEW
®
graphical interface (see figure 4)
was developed to determine if this way of collecting
exhaled air samples was valid and accurate. This aim
was confirmed in interaction with the selective
acquisition system.
Figure 4: LabVIEW
®
graphical interface.
Therefore, we developed another user interface
using Java™ (see figure 5) aiming to do the same
process, but using a programming language that did
not need purchase of commercial software.
Figure 5: Java™ graphical interface.
In both interfaces, the user is asked to breathe
according a slide representation of a previously
chosen reference signal (breathing rhythm).
In a first step, the developed algorithm checks if
the signals are synchronous at least for the three
complete respiratory cycles. When this condition is
reached the initial and final instant of the alveolar
region of the breathing cycle are identified. At this
time a command is sent to the microcontroller,
which in turn operates the relay valve, allowing the
valve to remain open only between these instants.
This process ensures that only alveolar air is
BIODEVICES2013-InternationalConferenceonBiomedicalElectronicsandDevices
218

sampled into the system for its further analysis by
Ion Mobility Spectrometry or some other suitable
analytical technique.
5 CONCLUSIONS
The proposed method for monitoring and selective
sampling of exhaled air through the respiratory flow
represents a reliable alternative method to the
capnography.
The developed prototype is cheaper than any fast
capnograph and it can be used for a long period of
time. It can also be easily assembled to the MCC
IMS apparatus for further sensitive analysis of the
VOCs from alveolar air.
The successfully developed graphical interfaces
make a process of breath samples collection more
user friendly for the operator, as well as for the
patients.
However some parts of the implemented
algorithm have to be optimized for better
performance in real healthcare environments.
However some parts of the implemented
algorithm have to be optimized for better
performance, especially for the patients with some
diseases or respiratory problems.
So the future work will concern to the extensive
statistical tests of the developed prototype with large
groups of population, regarding the specificity of its
age and gender. This is important in order to
improve the accuracy of the reference rhythms of
breathing. Within this topic it shall be acquired
respiratory rhythms from children and people with
limited medical conditions, as well as create models
and special menu for this kind of patients.
It can also be added an instructional movie or
help menu to allow to the patient follow the
respiratory reference rhythm in a better way.
ACKNOWLEDGEMENTS
We are grateful to all volunteers that offer their time
to perform the tests for the acquisition of their
respiratory cycles.
REFERENCES
Mashir, A. and Dweik, R. (2009). Exhaled breath analysis:
the new interface between medicine and engineering.
Advanced powder technology: the international
journal of the Society of Powder Technology, NIH
Public Access.
Baumbach, J. (2009). Ion mobility spectrometry coupled
with multi-capillary columns for metabolic profiling
of human breath. In Journal of Breath Research. IOP
Publishing.
Kim, K., Jahan, S., and Kabir, E. (2012). A review of
breath analysis for diagnosis of human health. TrAC
Trends in Analytical Chemistry, Elsevier.
Spanel, P., Davies, S., and Smith, D. (1999).
Quantification of breath isoprene using the selected
ion flow tube mass spectrometric analytical method.
Rapid communications in mass spectrometry, Wiley
Online Library.
Miekisch, W., Schubert, J., Noeldge-Schomburg, G., et al.
(2004). Diagnostic potential of breath analysis–focus
on volatile organic compounds. In Clinica chimica
acta; international journal of clinical chemistry.
Elsevier.
Baumbach, J. (2006). Process analysis using ion mobility
spectrometry. Analytical and bioanalytical chemistry,
Springer.
Jünger, M., Bödeker, B., and Baumbach, J. (2010). Peak
assignment in multi-capillary column–ion mobility
spectrometry using comparative studies with gas
chromatography–mass spectrometry for voc analysis.
Analytical and bioanalytical chemistry, Springer.
Bhavani-Shankar, K., Kumar, A., Moseley, H., and
Ahyee-Hallsworth, R. (1995). Terminology and the
current limitations of time capnography: a brief
review. Journal of Clinical Monitoring and
Computing, Springer.
Bhavani-Shankar, K. and Philip, J. (2000). Defining
segments and phases of a time capnogram. Anesthesia
& Analgesia, IARS.
PrototypeandGraphicalInterfaceforSelectiveExhaledAirAcquisition
219
