
Instrumental Tools for Express Analysis of Lacrimal Fluids
Valentina Vassilenko
1,3
, Mónica Silva
1
, Ricardo Alves
1
and João O’Neill
1,2
1
Centre of Physics and Technological Research (CeFITec), Faculty of Sciences and Technology,
NOVA University of Lisbon, Campus FCT UNL, 2829-516 Caparica, Portugal
2
Faculty of Medical Sciences, NOVA University of Lisbon, Campo dos Mártires da Pátria, 130, 1169-056, Lisboa, Portugal
3
NMT, S.A, Edifício Madan Parque, Rua dos Inventores, 2825-182, Caparica, Portugal
Keywords: Diagnostic, Lacrimal Fluid, Ion Mobility Spectrometry, MCC-IMS, Volatile Organic Compounds, VOCs.
Abstract: Analysis of lacrimal fluid is under attention of scientists and physicians as an open “window” for non-
invasive assessment to relevant information about the health status. In the present work we propose an
innovative method for the analysis of volatile metabolites present in the lacrimal fluid by non-invasive, fast
and inexpensive technique: Ion Mobility Spectrometry coupled to a Multi-Capillary Column (MCC-IMS).
Experimental protocol for lacrimal fluid collection and its further analysis by MCC-IMS was developed. For
the first time this technology was used for the analysis of tears from healthy and diabetic person for a “proof
of concept” purpose. Obtained experimental result showed that proposed method is suitable for the
sensitive in-situ express analysis of Volatile Organic Compounds (VOCs) from lacrimal fluid and have a
promising diagnostic potential.
1 INTRODUCTION
The financial costs related to the diagnostic and
treatment of several diseases such as diabetes,
cancer, pulmonary diseases and others are extremely
important and need to be carefully controlled. Even
the conventional analysis of biological matrices, like
blood and urine, require long time and complex
reagents that increase the cost of this analysis.
Beyond that, the collection of blood samples almost
every is an invasive procedure and need a
specialized medical staff and conditions. Therefore,
nowadays the medical community is interested in
new non-invasive, accurate, time and cost saving
methods of analysis for diagnostic or screening
purpose.
Among the existent biological matrices, the
lacrimal fluid has been shown to have the essential
characteristics to perform the non-invasive analysis.
The tear is an extracellular fluid that covers the
surface epithelial cells and forms the anterior
component of the ocular surface. The lacrimal fluid
lubricates and prevents the dehydration of the eye.
Several compounds are present in this matrix
such as: amino acids, glucose, proteins and
electrolytes (Beuerman and Zhou, 2012). These
matrix elements vary from person to person in the
range of concentrations from parts-per-billion (ppb)
or microgram/litre (μg/l) to parts-per-trillion (ppt) or
nanogram/litre (ng/l) and are related to the health or
metabolic condition of each individual.
Thus the sensitive in-situ express analysis of
Volatile Organic Compounds (VOCs) present in the
matrix of lacrimal fluid is a very interesting issue.
Currently, this analysis is not very common in the
clinical practice. Mainly due to the difficulties on
analysis of analites in such low concentration, lack
of information about the detected metabolites and
due to the inexistence of a uniform method of
analysis.
In the present feasibility study, a lacrimal fluid
from patients with diabetes and from the healthy
persons was analyzed in order to find common
and/or discriminating volatile organic compounds.
The main objective was the characterization of tears
matrix by Ion Mobility Spectrometry, but not the
identification of the analytes and determination of
their concentration. As far as we know these are the
first results of the investigations of lacrimal fluids by
IMS technology.
220
Vassilenko V., Silva M., Alves R. and O’Neill J..
Instrumental Tools for Express Analysis of Lacrimal Fluids.
DOI: 10.5220/0004329602200224
In Proceedings of the International Conference on Biomedical Electronics and Devices (BIODEVICES-2013), pages 220-224
ISBN: 978-989-8565-34-1
Copyright
c
2013 SCITEPRESS (Science and Technology Publications, Lda.)
2 EXPERIMENTAL
2.1 Ion Mobility Spectrometry
Among several techniques that are used for direct
analysis of VOCs, there is one that stands out due to
its high sensitivity, low cost, portability and
simplicity: the ion mobility spectrometry. The ion
mobility spectrometry (IMS) is based on the drift of
ions according to their mobility in the gas phase at
ambient pressure, under the influence of an electric
field (Stach and Baumbach, 2002).
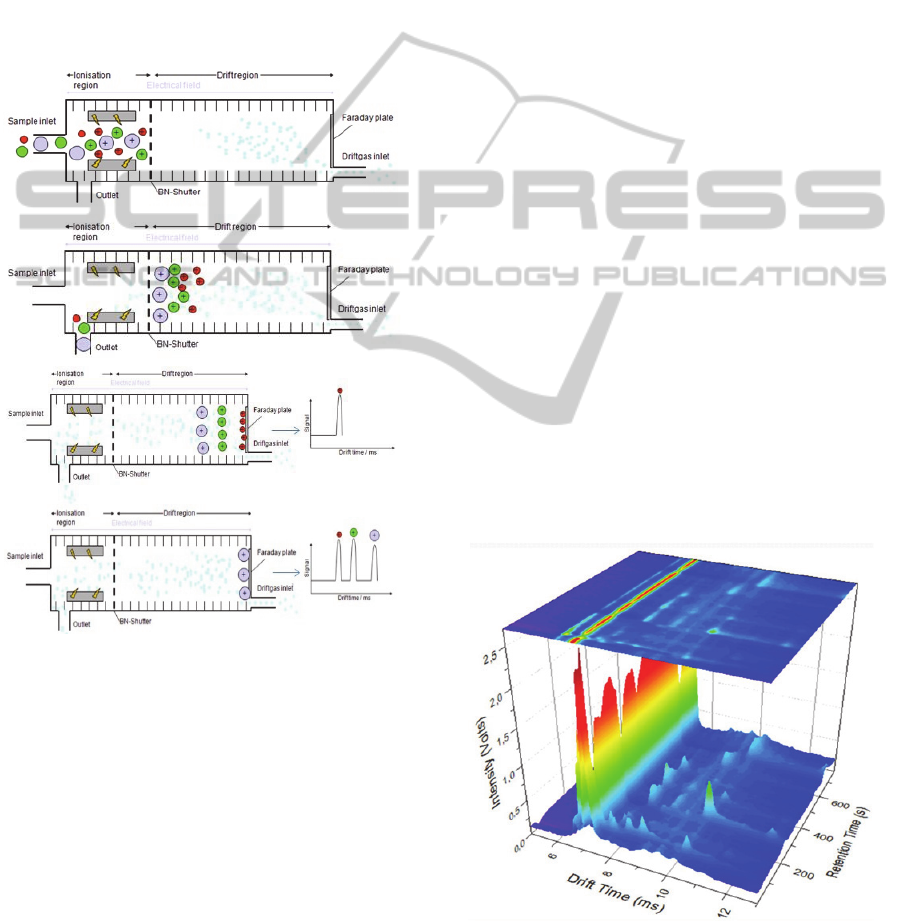
Figure 1: Physical principle of the IMS. The ionized ions
enter the drift region and are separated according to their
mass and structure.
The major component of the IMS is the
spectrometer: a measuring tube that consists of a
reaction chamber (also called ionization chamber),
in which the ions are generated by a β-radiation
source (3H - tritium), and a drift region, at the end of
which a detector is positioned (Fig.1). The reaction
chamber and the drift region are separated by a
shutter grid, called Bradbury-Nielsen grid. This
element is responsible for controlling the passage of
the ion cloud formed in the ionization region.
In the drift region, there’s an external electric
field that is responsible for the movement of the
formed ions in this chamber. Also, a drift gas
(usually nitrogen, but also ambient air can be
utilized) is pumped into the spectrometer from the
detector’s side.
Due to the applied electrical field and the
opposite gas flow, the ions are vulnerable to
collisions with the drift gas molecules and are
separated according to their structure, charge and
mass, reaching the detector (Faraday plate) at
different times. Ideally, all the analyte molecules in
the sample considered for analysis are totally
separated.
The detected ions generate an ion mobility
spectrum, which shows signals registered at different
times (ms) with the corresponding intensities (V).
Those intensities are proportionally related to the
concentration of each compound, meaning that
higher intensities correspond to higher
concentrations.
The combination of IMS with a multi-capillary
column (MCC-IMS) allows a pre-separation of the
sample, through a gas chromatography technique
(Baumbach, 2009). This provides an increasing of
selectivity and the advantage of an immediate
twofold separation of VOCs with visualisation in a
three-dimensional chromatogram, as represented in
the Figure 2.
IMS has a wide range of applications. Initially, it
was used to detect explosives and chemical warfare
agents, but the same principle has been applied for
medical applications, and to give information about
nutrition, oral hygiene and environmental conditions
(Eiceman, 2005).
Figure 2: Typical MCC-IMS chromatogram showing
characteristic signals of biological matrix.
InstrumentalToolsforExpressAnalysisofLacrimalFluids
221
2.2 Other Analysis Techniques
There are other techniques that are also suitable for
the volatile organic compounds analysis, like GC-
MS, SIFT-MS and PTR-MS.
GC-MS (mass spectrometry with gas
chromatography) is a technique that enables the
separation and identification of volatile organic
compounds and some volatile inorganic compounds
of a gas mixture (Dolan, Newman and Stauffer,
2007). This technique needs a long time to perform
the analysis and pre-concentration (Blake, Monks
and Ellis, 2009).
SIFT-MS (mass spectrometry associated with a
selected ion flow tube) is a technique that uses
precursor ions to ionize gases in a gas sample. It is a
technique that cannot be miniaturized and it is less
sensitive than the MCC-IMS (Spanel and Smith,
1996).
PTR-MS (mass spectrometry by proton transfer
reaction) is a technique that enables the
identification of volatile organic compounds mostly
from natural sources. It uses a vacuum system and
for that reason it cannot be miniaturized (Blake et.
al., 2009).
Compared with other methods of VOC analysis,
ion mobility spectrometry (IMS) stands out due to
its high sensitivity, low cost, portability and
simplicity. The fact that is does not require vacuum
or further sample preparation and the analysis is
performed in a few minutes makes this technique
suitable to be used in hospitals and healthcare
centers.
2.3 Materials and Methods
The samples were collected from 9 diabetic patients
and 9 health individuals according to the standard
protocol procedures with sterile tear flow test strips
(by Sno*Strips) based on the technique of the
Schirmer’s Test (Zhou and Beuerman, 2012). In this
test, the sterile strip is placed in the outer lower
eyelid of each eye during 3 minutes. After this time,
the strip is collected and stored into vials which are
closed with screw caps with a silicone septum.
The reason why the strip is placed in a specific
part of the eyelid is related to some facts:
The lacrimal gland which is responsible for the
production of the aqueous layer of the lacrimal fluid
is located at the superior temporal portion of each
eye,
The lacrimal channels are located at the nasal
portion of each eye and communicate with the
lacrimal sac, which could cause a contamination of
the lacrimal sample with nasal compounds.
The cornea is an extremely sensitive eye region
that could be negatively affected by the strip contact.
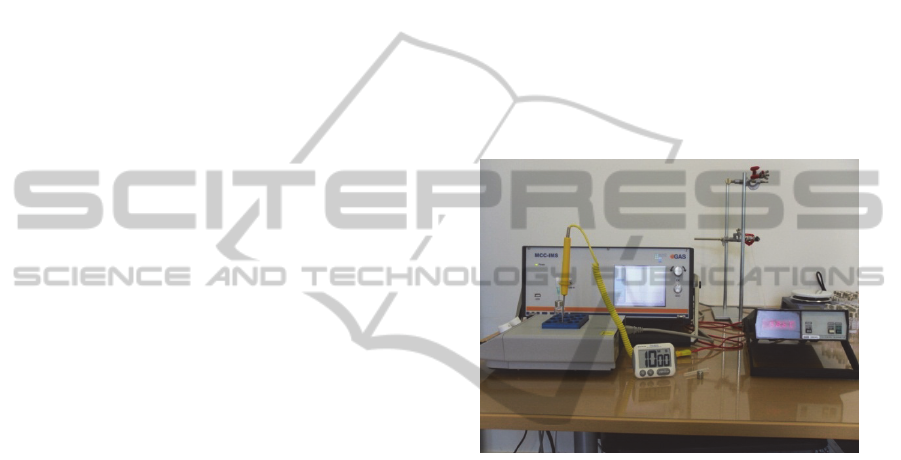
A strip with collected lacrimal fluid was placed
in a 20 mL vial, sealed and heated in an Analogic
Heating Plate from VWR®, at 60ºC during 10
minutes. The vial was connected to the MCC-IMS
through a needle that was inserted across the silicone
septum. Figure 3 shows the experimental scheme
considered in this study
After the 10 min of equilibrium headspace the
carrier gas (N
2
, 25 mL min−1) transferred the
injected sample to the MCC for separation. Then,
the separated analyte, was driven into the ionization
chamber of the ion mobility spectrometer.
Figure 3: Experimental scheme considered in this study.
Analyses were performed on a MCC-IMS
apparatus fabricated by Gesellschaft für Analytische
Sensorsysteme (G.A.S. mbH, Dortmund, Germany).
The multicapillary column (Multichrom, Ltd.,
Novosibirsk, Russia) has a length of 20 cm, a
volume of 0.45 mL, providing a high sample
capacity for preseparation.. The detector was
equipped with a Tritium ioniztion asource (St.
Petersburg, Russia) with an activity of 300 MBq. A
sample inlet lets a continuous stream of nitrogen 5.0
(Air Liquide, Portugal) at 25 mL min−1 to pass
through the ionization chamber where ions are
formed and focused to a shutter grid. A drift gas
flow rate of 500 mL min−1 was used to provide a
good separation of ions and to reduce the flush time
between consecutive measurements.
All experimental parameters of MCC-IMS , such
as drift gas and carrier gas flow rates, injection
volume, grid pulse and system temperature, were
optimized in order to obtain the better spectra.
BIODEVICES2013-InternationalConferenceonBiomedicalElectronicsandDevices
222
3 RESULTS AND DISCUSSION
All spectra were recorded in the positive ion mode.
To avoid contamination of the system with residual
traces from previous runs a system was flushing by
high drift gas flow rate of 500 mL min−1 before
each analysis.
The peak area was used as analytical signal. A
dedicated data acquisition and analysis software
LAV
®
from G.A.S. was used for analysis of the
results.
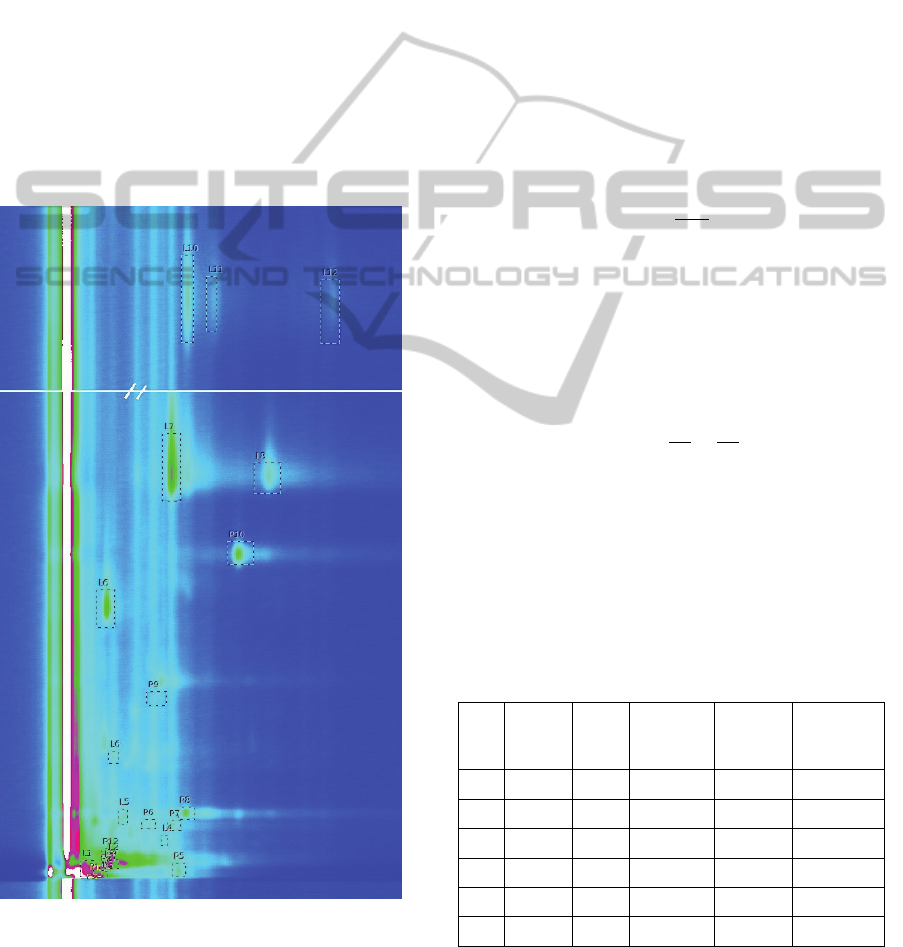
A typical spectrum from the performed analysis
is presented in Figure 4. In this map the white colour
represents the highest intensity and saturation and
the black colour represents a negative intensity. The
middle colours vary from blue to green, and then to
pink and red. It was possible to observe several
peaks in the obtained spectra.
Figure 4: Example of a spectrum obtained for one of the
samples analysed. Identified with a P and a number are the
peaks related to the strip analysis, and identified with an L
the peaks of the lacrimal fluid.
To distinguish the peaks related to the lacrimal
fluid and the peaks related to the sterile strip we
have also performed a separate analysis of a single
strip without any tear sample. The peaks in the
Figure 4 identified with P are related to the strip
analysis and the peaks identified with L are related
to the lacrimal fluid.
In the present study were identified 10
characteristic peaks for the strip, and 15 peaks for
the lacrimal fluid. The LAV software were used for
determination of the intensity of the peaks and there
position, determined by the corresponding retention
time (t
r
) and drift time (t
d
). The characteristic
parameter of IMS spectra is referred to as ion
mobility, K. It represent as a quotient of ion velocity
and electric field on the tube, and can be calculated
using the measured drift time, td, of an ion through a
drift length, l
d
, under electric field, E:
However, this ion mobility value can be
normalized to standard gas density, 2.687×10¹⁹
molecules/cm, corresponding to T
0
=273 degree
Kelvin and P
0
=101325 Pascal, and reported as the
reduced ion mobility, K
0
(Bensch and Leonhardt ,
2002):
In the Table 1 are represented the calculated
values of reduced ion mobility, as well as the
experimentally determined respective retention
time, drift time and intensities for most relevant
peaks from lacrimal fluids analysis of diabetic and
healthy (control) group.
Table 1: Characteristic parameters for some relevant peaks
obtained from the lacrimal fluid.
Peak t
r
(s)
t
d
(ms)
K
0
ࢉ
ࢂ
ି
࢙
ି
Intensity
(control
group)
Intensity
(diabetes
group)
L6
49,98 8,67 1,26 0,24 0,24
L7
55,20 8,39 1,31
0,29 0,24
L9
106,73 8,48 1,29
0,33 0,54
L11
151,88 13,07 0,84
0,13 0,11
L13
427,39 11,47 0,95
0,10 0,11
L17
428,76 14,88 0,74
0,08 0,08
It was observed that, from the qualitative point of
view, all spectra of lacrimal fluids contain the same
ܭൌ
݈
ௗ
ܧݐ
ௗ
ܭ
ൌܭ
൬
ܲ
ௗ
ܲ
൰൬
ܶ
ܶ
ௗ
൰
InstrumentalToolsforExpressAnalysisofLacrimalFluids
223

characteristic peaks from the diabetic and healthy
persons. However, some of them represent a
different intensity: the peaks L7 and L11 have a
lower intensity for the diabetes patients, while the
intensity of the L9 is much higher.
These first results show that ion mobility
spectrometry can provides an analysis of lacrimal
fluids by detecting and visualization of volatile
organic compounds.
4 CONCLUSIONS
A first feasibility study with ion mobility
spectrometry was performed to find characteristic
peaks of volatile organic compounds in lacrimal
fluid matrix.
Obtained preliminary results indicate that MCC-
IMS technology is suitable for express analysis of
lacrimal fluid, enabling the detection and recognition
of analytes from this non-invasive matrix which are
relevant in underlying metabolic processes or
diseases.
Further studies with greater numbers of patients
are necessary. Additionally it will be interested to
analyse under the same experimental conditions a
glucose solution (1M) and human. A possibility to
observe coincident peaks of the glucose and insulin
with the analysis of the tear can clarify better if the
glucose level can be monitored through the tear
analysis by IMS.
The different intensities of detected peaks of
insulin and glucose in both control and diabetic
group can indicate a way for probable diagnostic or
disease monitoring
Future experiments shall be performed in order
to allow identification and quantitative analysis of
the compounds present in the lacrimal fluid so that
this method can have clinical application.
The additional testing of exhaled breath by GC-
MS may to relate peaks to corresponding and
chemically identified volatile organic compounds.
ACKNOWLEDGEMENTS
We would like to express our acknowledgments to
all the volunteers because without them this work
would not be possible.
REFERENCES
Baumbach, J. (2009). Ion mobility spectrometry coupled
with multi-capillary columns for metabolic profiling
of human breath. In Journal of Breath Research. IOP
Publishing.
Bensch, H. and Leonhardt, M. (2002) Comparison of drift
times of different IMS. Ion Mobility Spectrometry., 5
(3), 7-10
Blake, R. S., Monks, P. S., & Ellis, A. M. (June de 2009).
Proton-Transfer Reaction. ChemInform.
Eiceman, G. (2005). Ion Mobility Spectrometry. Taylor &
Francis Group.
Spanel, P., & Smith, D. (November de 1996). Selected ion
flow tube: a technique for quantitative trace gas.
Medical & biological engineering & computing, pp.
409-419.
Stach, J., & Baumbach, J. I. (2002). Ion Mobility
Spetrometry - Basic Elements and Applications.
International Journal of Ion Mobility Spectrometry,
pp. 1-21.
Stauffer, E., Dolan, J. A., & Newman, R. (2007). Fire
Debris Analysis. Academic Press.
Zhou, L., and Beuerman, R. W. (2012). Tear analysis in
ocular surface diseases. Progress in Retinal and Eye
Research, pp. 1-24.
BIODEVICES2013-InternationalConferenceonBiomedicalElectronicsandDevices
224
