
Group Recommender Systems
Some Experimental Results
Vineet Padmanabhan
1
, Prabhu Kiran
1
and Abdul Sattar
2
1
Department of Computer & Information Sceinces, University of Hyderabad, Hyderabad, India
2
Institute for Integrated and Intelligent Systems, Griffith University, Brisbane, Australia
Keywords:
Machine Learning, Recommender Systems.
Abstract:
Recommender Systems (RS) are software applications which aim to support users in their decision making
while interacting with large information spaces. Most recommender systems are designed for recommending
items to individuals. In this paper we provide experimental results related to developing a content-based
group recommender system. To this end we make two important contributions. (1) Implementation of a
group recommender system based on decision-lists as proposed recently in (Padmanabhan et al., 2011)
using MovieLens dataset which is a relatively huge data-set (100,000 ratings from 943 users on 1682 movies)
as compared to the data-set size of 150 used in (Padmanabhan et al., 2011) (2) We use seven variants of
decision-tree measures and built an empirical comparison table to check for precision rate in group
recommendation based on different social-choice theory strategies.
1 INTRODUCTION
Though it is a well known saying that Information
is Wealth people nowadays find it difficult to get
useful information because of the huge amount of
data available in the Internet in the form of books, ar-
ticles,movies, music, web sites etc. Therefore, select-
ing an item that is of ones own interest have become
a very difficult task. So we need systems that help
in filtering the content available and suggest only the
data that is of our interest. Such systems are com-
monly known as Personalised Recommender Sys-
tems. Recommender systems have become valuable
resources for users seeking intelligent ways to search
through the enormous volume of information avail-
able to them. Based on what kind of recommendation
techniques are used, personalized recommender sys-
tems are usually classified into three categories (Ado-
mavicius and Tuzhilin, 2005) (a) Collaborative Filter-
ing (CF) (b) Content based Recommending (CB) and
(c) Hybrid. Several recommender systems have been
proposed in the Literature which makes use of the
above techniques as well as other recommendation
strategies like demographic-based (Pazzani, 1999),
utility-based, knowledge-based and association rule-
based techniques (Jananch et al., 2010). In this pa-
per we are mainly concerned with Content-based rec-
ommendation. In content-based recommendation one
tries to recommend items similar to those a given user
has liked in the past, whereas in collaborative recom-
mendation one identifies users whose tastes are simi-
lar to those of the given user and recommends items
they have liked. For instance, a content-based recom-
mendation would be something like Movie X is rec-
ommended because its category is Action and con-
tains the term Bruce Willis, which are features con-
tained in article you rated. A collaborative recom-
mendation would be like Movie X is recommended
because other users similar to you have liked it. For
example, if Bob and Wendy liked the same movies as
you in the past and they both rated Star Wars highly,
you might like it, too.
Most of the previously published studies in rec-
ommender systems focus on the technique of building
personalized/single-user recommender systems and
hence is not suitable for supporting purchasing de-
cisions of a group. Those that have addressed the
problem of group recommender systems (Masthoff,
2003; McCarthy and Anagnost, 1998; O’Connor
et al., 2001) assume that the input of the system is
comprised of items ratings given by individuals and
the group recommendation is obtained by combining
or aggregating (based on some predefined aggrega-
tion strategy) the individual recommendations of the
members in the group. The problem with this ap-
proach is that (1) the ratings are combined without
370
Padmanabhan V., Kiran P. and Sattar A..
Group Recommender Systems - Some Experimental Results.
DOI: 10.5220/0004331003700376
In Proceedings of the 5th International Conference on Agents and Artificial Intelligence (ICAART-2013), pages 370-376
ISBN: 978-989-8565-39-6
Copyright
c
2013 SCITEPRESS (Science and Technology Publications, Lda.)
considering the interaction of group members which
may lead to incorrect recommendations for a group.
(2) It is difficult to specify the additional informa-
tion which may be required from the user to deter-
mine the exact combination/aggregation strategy and
(3) Lot of time will be required even if opinion from
domain experts are sought to guide the combination
process. In this paper we follow our previous work
on group recommender system (Padmanabhan et al.,
2011) wherein the group recommender problem is de-
fined as: Let I = i
1
, i
2
, i
3
, i
4
, . . . , i
n
be the set of all
items and U = u
1
, u
2
, u
3
. . . u
m
be the set of all users.
IG is the set of items that are not rated by G (sub-
set of U). Goal is to find ratings for items in IG or
to find whether the items in IG are recommendable to
the given group of people (G). Other related works in
the area of group recommender systems and how they
differ from our model is summarized below.
In (Chen et al., 2008) a group recommendation
approach based on collaborative filtering and genetic
programming is proposed. In this work the authors
assume that the input data already contains ’items’
ratings given by individuals and then use genetic al-
gorithm to get ’items’ group ratings. In our ap-
proach both individual as well as group ratings are
learned. The individual ratings are learned by the rule
learner and the group ratings using social choice the-
ory strategies. Moreover we use content based ap-
proach whereas in (Chen et al., 2008) the approach
is that of collaborative filtering and hence suffers
from cold-start, first-rater and popularity bias prob-
lems. (Yu et al., 2006) make use of content based
approach and outlines a method to merge individual
user profiles to get common user profile. Here the
merging is based on individual user preferences on
features (e.g. genre, actor and keyword about a pro-
gram) whereas we combine individual user ratings on
whole programs rather than features. The obvious dis-
advantage of this approach is that it increases the time
and effort required to do the recommendation. (Tubio
et al., 2008) also uses content-based approach but the
focus is more on developing an ontology language
like OWL through which digital TV programs can
be described and then to relate them through their se-
mantic characteristics. There are no experimental re-
sults to show how this can be acheived. In (Masthoff,
2004) no mention is made on how to get user pro-
files. Social choice theory strategies are mentioned
but again how to include a learning component to
make use of those strategies is not shown. (de Cam-
pos et al., 2007) proposes a group recommender sys-
tem based on Bayesian Network. They do not discuss
about how groups are formed but sums up by saying
that a group is a new entity where recommendations
are made by considering the particular recommenda-
tions of its members in some way. In our case we are
more interested in combining individual user models
to adapt to groups such as how humans select a se-
quence of television items to suit a group of viewers.
2 VSW METHOD
Vineet et.al., (Padmanabhan et al., 2011) proposed
a movie group recommender System based on
Decision List Rule Learner (Rivest, 1987; Cohen,
1995; Quinlan, 1996) and social choice theory strate-
gies (Masthoff, 2003) (here we refer their approach as
VSW Method). They used a Data set of 150 movies
where each is a collection of 12 attribute-value pair.
Movies are rated on a 5-scale 0, 1, 2, 3, 4 [Bad, Av-
erage, Above-average, Good, Excellent]. The VSW
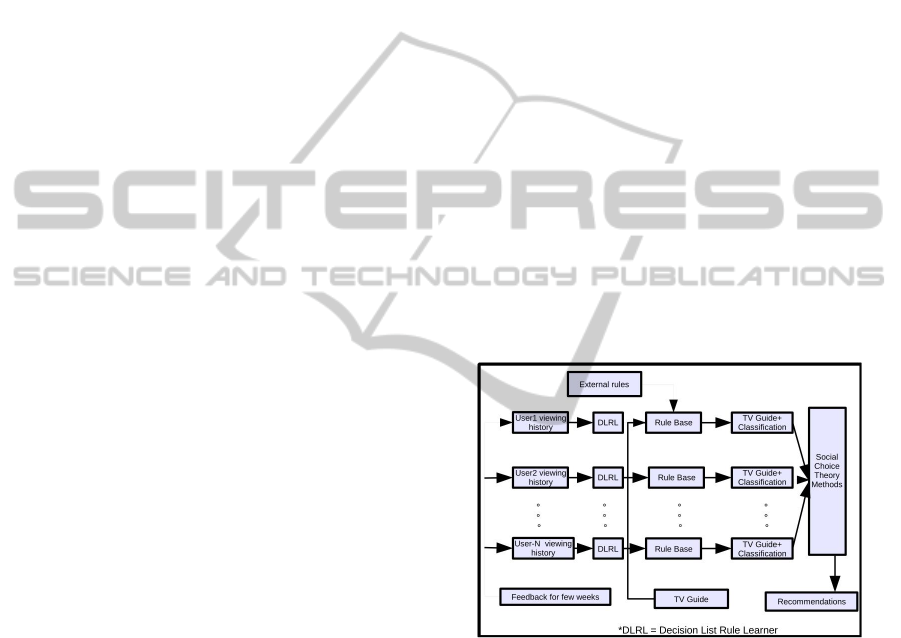
approach is shown in Figure 1 and is based on the
following 5 steps (1) content based recommendation
technique (2) merging recommendation list strategy
(3) social choice strategies to get group recommenda-
tion list (4) RTL strategy to get group recommenda-
tion list and (5) Decision List Rule Learner (DLRL).
Figure 1: Recommender system based on VSW method.
The working of vsw method as shown in Figure
1 is as follows: initially, the system has no idea to
recommend any programs except if we add any ex-
ternal rules. For few weeks, it will collect ratings for
each and every program the user has watched. These
are the training examples to the learning algorithm.
From these training examples the learning algorithm
learns the set of rules that cover all training examples.
This process will be done for every user i.e., for each
user, we get a separate rule base (User profile). Now
we know that any TV guide contains information re-
garding TV programs i.e., Day, Date, Time, Channel
etc. By using the rule base of each user we generate
predicted ratings of programs in the TV guide which
GroupRecommenderSystems-SomeExperimentalResults
371

is shown as TV Guide + Classification in Figure 1.
These programs with predicted ratings are nothing but
recommendation list for each individual user. Finally,
social choice theory strategies are used to get a com-
bined (group) recommendation list.
Learning algorithm plays major role in content
based recommendation approach. It is used to learn
user profiles. Our learning algorithm (DLRL) as
mentioned in Figure 1 is a decision list rule learner
based on RIPPER (Cohen, 1995) and FOIL (Quin-
lan, 1996) rule learners. It is a multi-class rule learner
wherein there are five classes : bad, average, above
average, good, excellent. Initially, all training ex-
amples are divided into two sets: training data and
prune data. Training data is used to learn the set
of rules. Prune data is used to prune the rules to
avoid over-fitting. FOIL Information gain is given
as FOIL Gain(L, R) = t(log
2
(
p
1
p
1
+n
1
) − log
2
(
p
0
p
0
+n
0
))
where L is the candidate literal to add to rule R, p
0
is
the number of positive bindings of R, n
0
is the number
of negative bindings of R, p
1
is the number of positive
bindings of R + L, n
1
is the number of negative bind-
ings of R + L, t is the number of positive bindings of
R also covered by R + L. The formula used to prune
the rule is defined as v =
(p−n)
(p+n)
where p is the number
of positive examples covered by the rule in prune data
set and n is the number of negative examples covered
by the rule in the prune data set. Pruning criteria is
deleting the final sequence of conditions that maxi-
mizes v. The different steps involved in our learning
algorithm is shown in Algorithm 1.
Algorithm 1: Learning Algorithm used in VSW.
Input: Train Data,Prune Data
Output: set of rules
Step 1: foreach class do
Find the number of training examples for that class;
Take the class with maximum number of examples, make that as
Default class;
Step 2: Take an empty RuleSet;
while No class has left do
take the next smallest class;
Consider training examples for that class as positive,
remaining as negative;
while All positive examples covered do
Take empty Rule;
Add conjuncts to rule as soon as it improves FOIL
Information gain;
prune the rule by deleting any final sequence of
conditions;
Mark covered positive examples by this rule;
Add this rule to RuleSet;
Step 3:Add Default Rule to RuleSet;
Return RuleSet;
Table 1: Example to demonstrate Social choice Strategies.
Tv-Programs A B C D E F G H I J
John 10 4 3 6 10 9 6 8 10 8
Adam 1 9 8 9 7 9 6 9 3 8
Mary 10 5 2 7 9 8 5 6 7 6
In VSW, mention is made about four social
choice theory strategies as out- lined in (Masthoff,
2003). The main idea behind social choice the-
ory is (also called as group decision making) decid-
ing what is best for a group given the opinions of
individuals. The strategies used in the implemen-
tation are (1) Utilitarian Strategy (Hogg and
Jennings, 1999): In this strategy, instead of using
ranking information, utility values are used. This can
be done in multiple ways, additive or multiplicative.
For example, the utility values for the 10 programs in
Table 1. will be 21, 18, 13, 22, 26, 26, 17, 23, 20,
22 respectively (column-wise addition). The TV pro-
gram E and F are having highest utility values. So
either E or F is the recommended program. (2) Least
misery strategy (O’Connor et al., 2001): In
this strategy, the item with large minimum individ-
ual rating will be recommended. The idea behind this
strategy is that a group is as happy as its least happy
member. For Example, the group rating for the 10 TV
programs based on Least Misery Strategy will be 1, 4,
2, 6, 7, 8, 5, 6, 3, 6 respectively. From the above group
ratings, F has the highest rating. So TV program F
is recommended by Least misery strategy. (3) Most
pleasure strategy (Masthoff, 2004): Making
new list with the maximum of individual ratings. For
Example, from Table 1 the group rating for 10 TV
programs based on this strategy will be 10, 9, 8, 9,
10, 9, 6, 9, 10, 8 respectively. From the above group
ratings, A, E, I are having the highest rating values.
So either A, E or I will be the recommended TV
program. (4) Average without Misery strategy
(McCarthy and Anagnost, 1998): In this strat-
egy, a new list of ratings is made with the average of
the individual ratings, but without items that score be-
low a certain threshold for individuals. The item with
maximum value will be recommended. For example,
from Table 1. considering a threshold of 4 the average
values for 10 TV programs will be -, 18, -, 22, 26, 26,
17, 23, -, 22 respectively. The TV program E and F
are having highest utility values. So either E or F is
the recommended program.
(Padmanabhan et al., 2011) suggested that a single
strategy alone would not be sufficient to get the most
accurate result as far as group recommendation is con-
cerned. To address this problem a combined strategy
was put forward that considers three factors: (1) Least
group member happy (like least misery strategy) (2)
Most group member happy (like most pleasure strat-
ICAART2013-InternationalConferenceonAgentsandArtificialIntelligence
372
egy) and (3) Total group happy (like Utilitarian strat-
egy) and named the strategy as RTL (Repeat Total plus
Least group happiness strategy). The strategy can be
explained as follows: Let G be a group consisting of
N users and I be the set of instances. Remove in-
stances with a user rating ”0”. If all instances in I
have user rating 0 then continue. For each instance
in I, calculate the sum of least happiness and total
happiness. Recommend the instance with maximum
value. If we have maximum value for multiple in-
stances, remove other instances from I and remove the
minimum values (least happiness) from instances in I
and apply the same above process for the new set of
instances repeatedly. Hence the name Repeat Total
plus Least group happiness strategy. For ex-
ample, let us take five users and two TV programs
with ratings, I
1
={1, 2, 1, 1, 4}, I
2
= {1, 2, 2, 2, 2}.
C
1
=group happiness + least happiness = 9 + 1 = 10.
Similarly C
2
= 9 + 1 = 10, here maximum value =10.
Therefore, I
1
will be {2, 4} and I
2
will be {2, 2, 2, 2}.
Now, C
1
= 6 + 2 = 8 and C
2
= 8 + 2 =10. Here maxi-
mum value is 10 for C
2
. Therefore instance 2 will be
recommended.
3 EXPERIMENTAL RESULTS
USING VSW METHOD WITH
MovieLens DATASET
The VSW method (Vineet et.al. [6]) was imple-
mented on a movie data set which had around 150
entries. The main reason for outlining this work is
that we tried to evaluate the performance of VSW
method by using a real-world movie data set like that
of MovieLens data which has more than one hun-
dred thousand entries. We also looked into other as-
pects of the VSW method like trying to use a data
structure like decision tree instead of Decision list
and re-evaluated the performance. Experiments are
performed with a real data set(MovieLens) that has
been used as benchmark in prior works. MovieLens
data sets were collected by the GroupLens Research
Project at the University of Minnesota. This data set
consists of (a) 100,000 ratings from 943 users on 1682
movies (b) The range of rating is between 1 (bad) and
5 (excellent) (c) Each user has rated at least 20 movies
(d) Movies are classified according to their 19 genres
and these genres are the features of the movies in our
data set (e) The 19 genres are: Unknown, Action, Ad-
venture, Animation, Childrens, Comedy, Crime, Doc-
umentary, Drama, Fantasy, Film-Noir, Horror, Musi-
cal, Mystery, Romance, Sci-Fi, Thriller, War, Western
(f) 1 under a particular genre indicates that movie is of
that genre and 0 indicates it is not (g) Movies can be
in several genres at once. The metric that we used to
calculate the performance of our group recommender
system (VSW-GRS) based on the data given above is:
value =
∑
k
t=1
∑
m
j=1
r
jt
max
j
precision =
value
m
where k is the number of test instances, m is the size
of group, r
jt
is the rating of user j on test instance
t and max
j
is the maximum rating given by user j.
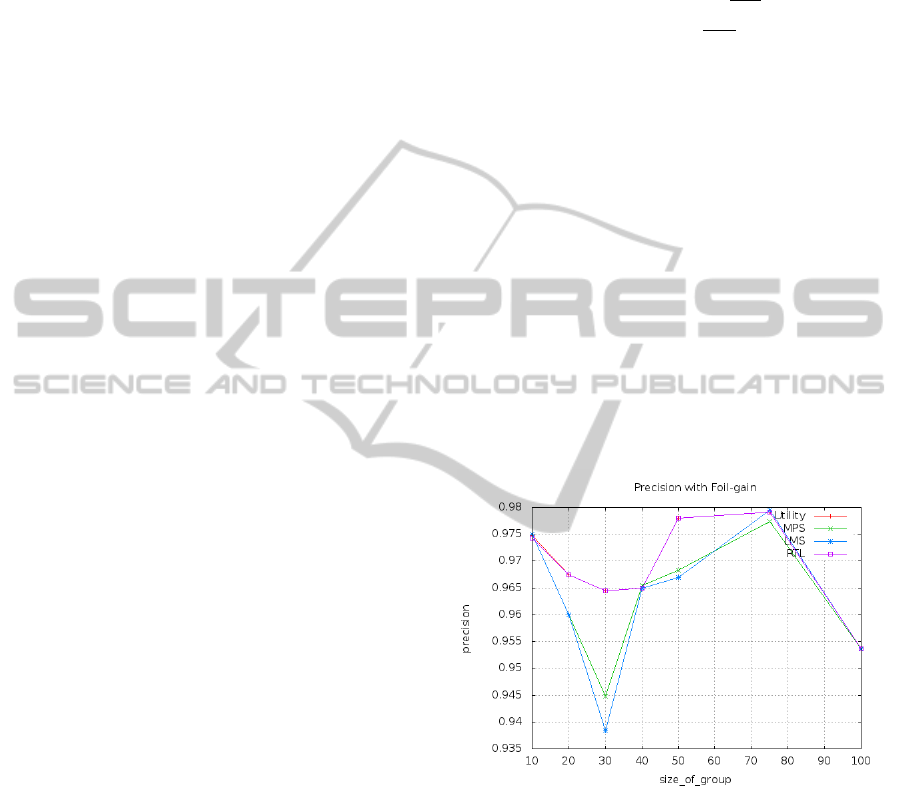
The performance of our group recommender system
using the above metrics and FOIL information gain
(FOIL-Gain) as mentioned earlier, with groups of size
10, 20, 30, 40, 50, 75 and 100 is shown in Figure 2.
Utility, MPS, LMS, and RTL stands for the respec-
tive social startegies used. It is imperative to mention
here that in (Padmanabhan et al., 2011) the implement
ion of a movie Group Recommender using a Decision
List Rule Learner was done with a data set of size
150. In the current set of experiments with VSW we
have used the Movielens data set which is in tune of
around 100000. It should be clear from Figure 2 that
a decision list based recommender system with FOIL-
GAIN and using RTL and utilitarian social startegies
gives similar precision.
Figure 2: Decision-List with FOIL-gain.
3.1 Comparison of Decision Tree
Measures in VSW-GRS
In the previous section we outlined the implementa-
tion results of VSW-GRS which in turn makes use
of the Decision-List data structure and FOIL-Gain
information measure. In this section we make use of
different decision-tree (Mingers, 1989) selection
measures along with each of the social choice
strategies and RTL and compare the precision
rate in making group recommendations based on
the MovieLens dataset. Our implementation results
GroupRecommenderSystems-SomeExperimentalResults
373
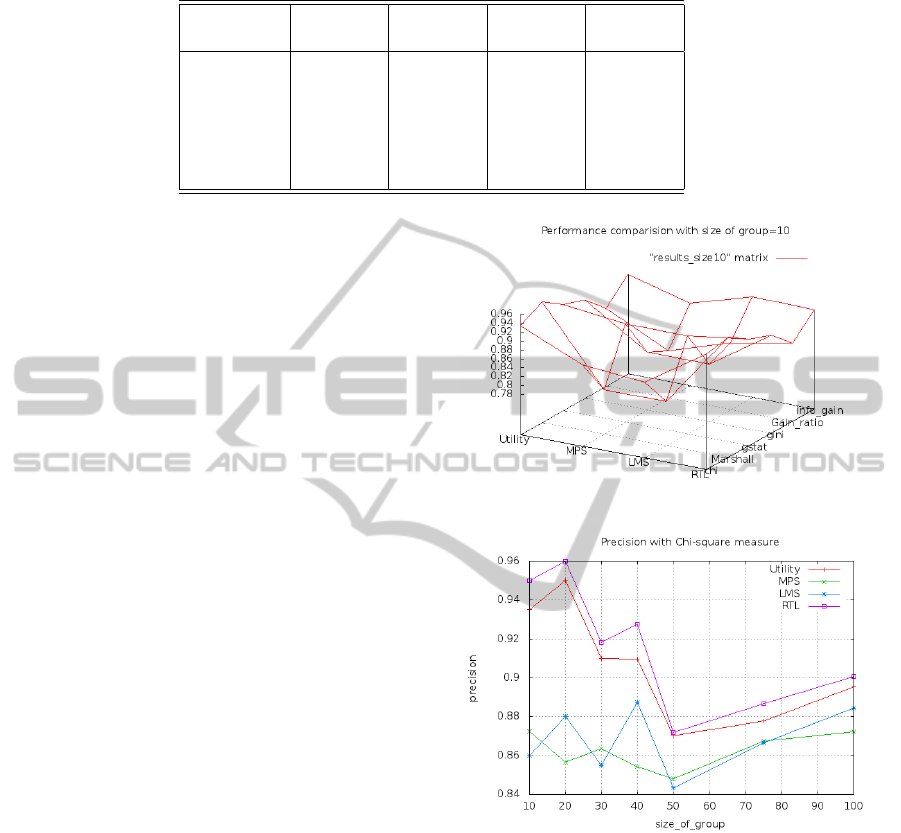
Table 2: Results show that RTL is out-performing than other strategies.
Measure Utility MPS LMS RTL
(ADD)
chi-square 0.935000 0.872500 0.860000 0.950000
Info-gain 0.913607 0.875000 0.915000 0.913607
G-stat 0.927672 0.910000 0.910000 0.927672
Gain Ratio 0.865000 0.796667 0.840000 0.865000
GINI 0.910000 0.820000 0.820000 0.910000
Marshalls 0.959999 0.790000 0.790000 0.959999
show that RTL out-performs all other Social choice
strategies. The different selection measures used in
the implementation are (1) Quinlans Information
measure(IM), (2) The chi-square statistic
(3) The G statistic(G) (4) GINI index of
Diversity(GINI) (5) Gain-Ratio Measure(GR)
(6) FOIL Gain and (7) Marshalls Correction.
Since these decision tree measures are well known
in the Machine learning community we do not
feel the necessity of explaining each one. The
implementation details are as follows:
Training and test sets are formed by dividing the
entire data set into 80% − 20% sets respectively. A
Model is built on the training set and we evaluated its
performance on the test set using the metric given in
the previous section. Results of this analysis with size
of group 10 is shown in Table 2. The data is plotted
using a matrix. When the data is represented in the
matrix format, the X and Y coordinates are the index
of row and column. The Z coordinate value ranges of
matrix cells. The performance of above metrics with
size of groups
{
10, 20, 30, 40, 50, 75, 100
}
opposite to
every selection measure is depicted in figures (Figure
4, Figure 5, Figure 8, Figure 7, Figure 6, and Figure
9). Here the X and Y coordinates are the size of a
group and precision. The precision is evaluated for
every social choice strategy (MPS, LMS, Utility) and
RTL. Talking about the results as they stand, the Mar-
shall correction (Figure 9) and the G-statistic (Fig-
ure 8) is marginally best and the gain-ratio (Figure 5)
with probability not the best. In fact, the results show
that accuracy is not improved significantly by using
a measure at all. However, the choice of measure
does significantly influence the size of unpruned trees.
Randomly selecting attributes produces trees roughly
twice as large as those produced with an informed
measure. Between the measures, the gain ratio gener-
ates the smallest trees, whereas chi-square produces
the largest, which will affect the performance of the
Recommendation system.
Figure 3: Precision with group size=10.
Figure 4: Precision with Chi-Square.
4 CONCLUSIONS
One important conclusion of this paper is that the em-
pirical results show that the predictive accuracy of
Group recommendation is not affected by the selec-
tion measures used in decision tree construction. A
second important conclusion is that the RTL method
is giving better results than any other social choice
strategies irrespective of measures used in the con-
struction of decision trees. In fact, the results show
that accuracy is not improved significantly by using
a measure at all. Selecting attributes entirely ran-
domly produces trees that are as accurate as those
ICAART2013-InternationalConferenceonAgentsandArtificialIntelligence
374
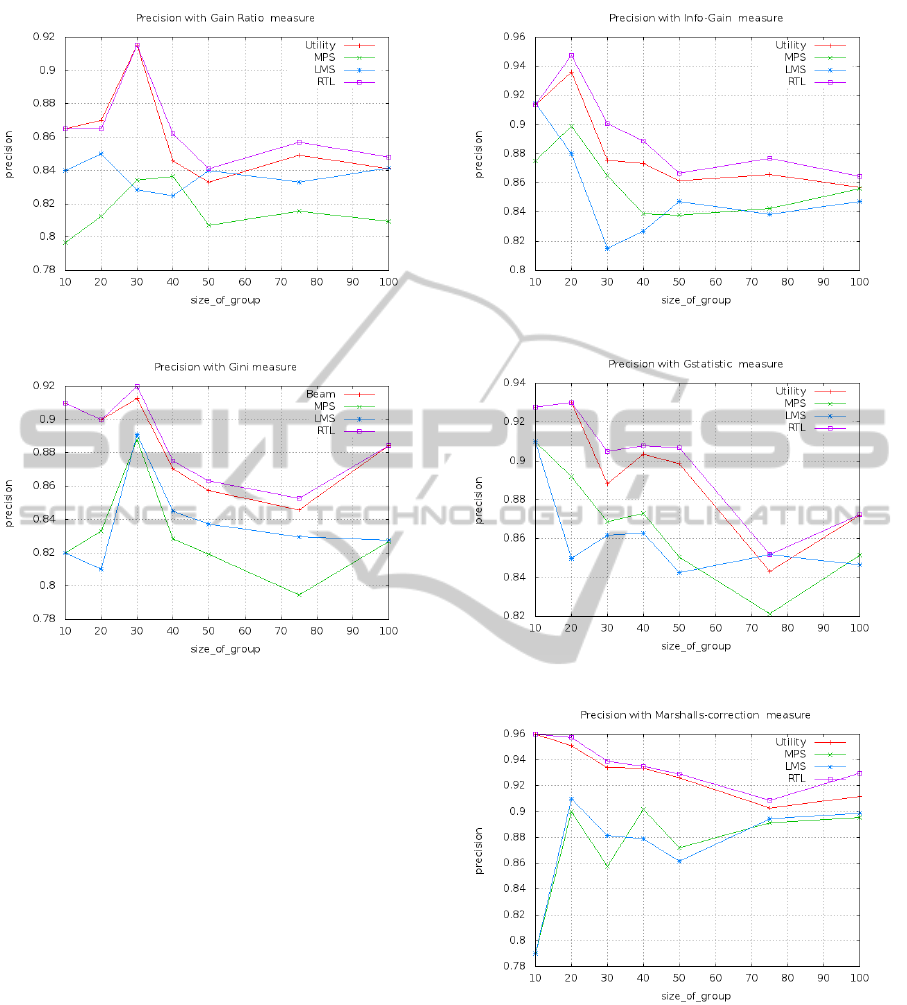
Figure 5: Precision with Gain-ratio.
Figure 6: Precision with Gini.
produced using a particular measure. In the case of
decision-list based VSW we saw that both RTL and
Utilitarian strategy were having the same precision.
Moreover we have used MovieLens data set for ex-
perimental evaluation which is a relatively huge data
set and is a benchmark dataset from an industrial per-
spective too. There are several ways in which our
method could be extended. One aspect which we
have not looked into is how requirements( Adityaet
al.,2011 (Parameswaran et al., 2011)) affect recom-
mendations. For instance, in a University environ-
ment, for a student to graduate the student needs to
satisfy a bunch of requirements like take 2 courses
from a, b, c, d, but b and c together don’t count.
Also we have not looked into the problem of pre-
requisites (Parameswaran et al., 2010a) wherein when
we make recommendations we need to make sure that
we recommend a package of items such that the pre-
requisites are present in the package itself like the
course linear algebra needs to be taken before cal-
culus. There is also some recent work on how se-
quence mining (Parameswaran et al., 2010b) can be
used to form an aggregated recommendation and en-
vironment which we have not looked into.
Figure 7: Precision with Info-gain.
Figure 8: Precision with Gstatistic.
Figure 9: Precision with Marshall’s Correction.
REFERENCES
Adomavicius, G. and Tuzhilin, A. (2005). Toward the next
generation of recommender systems: a survey of the
state-of-the-art and possible extensions. Knowledge
and Data Engineering, 17(6):734 – 749.
Chen, Y. L., Cheng, L.-C., and Chuang, C. (2008). A group
recommendation system with consideration of inter-
GroupRecommenderSystems-SomeExperimentalResults
375

actions among group members. Expert Syst. Appl.,
34(3):2082–2090.
Cohen, W. W. (1995). Fast effective rule induction. In
ICML, pages 115–123.
de Campos, L. M., Luna, J. M., Huete, J. F., and Morales,
M. A. (2007). Group recommending: A methodolog-
ical approach based on bayesian networks. In ICDE
Workshops, pages 835–844.
Hogg, L. and Jennings, N. R. (1999). Variable sociability in
agent-based decision making. In ATAL ’99, Orlando,
USA, July 15-17, 1999, pages 305–318.
Jananch, D., Zanker, M., Felfernig, A., and Friedrich, G.
(2010). Recommender Systems - An Introduction.
Cambridge University Press, Cambridge.
Masthoff, J. (2003). Modeling the multiple people that are
me. In 9th international conference on User modeling,
UM’03, pages 258–262, Heidelberg. Springer.
Masthoff, J. (2004). Group modeling: Selecting a sequence
of television items to suit a group of viewers. User
Model. User-Adapt. Interact., 14(1):37–85.
McCarthy, J. and Anagnost, T. D. (1998). Musicfx: An
arbiter of group preferences for computer aupported
collaborative workouts. In CSCW, pages 363–372.
Mingers, J. (1989). An empirical comparison of selection
measures for decision-tree induction. Mach. Learn.,
3(4):319–342.
O’Connor, M., Cosley, D., Konstan, J. A., and Riedl, J.
(2001). Polylens: A recommender system for groups
of user. In ECSCW, pages 199–218.
Padmanabhan, V., Seemala, S. K., and Bhukya, W. N.
(2011). A rule based approach to group recommender
systems. In MIWAI, pages 26–37.
Parameswaran, A., Venetis, P., and Garcia-Molina, H.
(2011). Recommendation systems with complex con-
straints: A course recommendation perspective. ACM
Trans. Inf. Syst., 29(4):20:1–20:33.
Parameswaran, A. G., Garcia-Molina, H., and Ullman, J. D.
(2010a). Evaluating, combining and generalizing rec-
ommendations with prerequisites. In CIKM ’10, pages
919–928.
Parameswaran, A. G., Koutrika, G., Bercovitz, B., and
Garcia-Molina, H. (2010b). Recsplorer: recommen-
dation algorithms based on precedence mining. In
SIGMOD ’10, pages 87–98, New York, NY, USA.
ACM.
Pazzani, M. J. (1999). A framework for collaborative,
content-based and demographic filtering. Artif. Intell.
Rev., 13(5-6):393–408.
Quinlan, J. R. (1996). Improved use of continuous attributes
in c4.5. Journal of Artificial Intelligence Research,
4:77–90.
Rivest, R. L. (1987). Learning decision lists. Machine
Learning, 2(3):229–246.
Tubio, R., Sotelo, R., Blanco, Y., Lopez, M., Gil, A., Pazos,
J., and Ramos, M. (2008). A tv-anytime metadata ap-
proach to tv program recommendation for groups. In
Consumer Electronics, ISCE, pages 1–3.
Yu, Z., Zhou, X., Hao, Y., and Gu, J. (2006). Tv program
recommendation for multiple viewers based on user
profile merging. User Model. User-Adapt. Interact.,
16(1):63–82.
ICAART2013-InternationalConferenceonAgentsandArtificialIntelligence
376
