
The Influence of the Sampling Frequency of a Video Recording on a
Heart-rate Detection Algorithm
Marina A. Cidota
1
, Dragos Datcu
2
and Leon J. M. Rothkrantz
3
1
Faculty of Mathematics and Computer Science, University of Bucharest, Academiei Street No. 14, Bucharest, Romania
2
Faculty of Technology, Policy and Management, Delft University of Technology, 2628BX Delft, The Netherlands
3
Netherlands Defense Academy, Den Helder, The Netherlands
Keywords:
Heart-rate Detection, High Speed Camera, Frequency Sampling, Contact-free Technology.
Abstract:
Contact-free technology has a great potential in different medical areas such as personal health monitoring
and telemedicine. One of the physiological parameters that can be measured with this type of technology is
the heart rate. The pulse is proportional with the physical effort or mental stress, its measurement being an
important issue in sport, medicine and psychology. In this paper we present an analysis of the accuracy of
the heart rate detection using a high speed camera for recording a color video with the face of a person. The
recordings were done both from frontal view and from profile and they were resampled to different frequencies
between 10 and 240 frames per second. From our tests we may conclude that it was not the high frequency but
the quality of the videos recorded with a high speed camera that allowed us to reduce the time needed to obtain
the heart-rate up to 5 seconds. We have also noticed that the results are influenced by the errors generated in
the resampling process of the video signal.
1 INTRODUCTION
The idea of a non-contact device for determining dif-
ferent physiological measurements was first imple-
mented in 1997 by Greneker (Greneker, 1997) who
used the radar technology to measure from distance
(up to 10 meters) the pulse and respiration rate of a
person. In 2007, Garbey (Garbey et al., 2007) used a
thermal camera that recorded the temperature fluctu-
ation of the carotid region and based on FFT of this
signal they computed the heart rate with a very high
accuracy. In 2010, Poh (Poh et al., 2010) proposed
an ICA (independent component analysis) based al-
gorithm for detecting the heart rate from a color video
recording of a face done with a web camera. They
applied an optical technique called photoplethysmog-
raphy (PPG) that can be used to detect blood vol-
ume changes in the microvascular bed of tissue from
a selected skin area (Allen, 2007). The PPG wave-
form is attributed to cardiac synchronous changes in
the blood volume with each heart beat. Although the
origins of the components of the PPG signal are not
fully understood, it is generally accepted that they can
provide valuable information about the cardiovascu-
lar system. The PPG technology has been success-
fully used in a wide range of commercial medical
devices for measuring oxygen saturation, blood pres-
sure, heart rate, respiratory rate and also detecting pe-
ripheral vascular disease.
During the cardiac cycle, the superficial blood
vessels from face change their volume and this can be
found in the variation of the amount of reflected light.
By recording a color video of the facial region, the
ICA (Cardoso and Souloumiac, 1993; Comon, 1994)
can be applied to the RGB components to separate the
plethysmographic signal from other sources of fluc-
tuations in light due to artifacts. Once the plethys-
mographic signal is identified, a spectral analysis is
used to compute the heart-rate value. Having a video
recording of a face from a web cam, to obtain an ac-
curate response the window used for computing the
heart rate has a length of 30 seconds (Poh et al., 2010).
One of the restrictions of the existing methodology is
that the person remains as still as possible during the
recording of the video.
In our work, we used a high speed camera with
the goal of analyzing the influence of the frequency
sampling of the video recordings over the heart-rate
value computed from the RGB signals. The record-
ings were done both from frontal view and from pro-
file and they were resampled to different frequencies
between 10 and 240 frames per second. Taking ad-
599
C. Cidota M., Datcu D. and J. M. Rothkrantz L. (2013).
The Influence of the Sampling Frequency of a Video Recording on a Heart-rate Detection Algorithm.
In Proceedings of the 2nd International Conference on Pattern Recognition Applications and Methods, pages 599-603
DOI: 10.5220/0004332205990603
Copyright
c
SciTePress
vantage of the quality of the videos recorded with the
camera that we used, we managed to reduce the length
of the time window needed to compute the heart-rate
up to 5 seconds, as we describe below. We have also
noticed that it is not high sampling frequency of the
video signal but having a small resampling error that
leads to more accurate results.
2 METHODS
2.1 Recordings
With the Pike high speed camera from Allied Vision
Technologies, we have done color video recordings
with six white persons with different complexions,
out of which one wearing glasses and another having
a beard. The recordings were done both from frontal
view and from profile, with the sunlight as the only
source of illumination, and we asked the subjects to
remain as still as possible for 30 seconds. For only
one person we did two sets of recordings, before and
after making physical effort (climbing stairs).
The frequency of the camera cannot be set di-
rectly, it depends on other parameters (like shutter,
gain, whitebalance, gamma etc.) and also on the di-
mension of the frames. With a set of values that
we chose (shutter=100, gain=444, whitebalance=357,
gamma=1 and pixel resolution of 252 × 350), we
computed the ratio between the time length and the
number of frames of a video recording and we got a
frequency of 241.9 frames per second (fps). We re-
sampled each video to different frequencies between
10 and 240 fps.
To be able to see the performance of the algorithm
for heart-rate detection, we needed a device to provide
us accurate measurements of the pulse. We used the
Mobi 8 device produced by TMS International B.V.
which is able to measure the pulse at 2048 Hz.
In order to reduce the computational complex-
ity of our software implementation, for each video
recording we set a fixed rectangular region of inter-
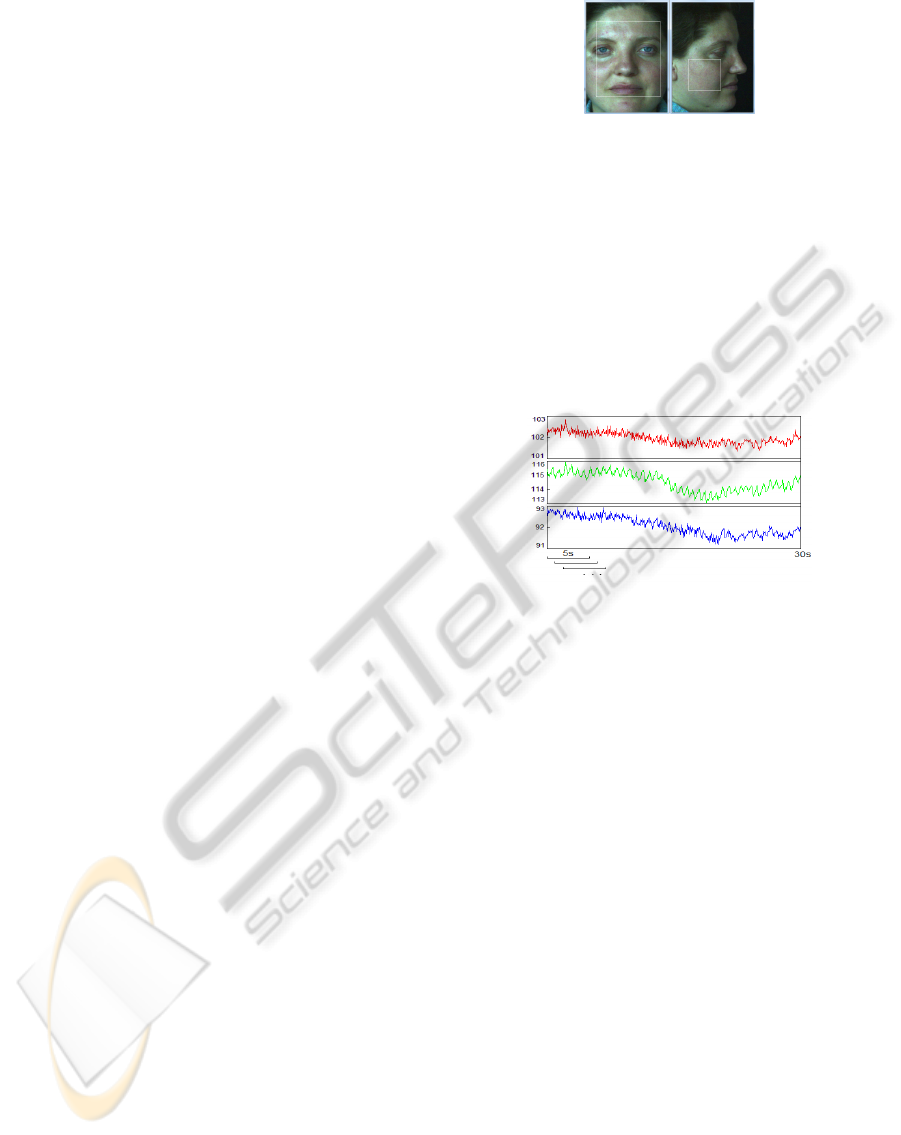
est (ROI) as shown in Figure 1. From each frame of
a video we retained three elements representing the
mean values of RGB extracted from the ROI, so for
each video, with a frequency sampling Fs, the in-
put data for the heart-rate algorithm is a matrix with
30 × Fs rows and 3 columns. For the software im-
plementation of this part we used the C++ program-
ming language with the OpenCV library. The heart-
rate detection algorithm was written in MATLAB and
we used the JADE (Joint Approximate Diagonaliza-
tion of Eigen-matrices) MATLAB implementation for
ICA (Cardoso and Souloumiac, 1993).
Figure 1: (a) Frontal view ROI; (b) Profile ROI.
2.2 Algorithm for Detecting Heart-rate
The main ideas for the heart-rate algorithm were taken
both from (Garbey et al., 2007) and (Poh et al., 2010;
Poh et al., 2011). As shown in Figure 2, at each step
of the algorithm we compute a heart-rate value from
a 5 second window extracted from the RGB signals
and, for the next step of the algorithm, we move the
window with one second to the right and so on until
we reach the end of the signal.
Figure 2: The RGB components obtained by averaging the
red, green, respectively blue values of the pixels from the
ROI.
We now describe the computations that we do
within the 5 second-length window in order to obtain
a heart-rate value. Regarding the length of the win-
dow, our goal was to use the shortest possible length
for which the heart-rate detection algorithm provides
good results. From many tests we have done with dif-
ferent lengths between 3 and 10 seconds, we came to
the conclusion that a 5 second-length window is the
optimal choice.
Before applying ICA to the three RGB signals, we
filter them to keep only the stationary components.
Time and frequency domain methods have been usu-
ally applied to heart rate variability (HRV) analysis.
Spectral density estimation inherently assumes that
the signal is at least weakly stationary. Thus, the non-
stationarities in the HRV signal can cause distortion to
frequency domain analysis and to get over this prob-
lem we applied the detrending method presented in
(Tarvainen et al., 2002). Each RGB signal may be
decomposed in two parts
x = x
stat
+ x
trend
(1)
where x
stat
is the nearly stationary component and
x
trend
is the low frequency trend component which can
be removed using a detrending method that behaves
ICPRAM2013-InternationalConferenceonPatternRecognitionApplicationsandMethods
600
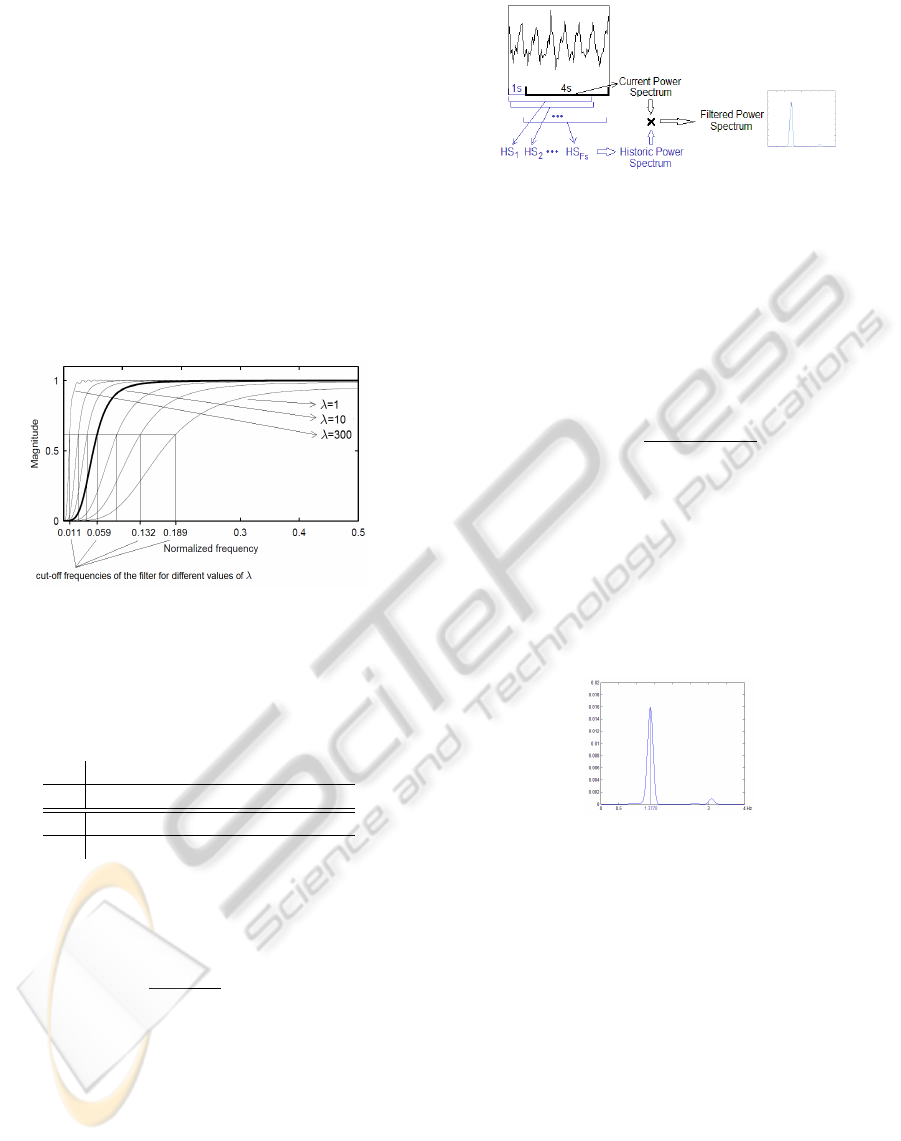
like a time-varying high-pass filter. The frequency re-
sponse of the filter depends on a parameter λ, and this
dependence is presented in Figure 3 (Tarvainen et al.,
2002). The cut-off normalized frequency of the filter
decreases when λ is increased.
The values for λ were chosen so that the de-
trending procedure would not affect the range of fre-
quencies that we are interested in, which is between
[0.7,4]Hz (corresponding to the heart-rate values be-
tween [42,240] beats per minute (BPM)). For in-
stance, if Fs = 15 and λ = 10 then the cut-off fre-
quency is 0.059 ∗ 15 ≈ 0.89Hz. In setting the other
values for λ we guided after the graphs plotted in Fig-
ure 3 and we displayed these values together with the
resampling frequencies Fs in Table 1.
Figure 3: Frequency responses of the detrending filter for
λ= 1, 2, 4, 10, 20, 50 and 300. The corresponding cut-off
frequencies are 0.189, 0.132, 0.093, 0.059, 0.041, 0.025 and
0.011 times the sampling frequency.
Table 1: Values for the parameter λ used in the detrending
algorithm.
Fs 15 25 30 45 60
λ 10 25 30 70 90
Fs 75 100 120 200 240
λ 200 330 400 700 800
A requirement for applying ICA is that the signals
are normalized, so the detrended signals x
1
(t), x
2
(t)
and x
3
(t) become
y
i
(t) =
x
i
(t)−µ
i
σ
i
,i = 1,2, 3,
where µ
i
and σ
i
are the estimated mean and standard
deviation of x
i
(t).
Although the order in which the ICA separates the
independent component is unknown, for all the video
recordings we tested it was always the second com-
ponent which contained the heart-rate signal.
To increase the robustness of the algorithm to tran-
sient noise that may appear during recordings, we di-
vide the 5 second window in two parts. The last 4
seconds from each window were used to compute the
Figure 4: A 5 second window from the second component
returned by ICA.
current power spectrum P. The first second of the sig-
nal contains Fs points. A power spectrum is com-
puted from a 4 second window starting from each
point, and thus we obtain a number of Fs spectra de-
noted by HS
1
,..., HS
Fs
(see Figure 4). The historic
power spectrum is then defined as
H( f ) =
Fs
∑
i=1
HS
i
( f )
L
∑
f =1
Fs
∑
i=1
HS
i
( f )
, (2)
where L is the number of points where FFT is com-
puted for each 4 second length window. The filtered
power spectrum F is computed as the pointwise prod-
uct between the current power spectrum P and the his-
toric power spectrum H (see Figure 5)
F( f ) = P( f ) × H( f ), f = 1,··· ,L. (3)
Figure 5: Filtered power spectrum computed from a 5 sec-
ond window.
For the frequency range that we are interested in,
which is [0.7,4]Hz, we determine the frequency with
the maximum energy from the filtered power spec-
trum, then we multiply it by 60 to get the heart-rate
value. For the case shown in Figure 5, the heart-rate
value would be 1.3770 × 60 = 82.62, i.e. 83 BPM.
In order to remove the influence of accidental
noise on the heart-rate signal, besides the applica-
tion of ICA and using the historic power spectrum,
we set a threshold of 12 BMP to control the differ-
ence between two successive heart-rate values com-
puted from the frequency with the maximum energy.
If the difference exceeds the threshold, we keep the
previous heart-rate value instead of the current one.
TheInfluenceoftheSamplingFrequencyofaVideoRecordingonaHeart-rateDetectionAlgorithm
601

3 RESULTS
Simultaneously with the video recordings we also
measured the pulse of each person. From the data
provided by the Mobi 8 device, we retained only the
pulse values measured at one second distance from
one another. Thus, for each 30 second video record-
ing we had the corresponding 30 element vector with
the heart-rate values. Each video is analyzed with the
5 second window that is shifted with one second at
every step of the algorithm. So, from a 30 second
recording we obtain 26 values that we interpret as be-
ing the heart-rate. To be able to make a comparison
between these values and the ones that represent the
ground truth measurements, we computed moving av-
erages of order 5 from the heart-rate values given by
the Mobi 8 device (see Figure 6).
Figure 6: Moving averages of order 5 from the heart-rate
values.
The recordings, both from frontal view and from
profile, were resampled to different frequencies be-
tween 10 and 240 frames per second. Since the range
of frequencies that we are interested in is [0.7,4]Hz,
we considered as the lowest frequency for analysis a
value (Fs = 10) that is greater than twice the upper
limit of the frequency interval (the Nyquist theorem).
Regarding the resampling process, we have per-
formed it in two ways. First, we selected the frames
with a constant integer step computed as the inte-
ger part of the ratio between the recording frequency
and the new frequency used for resampling (step =
integer(241.9/new f s)). The resampling errors de-
pend on the fractional part of the ratio 241.9/new f s
and these errors proved to have a great impact over
the performance of the heart-rate detection algorithm.
For instance, the error for resampling to new f s = 15
is small (241.9/15 = 16.1267) in comparison with
the error associated with new f s = 25 (241.9/25 =
9.6760) and the differences in performance can be ob-
served in Figure 7. The results shown are obtained
from the same video resampled with a constant step
using different frequencies (small resampling errors
on the left side, big resampling errors on the right side
in Figure 7). The sampling frequencies are shown in
the right lower corner of each graphic. The dotted
lines represent the ground truth values of the heart-
rate and the continuous line is given by the output of
the algorithm. In the upper part we also plotted two
values: the left one is the average of the heart-rate val-
ues computed by the algorithm and the right one is the
average of the real values of the heart-rate.
The second approach for the resampling process
consists of computing the exact position and choosing
the closest frame in the source video (nearest neigh-
bor approach). That implies that for each resampling
performed, the frames are selected with a variable
step. Using this technique, we have resampled each
video recording to the frequencies 10, 12, 15, 25, 37
and 203 fps (some of these values were chosen ran-
domly). For the frontal view ROI we have obtained
very good results for each mentioned frequency (see
Figure 8). With few exceptions, from all the other
frontal view recordings we obtained results that are
very similar to those presented in Figure 7 and in Fig-
ure 8.
Regarding the video recordings with the profile
ROI, we also obtained good results but the resam-
pling frequencies proved to have a greater influence
over the performance of the heart-rate detection algo-
rithm. A possible explanation for this could be the
fact that the aria of the profile ROI is smaller and
thus it is much more sensitive to noise than the frontal
view ROI. Besides the resampling errors, each video
recording is affected by a pseudo-random noise which
introduces big/small distortions at different sampling
frequencies. The noise may come from the camera,
from small movements that a person makes during a
recording and from variation of the sun light.
In Table 2 we display the results computed from
the recordings with the profile ROI resampled to 15
fps (with constant step) and 25 fps (using the nearest
neighbor approach). Compared to the other frequen-
cies used, these are the best results we obtained with
respect to the two types of resampling methods that
we applied.
Table 2: The results obtained for the recordings with the
profile ROI resampled to 15 fps and 25 fps.
recording real mean mean mean
no. value of the value value
heart rate at 15 fps at 25 fps
1 73.9615 71.5633 79.9467
2 56.8462 54.4584 54.5373
3 69.8154 68.8251 69.5519
4 76.5462 74.5380 76.0310
5 76.6308 75.2479 76.0874
6 71.2846 70.3463 72.1717
7 93.1000 91.6091 92.0035
ICPRAM2013-InternationalConferenceonPatternRecognitionApplicationsandMethods
602
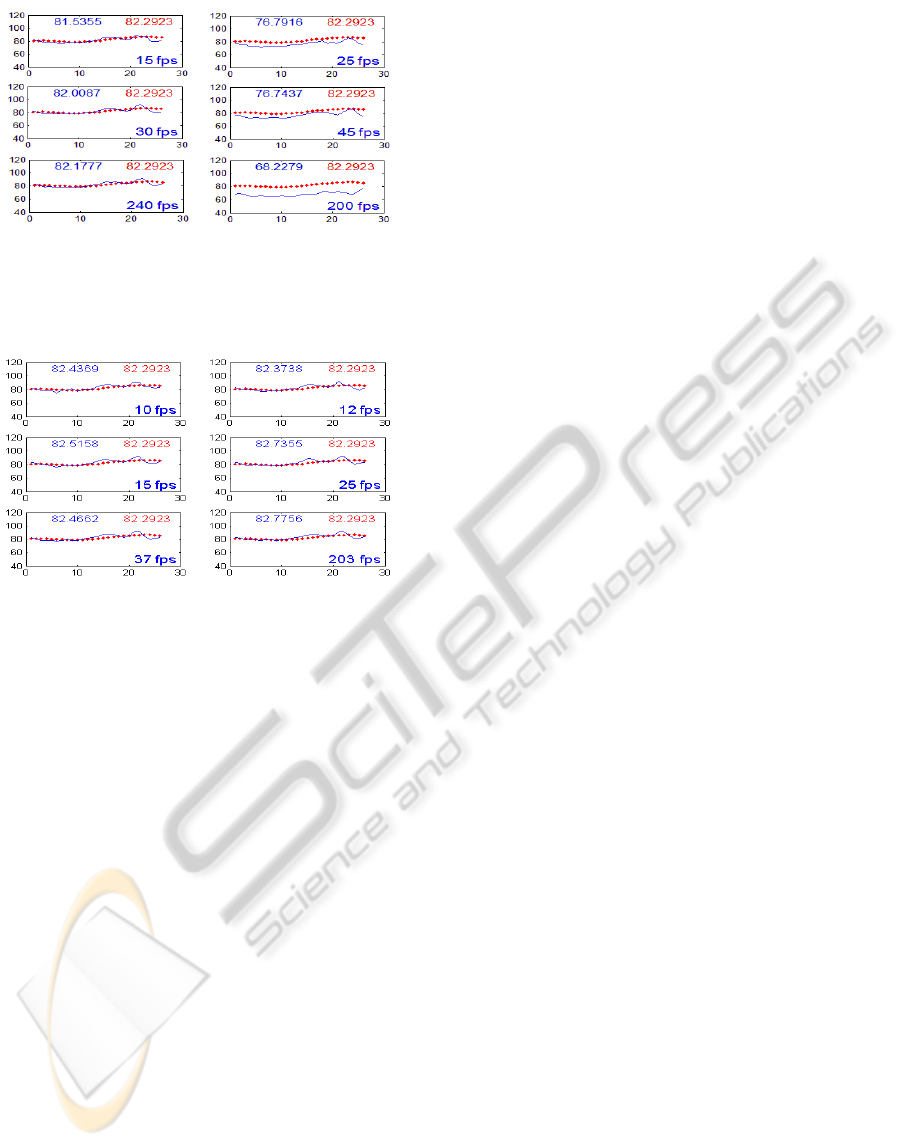
Figure 7: Results obtained from one recording resampled to
different frequencies. The dotted lines represent the ground
truth values of the heart-rate (the average value is plotted on
the right); the continuous line is given by the output of the
algorithm (the average value is plotted on the left).
Figure 8: Results obtained from the same recording as in
Figure 7 resampled to different frequencies using the near-
est neighbor approach.
4 CONCLUSIONS
In this paper we presented the results obtained by
a spectral analysis algorithm for heart-rate detection
from color video recordings of the face of a person
(both frontal view and profile).
From different tests made with our recordings, we
have noticed that the sampling frequency used for
video may affect the accuracy of the results. This in-
fluence is due both to the resampling errors and to the
noise that introduces different distortions when it is
sampled to different frequencies. In most cases, when
the resampling error was small, the frontal view ROI
gave very good results. In contrast, a high resampling
error usually led to results that were less than the real
heart-rate values. The profile ROI that we considered
in our experiments proved to be more sensitive to the
choice of the sampling frequency, but nevertheless,
as we could see in Table 2, proper values of the fre-
quency also provide good results.
From all the experiments we have done, we may
conclude that using a high sampling frequency for the
video recordings does not lead to a higher accuracy
of the results in our specific problem. The main ad-
vantage of the high speed camera over a simple web
cam does not lie in the possibility of recording more
frames per second, but in achieving a better quality of
the video, which allowed us to reduce the time length
of the window we used to compute a heart-rate value
to 5 seconds. Taking into account the computational
complexity, we consider that Fs = 25 fps is the high-
est frequency that should be used for the video record-
ings with the Pike camera.
As a future work related to the topic presented in
this paper, we intend to make new video recordings
with the Pike camera using artificial light as source
of illumination to see if it interferes and affects the
heart-rate signal extracted from ROIs with different
sizes and positions on the face.
ACKNOWLEDGEMENTS
This work was supported by the strategic grant
POSDRU/89/1.5/S/58852, Project ”Postdoctoral pro-
gramme for training scientific researchers” cofi-
nanced by the European Social Found within the Sec-
torial Operational Program Human Resources Devel-
opment 2007-2013.
REFERENCES
Allen, J. (2007). Photoplethysmography and its application
in clinical physiological measurement. In Physiologi-
cal Measurement, vol. 28, pp. R1-R39.
Cardoso, J.-F. and Souloumiac, A. (1993). Blind beamform-
ing for non gaussian signals. In IEE Proceedings-F,
vol. 140, no. 6, 362–370.
Comon, P. (1994). Independent component analysis, a new
concept? In Signal Processing, 36, 287-314.
Garbey, M., Sun, N., Merla, A., and Pavlidis, I. (2007).
Contact-free measurement of cardiac pulse based
on the analysis of thermal imagery. In IEEE
Trans.Biomed. Eng., vol. 54, no. 8, 1418 –1426.
Greneker, E. (1997). Radar sensing of heartbeat and respi-
ration at a distance with application of the technology.
In RADAR, vol. 97, no 449, 150–154.
Poh, M., McDuff, D., and Picard, R. (2010). Non-contact,
automated cardiac pulse measurements using video
imaging and blind source separation. In OPTICS EX-
PRESS, Vol. 18, No. 10.
Poh, M., McDuff, D., and Picard, R. (2011). Advancements
in noncontact, multiparameter physiological measure-
ments using a webcam. In IEEE TRANSACTIONS ON
BIOMEDICAL ENGINEERING, VOL. 58, NO. 1.
Tarvainen, M., Ranta-Aho, P., and Karjalainen, P. (2002).
An advanced detrending method with application to
hrv analysis. In IEEE Trans. Biomed. Eng., vol. 49,
no. 2, 172 –175.
TheInfluenceoftheSamplingFrequencyofaVideoRecordingonaHeart-rateDetectionAlgorithm
603
