
Cultural Differences in e-Learning Behaviour and Overall
Assessment
Clemens Bechter, Fredric W. Swierczek
and Jeerawan Chankiew
Thammasat Business School, Thammasat University, Tha Prachan, Bangkok, Thailand
Keywords: e-Learning, Cultural Adaptation, Assessment Criteria, Peer Assessment, Course Evaluation.
Abstract: The article analyses the influence of culture on e-learning behaviour in form of LMS tool usage, assessment
of peers, and post-graduate student’s grades. E-learning behaviour in this research relates to tool usage such
as email, discussion board, number of sessions, time spent etc. The analysis suggests adapting e-learning to
participants based on their culture as well as making students aware that there may be a cultural bias in
assessing their peer’s contributions. Especially European students rate their Asian peers more than 10%
lower than their European ones although the overall GPA does not differ. Europeans do better in group
assignments than Asian students especially South Asians who perform better at individual assignments in a
culturally diverse setting. The qualitative findings provide additional evidence that cultural features do have
an impact on e-learning behaviours.
1 INTRODUCTION
Hofstede’s (1991, p. 89) definition of culture as “the
collective programming of the mind that
distinguishes one group or category of people from
another” and more recently, the GLOBE project
defining culture as “shared motives, values, beliefs,
identities, and interpretations or meanings of
significant events that result from common
experiences of members of collectives that are
transmitted across generations” (House et al., 2004,
p. 230) suggest that experiences and shared values
constitute a cultural group. Researchers generally
agree that variations between groups can exist on
multiple dimensions (cognitions, behaviours, and
values). However, cross-cultural research is mainly
focused on cultural values. In contrast, this paper
focuses on behaviours in the context of e-learning.
In our paper we investigated the influence of cultural
context on online learning behaviour of executive
MBA students at an online university based in
Singapore. Seven post-graduate elective business
simulation courses with a total of 206 students from
2006 to 2010 were analysed. The average age of
students was 38 years with predominantly
engineering background who want to pursue an
MBA to further increase their management
competence. Although based in Singapore the online
university attracts a large number of South Asian
(e.g. India, Indonesia) as well East Asians (e.g
Japan, China, Taiwan) and Europeans. The seven
selected business simulation courses were taught by
the same tutor, using the same software (Markstrat
from Insead), time span of 12 weeks each, and same
weight for assignments. A mix of nationalities was
encouraged and sometimes directed by the tutor.
2 RESEARCH OBJECTIVES AND
THEORETICAL FRAMEWORK
For cross-cultural theory of E-learning at the
national level the major issue is measurement. There
are five major perspectives. The first is Hofstede
(1991) which has been the most widely used and
criticised (Hofstede et al., 2010). Related to this
perspective is Project Globe (House et al., 2004)
which followed a different approach in methodology
and sampling but with similar categories.
Trompenaars & Hampden-Turner (2004) represents
a third approach which is based on executive
participants in management development programs
answering questions about value dilemmas. The
fourth approach is the Schwartz Value Survey
(1992) which covers many countries based on
respondents who are students and teachers. Finally,
527
Bechter C., W. Swierczek F. and Chankiew J..
Cultural Differences in e-Learning Behaviour and Overall Assessment.
DOI: 10.5220/0004337805270535
In Proceedings of the 5th International Conference on Computer Supported Education (CSEDU-2013), pages 527-535
ISBN: 978-989-8565-53-2
Copyright
c
2013 SCITEPRESS (Science and Technology Publications, Lda.)
Triandis (2001) uses an individualism-collectivism
spectrum. Each approach has advantages and
disadvantages. Typically, an approach is used as a
standard measurement of a particular culture. A
more qualitative approach is the distinction between
high and low context cultures. According to Hall
(1976) East-Asia (EA, e.g. Japan) would represent a
high context culture whereas Europe (EU) a rather
low-context culture with India somewhere in
between. Higher context cultures generally have a
stronger sense of group orientation, seniority,
unspoken rules, and tradition. In Hofstede’s (1991)
and Trompenaars (2004) classification systems,
South-Asia (SA) would be somewhere between EA
and EU.
Swierczek and Bechter (2008) amalgamated and
applied these approaches to e-learning, see Table 1,
demonstrating that High Context cultures show a
more a ‘wait and see’ reactive mode. Low Context
learner cultures show higher volume, less depth and
can be considered as more provocative and
innovative.
Table 1: Features of High vs. Low e-learning cultures.
High Context (East-Asian) Low Context (European)
Introvert
Modest
Reactive
Reflective
Natural
Reads First
Data Focused
High Frequency
Group oriented
Team Harmony
Deduction
Share knowledge within
group
Tutor as Leader
Extrovert
Superior
Active
Thinks outloud
Exaggerated
Posts First
Monologue Dominant
High Involvement
Individual Achievement
oriented
Critical Peer evaluation
Induction
Share knowledge openly
Tutor as Facilitator
The purpose of the study is to analyse culture
related e–learning behaviour and its outcome.
The research questions are:
1.
What is the relationship between a culture like
South-Asia (SA), Europe (EU) or East-Asia
(EA) on e-learning behaviours?
2.
Does culture influence e-learning?
3.
Is it possible to design an e-learning approach
which is compatible with different cultures?
The objectives of this research:
1. To assess e-learning behaviours of post-
graduate students.
2. To determine the influence of cultural values
on e–learning behaviours.
3. To identify the impact of culture on e-learning
activities.
4. To compare peer assessments of participants
working together with student colleagues from
different cultures.
5. To propose a multi-culturally compatible
approach to e-learning design.
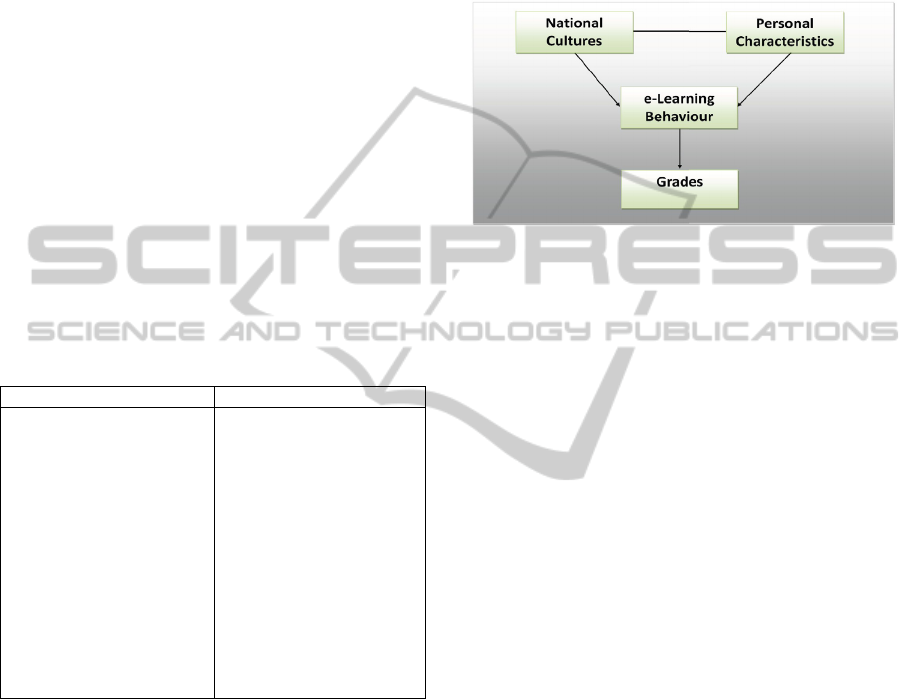
Figure 1: Research Framework.
The paper is structured in the way that overall
assessments for students and tutor will be analysed
in a first step. In a second step student online
behaviour (input) and grades (output) split by
cultural group will be compared. Included in the
grade analysis is a comparison of peer assessment
grades followed by relative success of cultural
regions in group vs. individual assignments. In line
with a mixed method approach (Creswell, 2009)
some quotes from online discussions are provided.
To test the hypothesis that there are cultural
differences a second, purely quantitative, approach
was used by grouping of students (clustering) along
major e-learning behavioural dimensions (factors).
Finally, results of both approaches were compared
and recommendations given.
3 FINDINGS
3.1 Overall Assessment
The overall assessment grade (GPA) consisted of
seven components. Discussion Board (DB)
contributions accounting for 30%, two case studies
(GA) 30%, final project (FP) 15% and final exam
25%. The case studies did not differ in complexity
but were replaced by more current ones every two
years. Case studies and final project (summary of the
key learning points of the simulation game) were
group assignments with team sizes ranging from five
to seven participants.
CSEDU2013-5thInternationalConferenceonComputerSupportedEducation
528

Table 2: Overall assessment and its components.
N Mean
Std.
Deviation
GA_1 205 82.93 14.525
GA_2 206 83.04 14.581
FP 206 82.71 12.708
DB_1 206 84.76 11.565
DB_2 206 84.41 12.942
DB_3 206 81.85 14.089
Final Exam 206 77.13 13.596
GPA 206 81.54 10.085
Valid N 205
Grades ranged from 0 to 100, average see Table
2. Final exam score is below other assessment
criteria which could be related to exam phobia or
time pressure or tutor related by not advising
students what was expected. The grades for online
participation on the Discussion Board (DB) declined
slightly toward the end of the course: DB_1: week 1-
4; DB_2: week 5-8; DB_3 week 9-12. The two
group assignments (GA_1 & GA_2) took place in
the first eight weeks whereas the final project (FP)
was due at the end of the course, shortly before the
final exam. The GPA is relatively high which may
be due to the fact that this was an elective course.
Whereas individual assignments were solely graded
by the tutor, the group assignments had a peer
assessment component whereby each student was
asked to rate team colleague’s contributions on a
scale 1-5.
Students were asked to evaluate subject content
(25 questions) and tutor (22 questions) upon
completion of the course. Table 3 shows the
averages of five selected questions on a scale 1-5:
S_A4. The various learning tools were used
effectively (e.g. discussion boards, self-assessment
exercises, instant messenger, webinar).
S_B7. The case studies and final project selected
for this subject were useful for my learning needs.
S_C3. The ratio of individual to team
assignments was appropriate.
S_E1. Overall, how would you rate the quality of
your learning in this subject?
T_D1: Overall, how would you rate the
performance of the professor in this subject?
The four subject related (S_) items as well as
overall tutor satisfaction (T_) was high. For obvious
reasons it is not possible to make the link between
individual evaluation and a particular student;
otherwise the tutor may penalise that student in
courses to come (Table 3).
Table 3: Course evaluation by students.
N Mean Std. Deviation
S_A4 206 4.30 0.881
S_B7 206 4.47 0.689
S_C3 206 4.36 0.751
S_E1 206 4.46 0.645
T_D1 206 4.51 0.703
Valid N 206
There is a significant high correlation between
perceived quality of learning and tutor performance
which indicates that a student who ‘likes’ the tutor
may also like the subject and vice versa, see Table 4.
Table 4: Correlation between Subject and Tutor
satisfaction.
S_E1 T_D1
S_E1 Pearson
Correlation
1.000 .851
**
Sig. (2-tailed) .000
N 206.000 206
T_D1 Pearson
Correlation
.851
**
1.000
Sig. (2-tailed) .000
N 206 206.000
**. Correlation is significant at the 0.01 level (2-tailed).
This should be taken into consideration when
assessing a tutor’s performance based on students’
evaluations as many universities nowadays do. For
example, the Singaporean university in question will
not renew contracts if the overall evaluation falls
short of 4.2 which may be caused by teaching a less
exiting subject or the pedagogical performance of
the tutor. As above evaluation shows, students were
generally satisfied with subject and tutor which may
be a result of their active learning behaviour.
3.2 Learning Behaviour
The business simulation course consisted of 160
SCORM modules. Blackboard served as LMS with
readily available statistics such as:
Number of session during the 12 week course
Total Time spent
Number of eMails read
Number of eMails sent
Number of DB posts read
Number of DB replies posted
Number of times the (LMS internal) organizer
with upcoming events/deadline was viewed
Peer assessment scores and Grades
Most of the behavioural input factors correlate
positively with the GPA. Students that engage via
email or discussion board are more successful. The
CulturalDifferencesine-LearningBehaviourandOverallAssessment
529

Table 5: Correlations: Input vs. Overall Assessment Grade (GPA).
Pearson
Correlation Sessions
Total
Time Mail_Read Mail_Sent DB_Read DB_Posted SCORM Organiser GPA
ssions .467
**
.209
**
.312
**
.479
**
.453
**
.631
**
.146
*
.397
**
Total Time .467
**
.111 .144
*
.226
**
.386
**
.389
**
-.109 .330
**
Mail_Read .209
**
.111 .660
**
.055 -.022 .187
**
.056 .171
*
Mail_Sent .312
**
.144
*
.660
**
.165
*
.131 .166
*
-.001 .224
**
DB_Read .479
**
.226
**
.055 .165
*
.294
**
.161
*
.062 .178
*
DB_Posted .453
**
.386
**
-.022 .131 .294
**
.138
*
.026 .379
**
SCORM .631
**
.389
**
.187
**
.166
*
.161
*
.138
*
.194
**
.274
**
Organiser .146
*
-.109 .056 -.001 .062 .026 .194
**
-.042
GPA .397
**
.330
**
.171
*
.224
**
.178
*
.379
**
.274
**
-.042
** Correlation is significant at the 0.01 level (2-tailed).
* Correlation is significant at the 0.05 level (2-tailed).
only tool that did not contribute to the success was
the organizer; viewing deadlines doesn’t seem to
constitute a high performing student. On the
contrary, it correlates slightly (but non-significantly)
negatively, see Table 5. Organizer is a typical
‘uncertainty avoidance’ parameter.
Table 5 suggests that e-learning behaviour
component correlate i.e. a student spending a lot of
time online is also more active and gets a better
grade than not so active ones. There is a high
correlation between mail read and sent as well as DB
posted and read which may indicate a preference for
a specific communication tool.
3.2.1 Cultural Differences
At first sight there seem to be no significant
differences between East-Asian (EA) students,
Europeans (EU) and South-Asians (SA). Numbers of
sessions as well as average grades (GPA) are
similar, see Table 6, and do not differ significantly.
Table 6: Overall Sessions and GPA.
Nationality N Mean Std.
Deviation
EA Sessions 75 147.65 77.509
GPA 75 81.35 10.732
EU Sessions 32 144.41 93.429
GPA 32 81.70 11.541
SA Sessions 99 142.53 78.528
GPA 99 81.64 9.143
Given that a course lasts for 12 weeks it can be
concluded that on average a student logs in around 1
½ times per day; more realistically, once per
working day and 5 times over the weekend because
they were executive students.
Despite an overall similar picture, we see
behavioural differences when comparing cultural
regions in more detail. Differences between EA
(East-Asians) and SA (South-Asians) and EU
(Europeans) that were significant at 0.05 levels are
highlighted in italics, see Table 7.
Table 7: e-Learning behaviour by culture.
Nationality N Mean Sig.
Mail_
Read
EA 75 48.8
SA 99 50.47
Yes, vs.
EA
EU 32 53.16
Yes, vs.
EA
Mail_
Sent
EA 74 6.18 no
SA 99 7.36 no
EU 32 10.53 no
DB_
Read
EA 75 4707
SA 99 7264
Yes, vs.
EA
EU 32 8240
Yes, vs.
EA
DB_
Posted
EA 75 101
SA 99 102
EU 32 157
Yes, vs.
EA & SA
SCORM EA 75 204 no
SA 99 191 no
EU 32 181 no
Organiser EA 75 7.21 no
SA 99 7.51 no
EU 32 8.19 no
SA and EU read more mails and more DB posts.
Given the fact that each student posts around 100
replies on the DB and on average there are 40
students per class, we can expect around 4000 DB
postings per course. This means that EA view a post
more or less once whereas their SA counterparts
CSEDU2013-5thInternationalConferenceonComputerSupportedEducation
530

view some post at least twice. EU were the most
active group in DB postings which didn’t translate
into a better DB grade, see Table 8.
Table 8: Grade Component Differences by Culture.
Nationality N Mean Sig.
GA_1 EA 75 82.79
SA 98 81.49
EU
32 87.66 Yes, vs.
EA & SA
GA_2 EA 75 82.55
SA 99 82.24
EU
32 86.66 Yes, vs.
EA & SA
FP EA 75 81.41 No
SA 99 83.48 No
EU 32 83.38 No
DB_1 EA 75 86.39 No
SA 99 84.10 No
EU 32 83.00 No
DB_2 EA 75 83.15 No
SA 99 84.68 No
EU 32 86.56 No
DB_3
EA
75 81.67 Yes, vs.
EU
SA
99 83.63 Yes, vs.
EU
EU 32 76.81
Exam EA 75 76.64 No
SA 99 77.99 No
EU 32 75.59 No
An explanation could be that EA’s and SA’s
postings show more substance and EU are more
frequent but shallower. Whereas emails do not form
part of the grade, DB contributions do. An extensive
list with evaluation criteria was provided prior to the
course to eliminate a subjective judgement as much
as possible.
After analysing the behavioural input (Table7),
what tools were used, we looked at the grade in
more detail (Table 8). We have seen in Table 6 that
the overall grade did not differ significantly between
EA, EU, and SA. Looking at the grade
components/criteria, however, there are three
differences, see Table 8.
EU students seem to take it relatively easier with
DB contributions toward the end of the term (DB_3:
week 9-12) whereas their Asian counterparts
maintain their high level of activity throughout the
course.
3.2.2 Peer Assessment
Peer assessment is essential part of collaborative
learning.
Table 9: Peer Assessment.
Assessment
Criteria
Name Team members (initials)
GJ FC BW JA MS
Collection of
data
Goh J
5 5 5 3 3
Foo C
3 3 4 4 4
Bob W
3 3 4 5 4
Joy A
4 4 5 5 5
Muthu S
4 4 5 5 5
Data analysis
Goh J
5 4 5 4 3
Foo C
3 2 3 4 2
Bob W
3 3 5 5 4
Joy A
4 4 5 5 5
Muthu S
4 4 5 5 5
Co-ordination
and writing of
submission
Goh J
5 5 4 3 3
Foo C
2 4 5 2 4
Bob W
3 3 5 4 4
Joy A
4 4 5 5 5
Muthu S
4 4 5 5 5
Overall quality
of input
(creative ideas,
insights)
Goh J
5 4 4 3 3
Foo C
3 3 4 5 4
Bob W
3 3 4 5 4
Joy A
4 4 5 5 5
Muthu S
4 4 5 5 5
Overall
contribution
to the efficient
functioning of
team
Goh J
5 5 5 3 3
Foo C
3 2 4 5 4
Bob W
4 4 5 5 4
Joy A
4 4 5 5 5
Muthu S
4 4 5 5 5
After each group assignment including the final
project students were asked to rate anonymously
their peers on 5 categories, see above Table 9, from
1-5. The peer assessment accounts for around 25%
of the group assignment grade. Because we
hypothesized that groups from the same culture will
rank their peers higher than from other cultures we
calculated three different peer scores.
In Table 9 we see peer scores of 5 students:
Goh J: EA
Foo C: EA
Bob W: EU
Joy A: SA
Muthu S: SA
To calculate the Peer_other (culture) score for
Goh (the average score s/he gave to peers, not the
one s/he received) we will not consider Foo because
s/he is from the same culture, instead only the two
SA and one EU team member will be considered.
For Peer_own only Foo would qualify. Peer_score
gives the average score this person gave to all team
members.
We can see that EU and SA give similar scores
between 4.1 and 4.3 to students sharing the same
cultural background but drop if they evaluate
students from another cultures; especially the EU
gap is significantly high (4.289 vs. 3.747).
CulturalDifferencesine-LearningBehaviourandOverallAssessment
531

Table 10: Peer Score.
Nationality N Mean Std.
Deviation
Peer_score EU 32 4.018 0.571
SA 99 4.006 0.522
EA 75 4.040 0.540
Peer_own EU 32 4.289 0.454
SA 99 4.113 0.566
EA 75 4.230 0.560
Peer_other EU 32 3.747 10.328
SA 99 3.899 0.517
EA 75 3.860 0.540
The results confirm that there is a cultural bias in
peer assessment which may be down to the fact that
one relates more easily to the own culture. A similar
pattern can be found on DB where students tend to
reply to postings made by same culture students
more frequently than others. One could argue that it
is difficult, for example, for an Indian to relate to
Haier as for a Chinese to Amul and more engaging
the other way round.
3.2.3 Group vs. Individual Assignments
Looking at the grades, SA performed 1.59% better
than average in the final project (FP) and EA 1.25%
better in the GAs. A minus sign indicates a tendency
to the left (GA) and a plus sign to the right (FP), see
Table 11. EA preferred group assignments, whereas
SA preferred Individual assignments. Both, GA and
FP are group assignments but at a different level.
GA covered case studies whereas the FP was far
more team oriented in form of a simulation game.
Quite often students split case study tasks getting
close to becoming an individual assignment.
GroupvsIndi measured the different performance
between team work (GA, FP) and truly individual
assignments (3 DBs, final exam). Only SA
performed better at individual assignments. Pramila
(2011) came to similar conclusions that Indian
students are more individualistic and less group-
oriented which would bring them closer to low
context cultures.
Table 11: Group vs. Individual Assignment.
Nationality N Mean Std.
Deviation
GAvsFP SA 99 1.586 11.466
EA 75 -1.253 11.517
EU 32 3.000 14.870
GroupvsIndi SA 99 0.210 5.536
EA 75 -0.290 7.657
EU 32 -5.400 16.440
Surprisingly, Europeans tend toward group
assignments. The values in above tables do not
represent perceptions or likeability, instead they
stand for the relative success, expressed as grade
points (range from 0 to 100), between various forms
of formal assessments. One reason could be that
Europeans take the initiative and volunteer to
become team leaders. A study by Klein (2012) has
shown that successful teams have a strong leadership
and delegate tasks; similar to this study a computer
game/simulation was analysed. Sometimes EU
students were frustrated by the slow pace of
reaching a (for high context cultures typical)
consensus and took things in their own hands (Table
12).
Table 12: Sample DB Postings.
EU: Lets get started with the activity, before we run
out of time.
EA_1: From a suggestion made by Prof, I have
purchased all the market research studies.
EA_2 Thanks! Please go ahead.
SA_1: My relocation got me really tied up. Moved from
Egypt to UAE after 9 years. Tough call. Ready to
contribute and will from now.
EU: Team, Any update... we have to make decision
by midnight today for next round.
EA_2: I doubt anyone has the time to do a thorough
analysis of the results from period 1. I have made
some simple observations:…
SA_2: Guys, We missed tdy's deadline to upload next
decision on Markstrat. Need to ensure that we do
our best fr next round..
EU: The way we have been doing this is quite
disorganized and without directions…
SA_1: Logging in.
EU: Hi team, I have initiated 2 R&D projects: …
Table 12 demonstrates that the EU student shows
leadership whereas EA_1 tries to avoid uncertainty
(another feature of high context cultures) and gets
reconfirmed by EA_2. Both EAs including the one
SA do not move things forward; they rather take a
‘wait and see’ attitude. Finding themselves in the
diver seat may challenge EU students resulting in
better grades in group than individual assignments.
Language proficiency could be another reason.
3.2.4 Grouping across Cultures
We have seen that culture has an impact on e-
learning behaviour and learning success. However,
even within a culture differences can exist; a person
from one culture can be closer to another culture
than its own. To analyse the proximity of students in
the sample a cluster analysis was conducted.
CSEDU2013-5thInternationalConferenceonComputerSupportedEducation
532
To reduce the number of dimensions a factor
analysis was applied beforehand, resulting in 3
major dimensions, see Table 13.
Table 13: Rotated Component Matrix.
Factor
Time eMail Organizer
Sessions .798 .231 .341
Total Time .747 .093 -.133
DB_Posted .716 -.066 -.096
DB_Read .590 .048 .099
Mail_Read -.005 .915 .073
Mail_Sent .160 .887 -.021
Organiser -.086 -.034 .894
SCORM .523 .188 .527
Extraction Method: Principal Component Analysis.
Rotation Method: Varimax with Kaiser Normalization.
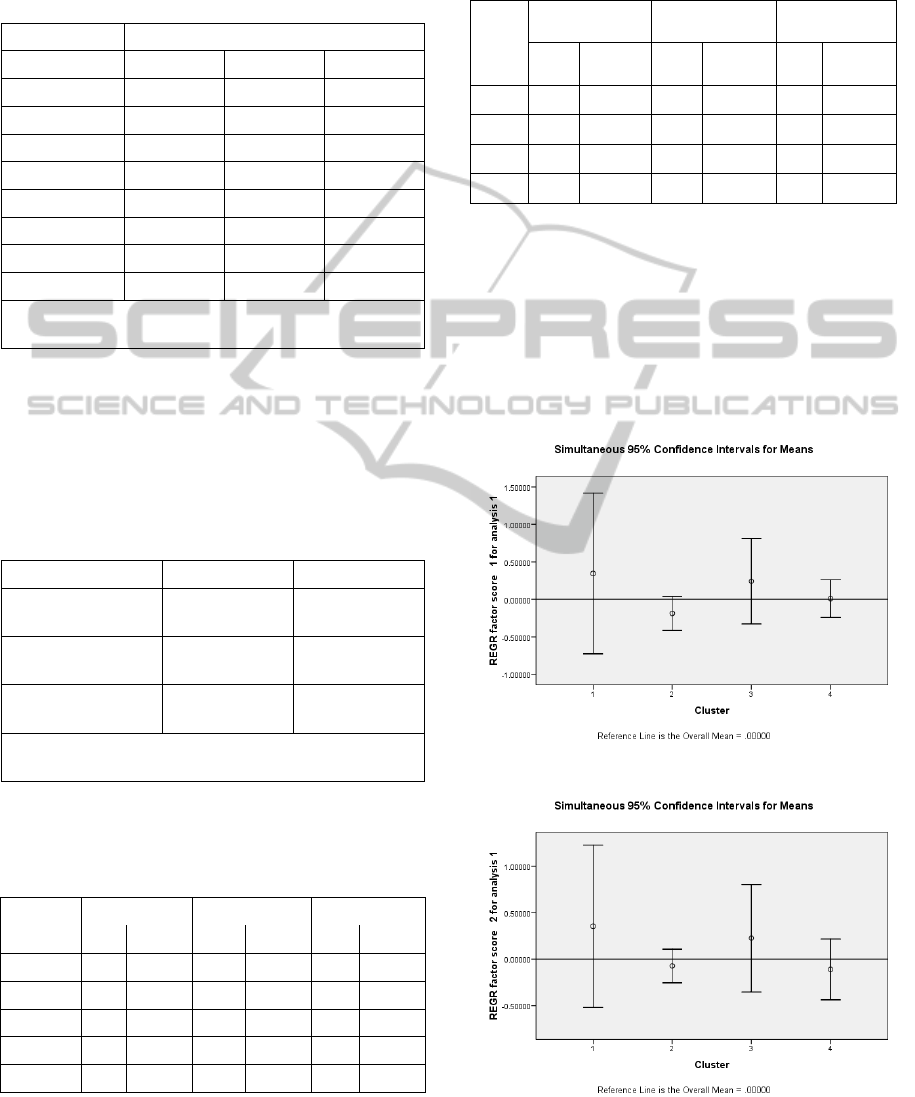
Factor 1 is the most important dimension and can
explain 29.5%, Factor 2 21.6% and Factor 3 14% of
variance. Along these 3 dimensions a subsequent
clustering of students was conducted. Whereas
Factor 1 and 2 correlate positively with the GPA,
Factor 3 does not, see Table 14.
Table 14: Correlations between Factors and GPA.
GPA
REGR factor score 1 Pearson
Correlation .440
**
REGR factor score 2 Pearson
Correlation .176
*
REGR factor score 3 Pearson
Correlation -0.004
**Correlation is significant at the 0.01 level (2-tailed).
*Correlation is significant at the 0.05 level (2-tailed).
A cluster analysis based on the three factors
resulted in 4 distinct groups (Table 15).
Table 15: Cluster by Nationality.
Cluster EA EU SA
Freq. Percent Freq. Percent Freq. Percent
1 (SA) 1 1.4% 0 .0% 18 18.2%
2 (SA) 0 .0% 0 .0% 81 81.8%
3 (EU) 0 .0% 32 100.0% 0 .0%
4 (EA) 73 98.6% 0 .0% 0 .0%
Combined 74 100.0% 32 100.0% 99 100.0%
Cluster 1 is dominated by SA, cluster 2 also by
SA, cluster 3 by EU and cluster 4 by EA. This
confirms that there are cultural differences in e-
learning behaviour; Cluster centroids, see Table 16.
Table 16: Centroids.
Cluster
REGR factor
score 1
REGR factor
score 2
REGR factor
score 3
Mean
Std.
Deviatio
n
Mean
Std.
Deviation Mean
Std.
Deviatio
n
1
0.344 1.68 0.353 1.37 1.95 1.48
2
-0.19 0.793 -0.07 0.637 -0.34 0.429
3
0.241 1.21 0.226 1.23 -0.23 1
4
0.011 0.833 -0.11 1.08 -0.03 0.691
Because the standard deviations are very high the
confidence intervals are also very broad. Figure 2
illustrates the means and intervals for all 4 clusters
on Factor 1. Only Figure 4, the organizer dimension,
shows non-overlapping confidence intervals.
However when looking at Table 13 it shows that
Factor 3, viewing the organizer tool, does not
correlate with the GPA, confirming its non-
significance to overall assessment.
Figure 2: Factor 1 group means.
Figure 3: Factor 2 group means.
CulturalDifferencesine-LearningBehaviourandOverallAssessment
533
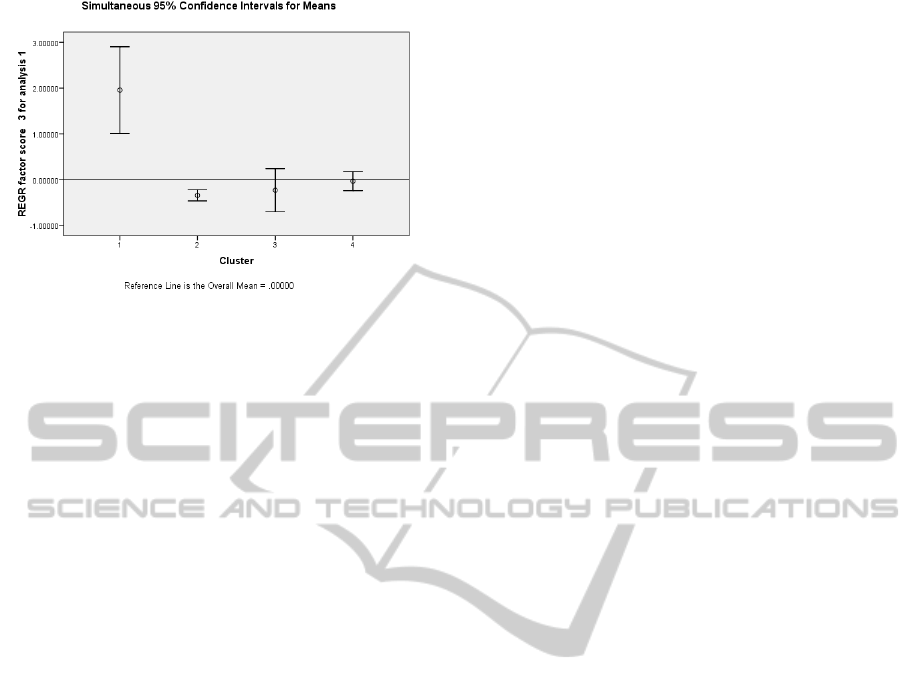
Figure 4: Factor 3 group means.
Both, cluster 1 and 2 consisted mainly of South-
Asian students whereas cluster 1 was more active
than cluster 2. Since both share the same cultural
background other reasons must exist why there is a
difference. In a further step the executive student’s
educational background, age group, current location
(domestic or expat), and job were analysed. It was
found that in the more active cluster 1 there were
significantly more SA working abroad as expats or
either having their own business or planning to have
and were on average 4 years younger. In most cases
the first two attributes exclude each other; either a
person is working as expat for a company or is
running his/her own business domestically. Whereas
one can easily understand that a business owner’s
intrinsic motivation to study may be higher than a
normal employee, the fact that expats perform better
is not that obvious. Their job and family demands
are usually higher than those working in their home
country. Therefore, one would expect that they have
less time to study. Possible reasons why they
perform better could be: rigid time management,
high motivation, and fewer distractions. Many of
Cluster 1 (Indian) students were working in the
Middle East especially UAE. Combined with the
fact that they are younger and therefore likely to be
more career-oriented may make them better
performing students. Whether a student just started
or was close to the end of the programme made
another significant difference. Students had to take
16 courses plus a Master Thesis in form of a project.
Because the analysed course was an elective it could
be taken as 5
th
course earliest and as late as 16
th
.
More experienced SA students having at least done
10 courses performed significantly better than
students taking it as 5
th
until 9
th
. It seems that there is
a learning curve and maybe a motivational push
toward the end of the programme to improve the
final GPA.
4 CONCLUSIONS
We demonstrated that cultural differences in e-
learning behaviour, assessment grade components,
and peer assessment exist. A major issue in e-
learning is whether the trend will be to greater
convergence or more divergence (Edmundson,
2006). Greater convergence would mean e-learners
worldwide are becoming more similar. More
divergence would signify that e-learners are more
likely to be significantly different (Blanchard and
Allard, 2010). This study provided support for the
divergence trend. One size will not fit all. Course
design will need to be more adaptive not more
generalisable. Unfortunately most e-learning courses
have been designed by Westerners, including the
analysed courses at the Singaporean university.
However, the fastest-growing markets are non-
Western: China and India.
5 IMPLICATIONS
Make students aware that there is a cultural bias.
Encourage EA to take the lead in group assignments.
Encourage SA to pull their weight in group
assignments.
Make students aware that viewing the organizing
tool reflects uncertainty avoidance but does not give
a better grade.
Stress DB assessment criteria to EU to achieve
more substance and less quantity.
Encourage students working as expats or
planning to start their own business to share their
experiences with others and serve as role model.
Further research in form of longitudinal studies
(Goda & Mine, 2011) should take the behavioural
changes over time into account as well as the impact
of foreign exposure such as working as expat.
REFERENCES
Blanchard, E. G., Allard, D. (2010). Handbook of
Research on Culturally Aware Information
Technology: Perspectives and Models. Hershey, PA:
Information Science Publishing.
Creswell, J. W. (2009). Mapping the field of mixed
methods research, Journal of Mixed Methods
Research, 3(2): 95-108.
Edmundson, A. (2006). Globalized E-Learning Cultural
Challenges, IGI Global Information Science
Publishing, Hershey: PA, U.S.A.
CSEDU2013-5thInternationalConferenceonComputerSupportedEducation
534

Goda, K., Mine, T. (2011). PCN: Quantifying Learning
Activity for Assessment based on time-series
comments, in: Alexander Verbraeck; Markus Helfert;
José Cordeiro & Boris Shishkov, ed., 'CSEDU (2)',
SciTePress, pp. 419-424 .
Hall, E. T. (1976). Beyond Culture, New York:
Doubleday.
Hofstede, Geert, Hofstede G. J. & Minkov M. (2010).
Cultures and Organizations: Software of the Mind,
New York: McGraw-Hill U.S.A.
Hofstede, G. (1991). Cultures and Organizations:
Software of the mind, New York: McGrawHill.
House, R. J., Hanges, P. J., Javidan, M., Dorfman, P. W.
& Gupta, V. (eds). (2004). Culture, Leadership and
Organizations: The GLOBE Study of 62 Societies,
Sage: Thousand Oaks, CA.
Klein, J. (2012). Individual and group performance of
computerized educational tasks, Education and
Information Technologies. DOI 10.1007, Springer.
Pramila, R., (2011). E-Learning in India: The Role of
National Culture and Strategic Implications,
Multicultural Education & Technology Journal, 5(2),
129-150.
Schwartz, S. (1992). Universals in the Content and
Structure of Values, in M-Zanna (ed), Advances in
Experimental Psychology. San Diego: Academe press.
Swierczek, F. & Bechter, C. (2008). Cultural Features of
E-Learning: A Euro-Asian Comparison, In Learning
and Instruction in the Digital Age. CELDA
Conference.
Triandis, H. C. (2001). Individualism-collectivism and
personality. Journal of Personality, 69(6): 907–924.
Trompenaars, F & Hampden-Turner, C. (2004). Managing
People Across Cultures, Chi Chester: Capstone.
CulturalDifferencesine-LearningBehaviourandOverallAssessment
535
