
Near Infrared Broadband Emission and Spectroscopic Properties
of Tm
3+
/Nd
3+
Codoped Optical Fiber
Lin Htein
1
, Pramod R. Watekar
2
, Weiwei Fan
3
, Seongmin Ju
3
,
Bok Hyeon Kim
4
and Won-Taek Han
1,3
1
Department of Photonics and Applied Physics, Gwangju Institute of Science and Technology,
Gwangju 500-712, South Korea
2
Sterlite Technologies Limited, Waluj, Aurangabad 431136, India
3
School of Information and Communications, Gwangju Institute of Science and Technology,
Gwangju 500-712, South Korea
4
Advanced Photonics Research Institute, Gwangju Institute of Science and Technology,
Gwangju 500-712, South Korea
Keywords: Broadband Fiber Laser, Codoped Optical Fiber, Energy Transfer, Near Infrared Emission, Nd
3+
, Tm
3+
,
Spectroscopic Properties.
Abstract: The emission bands at 934, 1083, 1279, 1362, 1414 and 1720 nm were found to appear from the Tm
3+
/Nd
3+
codoped optical fiber upon excitation at 633 nm. Near infrared emissions of Tm
3+
at 1279, 1414 and 1720
nm confirmed a very efficient energy transfer (ET) between Tm
3+
and Nd
3+
ions. Since the emission band of
Nd
3+
at 1362 nm helped to bridge the wavelength gap between the emission peaks of Tm
3+
at 1279 and 1414
nm, the ET process made the Tm
3+
/Nd
3+
codoped fiber applicable in broadband fiber laser operating around
1215–1515 nm. Further, cross-sections for the respective bands, spectroscopic properties and nonlinear
characteristics of the Tm
3+
/Nd
3+
codoped fiber were investigated.
1 INTRODUCTION
Because of the impact of wavelength division
multiplexing (WDM) telecommunication systems,
broadband light source and broadband amplifier
have been received growing attention in world-wide
optical communication (Tanabe, 2002). Nonetheless,
rare-earth (RE) ions, so widely used as laser-active
media in optical fiber, commonly have narrow
absorption and emission bands arising from the
parity-forbidden 4f-4f transitions (Zabicky, 2009). In
order to broaden the emission bandwidth, the most
attractive method is that RE ions are codoped into
the core of the fiber where the energy transfer (ET)
process takes place between different species of ions
(Tanabe, 2002). Moreover, such ET process favours
emission efficiency and enhances the gain of an
amplifier (Brandão et al., 2006).
The present work, codoping Nd
3+
as a sensitizer
for Tm
3+
in the core of the fiber, was concerned with
the needs of broadband fiber laser and amplifier for
future optical communication. The motivation for
our investigation was that the emission of Nd
3+
around 1340 nm can fill the wavelength gap
complementing the emission of Tm
3+
in short
wavelength band (S-band, 1460–1530 nm) (Shen et
al., 2002). Moreover, since two excited levels, i.e.,
Nd
3+
:
4
F
3/2
and Tm
3+
:
3
H
4
, are well matched (Tanabe
et al., 2000), the ET process is likely to occur and
the lifetime of the Nd
3+
at
4
F
3/2
level is long enough
to induce efficient ET. And, the large absorption
cross-section of Nd
3+
around 600 nm provides
powerful absorption for effective pumping with
commercially available lasers (Zhang et al., 2010).
Although the enhancement of upconversion
emission efficiency by using Nd
3+
as a sensitizer for
Tm
3+
(Rakov et al., 2009); (Rakov et al., 2002) and
the ET process between them (Brandão et al., 2006);
(Chung and Heo, 200); (Lahoz et al., 2008); (Tanabe
et al., 2000) were reported in different host
materials, no broadband near infrared (NIR)
emission of Tm
3+
/Nd
3+
codoped silicate optical fiber
was investigated. In this study, a wide range of NIR
emission spectrum broadening from 1215 to 1515
nm with FWHM of 158 nm has been studied in
Tm
3+
/Nd
3+
codoped fiber upon exciting at 633 nm.
25
Htein L., R. Watekar P., Fan W., Ju S., Hyeon Kim B. and Han W..
Near Infrared Broadband Emission and Spectroscopic Properties of Tm3+/Nd3+ Codoped Optical Fiber.
DOI: 10.5220/0004338200250032
In Proceedings of the International Conference on Photonics, Optics and Laser Technology (PHOTOPTICS-2013), pages 25-32
ISBN: 978-989-8565-44-0
Copyright
c
2013 SCITEPRESS (Science and Technology Publications, Lda.)

Further, the spectroscopic parameters of the
Tm
3+
/Nd
3+
codoped fiber was determined by
applying the Judd-Ofelt (JO) analysis. Furthermore,
cross-sections for the respective bands were
investigated and consequently its nonlinear optical
properties were elucidated.
2 EXPERIMENTAL
Silicate glass-based optical fibers: Tm
3+
/Nd
3+
codoped fiber, Tm
3+
doped fiber and Nd
3+
doped
fiber, were drawn from the preforms fabricated by a
modified chemical vapour deposition (MCVD)
process. The rare earth ions were incorporated into
the core of the preforms using conventional solution
doping method. The optical parameters of the fibers
are listed in Table 1.
Table 1: The optical parameters, viz., refractive index
difference between the core and the cladding (∆n), core
diameter (d) and cutoff wavelength (λ
c
), of the Tm
3+
doped, the Nd
3+
doped and the Tm
3+
/Nd
3+
codoped optical
fibers.
Fiber name
Concentration
(M%)
n
d
(m)
λ
c
(m)
T
m
3+
doped 0.03 of Tm 0.0020 7.20 0.79
Nd
3+
doped 0.03 of Nd 0.0051 8.44 1.34
T
m
3+
/Nd
3+
codope
d
0.10 of Tm
0.05 of Nd
0.0039 7.52 1.25
The absorption spectra of the fibers were measured
by the cutback method using optical spectrum
analyzer (OSA) and white light source. To measure
emission spectrum, the fibers were excited by a He-
Ne laser (Melles Griot 9132EW-1) operating at 633
nm and the spectral output power was detected by an
OSA. The fluorescent lifetime of the Tm
3+
/Nd
3+
codoped fiber was detected by an InGaAs photo-
detector, while
4
F
3/2
level of Nd
3+
was excited by a
cw-Ti:sapphire laser (Mira-900, Coherent) operating
at 800 nm.
To determine the nonlinear optical parameters,
wavelength dependence of refractive indices of the
Tm
3+
/Nd
3+
codoped fiber preform was measured by
using a prism coupler (Sairon: SPA-4000). To avoid
unnecessary measurement error due the relatively
small core of the fiber preform (0.97 mm), the
obtained refractive index results were compared
with those of the GeO
2
doped SiO
2
glass, whereas
both have GeO
2
concentration of nearly 3.1 M%
(Kobayashi et al., 1977); (Kobayashi et al., 1978).
Note that the refractive indices were taken by
assuming that effect of Tm
3+
and Nd
3+
on them is
negligible due to their low concentrations.
3 THEORY
The measured line strength of the selected band can
be determined by (Judd, 1962):
32 22
3(2 1) 9
()
8(2)
med
eapk
ch J n
SJJ
eN n
(1)
where J and J´ are the total angular momentum
quantum numbers of initial and final states,
respectively. c, h, n,
peak
, e, N and Γ are the velocity
of light, the Plank constant, the refractive index of
glass, the peak absorption wavelength, the charge of
the electron, the ion concentration and the integrated
absorption coefficient, respectively.
Then, the calculated line strength, which depends
on three parameters known as the JO parameters
(
t
, t = 2, 4, 6), is defined as:
(2,4,6)
2
()
() .
t
t
cal t
SJ J JUJ
(2)
In our calculations,
2
()t
J
UJ
, the value of the
double reduced matrix elements, was taken from
Carnall et al. (Carnall et al., 1968). The radiative
transition probability (A), the radiative lifetime (
r
)
and the fluorescence branching ratio () are
described as:
42 2 2
3
64 ( 2)
() (),
3(21)9
cal
peak
enn
A
JJ SJJ
hJ
(3)
1
()
r
AJ J
and
(4)
()
()
()
.()
r
AJ J
JJ AJJ
AJ J
(5)
The emission cross-sections were determined by the
Fuchtbauer-Ladenburg (FL) relation (Aull and
Jenssen, 1982); (Fowler and Dexter, 1962); (Krupke,
1974) using the radiative parameters and the
effective line width (∆λ
eff
) as follows:
4
2
.
8
peak
epeak
eff
A
JJ
cn
(6)
The nonlinear optical parameters, viz., Abbe number
(
e
), nonlinear refractive index (n
2
), nonlinear
PHOTOPTICS2013-InternationalConferenceonPhotonics,OpticsandLaserTechnology
26
refractive index coefficient (γ) and susceptibility (χ),
were evaluated by the following equations (Boling
and Glass, 1978); Milam and Weber, 1976); (Weber
et al., 1983):
1
,
e
e
f
c
n
nn
(7)
22
2
2
68( 1)( 2)
,
(2)(1)
1.517
6
ee
e
ee
e
e
nn
n
nn
n
(in 10
-13
esu)
(8)
3
2
410 ()
e
ncn
(in m
2
/W) and
(9)
2
0
4
3
e
cn
(in m
2
/ V
2
)
(10)
where n
e
, n
f
and n
c
are the refractive indices at 546.1,
480, and 643.8 nm, respectively; ε
0
is the
permittivity of free space.
4 RESULTS AND DISCUSSION
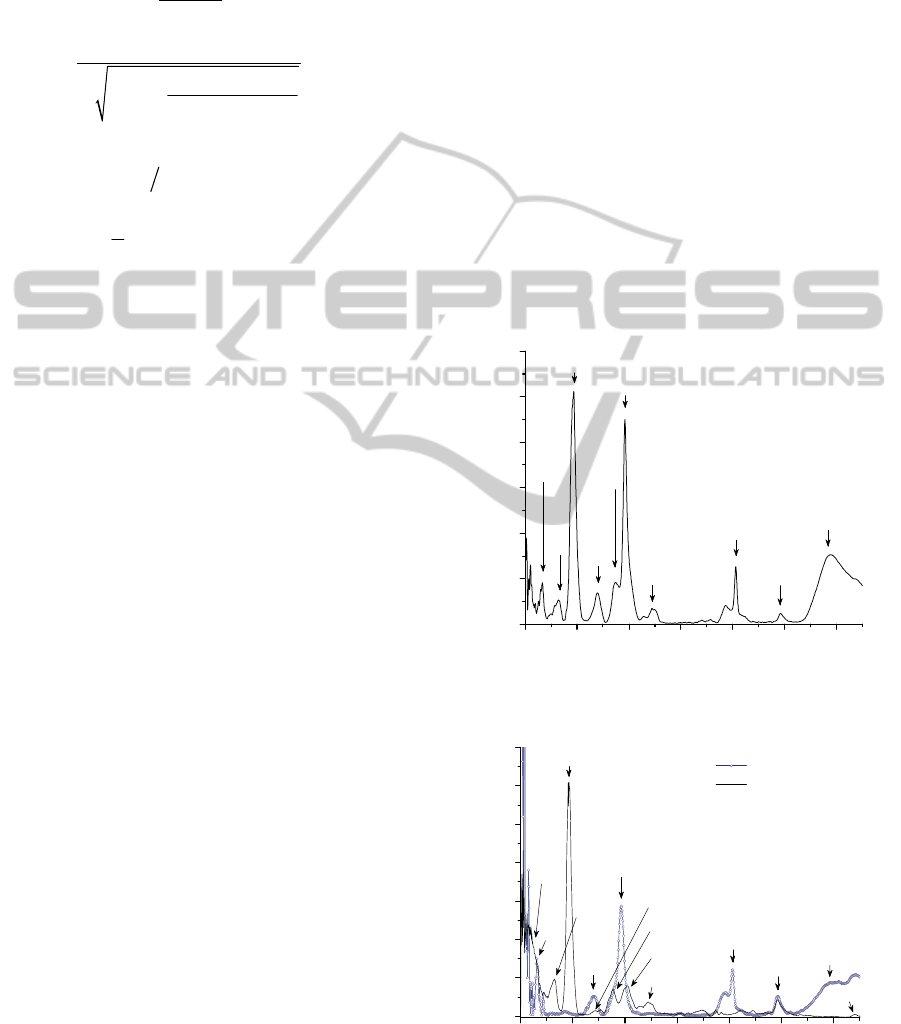
4.1 Absorption Spectrum
The absorption spectrum of the Tm
3+
/Nd
3+
codoped
fiber measured over the wavelength range of 400–
1700 nm with corresponding electronic energy
levels is shown in Figure 1. As a comparison, the
absorption spectra of the Tm
3+
doped and the Nd
3+
doped fibers are shown in Figure 2. In the absorption
spectrum of the Tm
3+
/Nd
3+
codoped fiber, the
absorption bands of Tm
3+
and Nd
3+
were overlapped
as follows:
(i) 466 nm, Tm
3+
:
3
H
6
1
G
4
and
Nd
3+
:
4
I
9/2
2
K
15/2
+
4
G
11/2
+
2
D
3/2
+
2
G
9/2
,
(ii) 679 nm, Tm
3+
:
3
H
6
3
F
2
+
3
F
3
and
Nd
3+
:
4
I
9/2
4
F
9/2
,
(iii) 784 nm, Tm
3+
:
3
H
6
3
H
4
and
Nd
3+
:
4
I
9/2
2
H
9/2
+
4
F
5/2
,
(iv) 1575 nm, Tm
3+
:
3
H
6
3
F
4
and
Nd
3+
:
4
I
9/2
4
I
15/2
.
Among them, the absorption intensity of the peak at
784 nm was higher than that of the others, since it
was a combination of the strong absorption of Tm
3+
:
3
H
4
and Nd
3+
:
2
H
9/2
+
4
F
5/2
levels (Rakov et al., 2009).
In addition, the Tm
3+
/Nd
3+
codoped fiber illustrated
five well separated absorption bands. The bands
were composed of a single separated absorption
band of Tm
3+
at 1212 nm (
3
H
6
3
H
5
transition) and
four separated absorption bands of Nd
3+
located at
528, 582, 750 and 889 nm. They are corresponding
to the transitions from
4
I
9/2
to
2
K
13/2
+
4
G
7/2
,
4
G
5/2
+
2
G
7/2
,
4
S
3/2
+
4
F
7/2
and
4
F
3/2
, respectively.
In the case of the Nd
3+
doped fiber, the
absorption intensity of the peak at 582 nm was
stronger than that of the others since it is dominant
in silicate glasses (Stokowski et al., 1981); (Thomas
et al., 1992), whereas for fluoride glasses it is
comparable with that of 800 nm (Binnemans et al.,
1998); (Digonnet, 1993); (Lucas et al., 1978). Since
the absorption peak locations of Nd
3+
at 750 nm
(
4
S
3/2
+
4
F
7/2
) and 810 nm (
2
H
9/2
+
4
F
5/2
) were close to
the absorption peak of Tm
3+
at 791 nm (
3
H
4
, in
Figure 2) (Chung et al., 1997), absorption bands
located around 750 and 784 nm seemed to be
overlapped each other in the codoped fiber as
illustrated in Figure 1. Note that the peaks around
1383 nm indicated the presence of OH ions in the
core of the fibers.
400 600 800 1000 1200 1400 1600
0
5
10
15
20
25
30
Attenuation coefficient (dB/m)
Wavelength (nm)
Nd:
4
F
7/2
+
4
S
3/2
Tm:
1
G
4
,
Nd:
2
K
15/2
+
4
G
11/2
+
2
D
3/2
+
2
G
9/2
Tm:
3
F
2
+
3
F
3
,
Nd:
4
F
9/2
Tm:
3
F
4
, Nd:
4
I
15/2
OH
Tm:
3
H
5
Tm:
3
H
4
, Nd:
2
H
9/2
+
4
F
5/2
Nd:
4
G
5/2
+
2
G
7/2
Nd:
2
K
13/2
+
4
G
7/2
+
4
G
9/2
Nd:
4
F
3/2
Figure 1: Absorption spectrum of the Tm
3+
/Nd
3+
codoped
optical fiber.
400 600 800 1000 1200 1400 1600
0
1
2
3
4
5
6
7
Nd:
2
K
15/2
+
4
G
11/2
+
2
D
3/2
+
2
G
9/2
Nd:
2
H
9/2
+
4
F
5/2
Tm:
3
F
2
+
3
F
3
Nd:
4
I
15/2
Attenuation coefficient (dB/m)
Wavelength (nm)
Tm
3+
doped fiber
Nd
3+
doped fiber
Nd:
4
S
3/2
+
4
F
7/2
Tm:
1
G
4
Nd:
4
F
9/2
Tm:
3
F
4
OH
Tm:
3
H
5
Tm:
3
H
4
Nd:
4
G
5/2
+
2
G
7/2
Nd:
2
K
13/2
+
4
G
7/2
+
4
G
9/2
Nd:
4
F
3/2
Figure 2: Absorption spectra of the Tm
3+
doped and the
Nd
3+
doped optical fibers.
NearInfraredBroadbandEmissionandSpectroscopicPropertiesofTm3+/Nd3+CodopedOpticalFiber
27
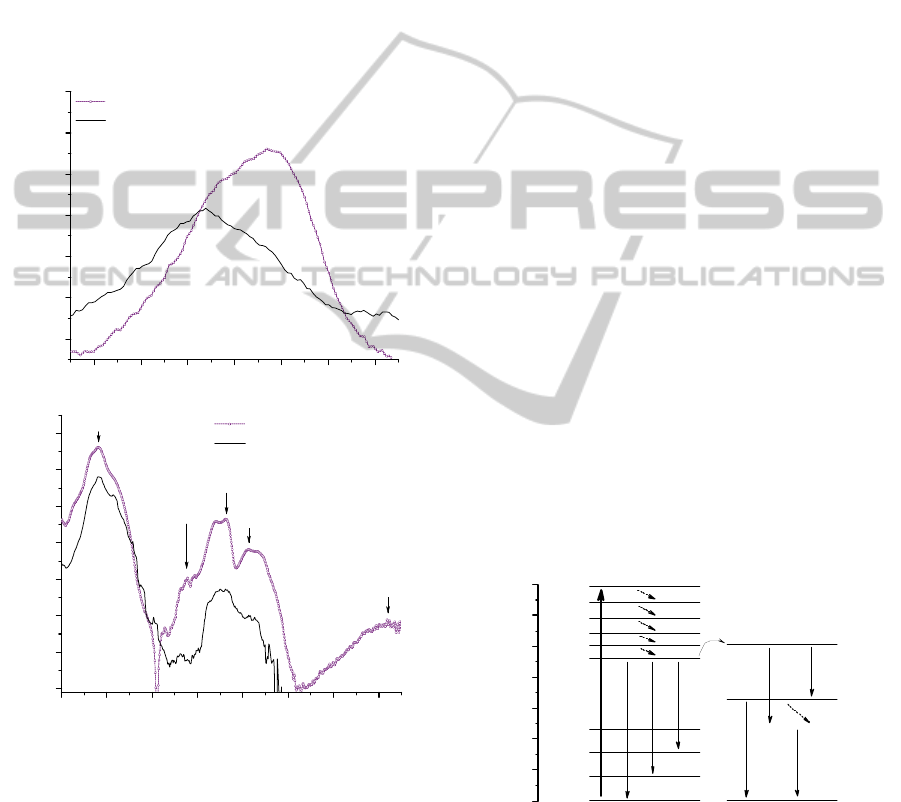
4.2 Emission Spectrum
In the absorption spectrum of the Tm
3+
/Nd
3+
codoped fiber, two obvious absorption bands existed
at 582 and 784 nm. The former was the absorption
of Nd
3+
alone, but the latter was the absorption of
both Nd
3+
and Tm
3+
. Therefore, the 582 nm
absorption band was selected as a pump band to
investigate an ET from Nd
3+
to Tm
3+
. The
commercially available He-Ne laser was used to
excite Nd
3+
ions in the fiber core by coupling the
laser light at 620 and 633 nm into the fiber core with
the power of 0.01 and 4.4 mW, respectively.
(a)
860 880 900 920 940 960 980
-56
-55
-54
-53
-52
-51
-50
Optical power (dBm)
Wavelength (nm)
Tm
3+
/Nd
3+
codoped fiber
Nd
3+
doped fiber
Nd
3+
:
4
F
3/2
4
I
9/2
(b)
1000 1100 1200 1300 1400 1500 1600 1700
-90
-85
-80
-75
-70
-65
-60
-55
Optical power (dBm)
Wavelength (nm)
Tm
3+
/Nd
3+
codoped fiber
Nd
3+
doped fiber
Tm
3+
:
3
F
4
3
H
6
Tm
3+
:
3
H
4
3
F
4
Tm
3+
:
3
H
5
3
H
6
Nd
3+
:
4
F
3/2
4
I
13/2
Nd
3+
:
4
F
3/2
4
I
11/2
Figure 3: Emission spectra of the Tm
3+
/Nd
3+
codoped and
the Nd
3+
doped fibers upon pumping with He-Ne laser at
633 nm over the wavelength range of (a) 850–990 nm and
(b) 1000–1750 nm. The fiber lengths used were 20 m.
The NIR emission spectrum of the Tm
3+
/Nd
3+
codoped fiber comparing with that of the Nd
3+
doped
fiber upon pumping at 633 nm is shown in Figure 3.
The emission bands appeared at 934, 1083 and 1362
nm from Nd
3+
ions in the Tm
3+
/Nd
3+
codoped fiber.
Another emission bands from Tm
3+
also appeared at
1279, 1414 and 1720 nm. On account of the
emissions contributed from Nd
3+
, the NIR emission
spectrum of the Tm
3+
/Nd
3+
codoped fiber was
broadened from 1215 to 1515 nm. On the other
hand, the Nd
3+
doped fiber showed the emission
bands only at 934, 1083 and 1362 nm (Zhang et al.,
2006) by exciting at 633 nm. No emission band was
observed in the Tm
3+
doped fiber upon pumping at
633 nm.
Figure 4 illustrates the electronic energy level
diagram of Tm
3+
and Nd
3+
ions. The mechanism of
the emission and ET process can be explained as
follows. When the Tm
3+
/Nd
3+
codoped fiber was
pumped at 633 nm, Nd
3+
ions from the ground state
(
4
I
9/2
) were excited to
4
G
5/2
+
2
G
7/2
and subsequently,
decayed to the
4
F
3/2
metastable state. The emission
bands of Nd
3+
appeared at 934, 1083 and 1362 nm
correspond to the transitions from
4
F
3/2
to
4
I
9/2
,
4
I
11/2
,
and
4
I
13/2
, respectively. Because of the presence of
competing emissions from the same level (
4
F
3/2
), the
emission intensity of the peak at 1362 nm was not as
strong as that at 934 and 1083 nm (Choi et al.,
2003); (Zhang et al., 2006). In addition, after the fast
nonradiative decay processes, the ET process took
place between two excited levels Nd
3+
:
4
F
3/2
and
Tm
3+
:
3
H
4
. These two energy levels matched with
the estimated energy gap of about 110
3
cm
-1
(Tanabe et al., 2000).
As a result of the ET process, the Tm
3+
/Nd
3+
codoped fiber showed the emissions of Tm
3+
around
1279, 1414 and 1720 nm. They are related to the
radiative decay from
3
H
5
3
H
6
,
3
H
4
3
F
4
and
3
F
4
3
H
6
transitions, respectively. The emission
spectrum over the wavelength of 1750 nm was not
possible to detect due to the limitation of the OSA.
0.0
2.5
5.0
7.5
10.0
12.5
15.0
17.5
Energy (
10
3
cm
-1
)
4
G
5/2
+
2
G
7/ 2
4
F
5/ 2
633 nm
Nd
3+
4
I
15 /2
4
I
13 /2
4
F
3/2
4
I
11/2
4
I
9/ 2
934 nm
1083 nm
1362 nm
4
F
9/ 2
2
H
11/2
4
F
7/2
1800 nm
Tm
3+
3
H
4
3
H
5
3
F
4
3
H
6
1414 nm
1279 nm
2300 nm
Figure 4: Schematic electronic energy levels and
transitions of Tm
3+
and Nd
3+
ions upon exciting at 633 nm.
Bold arrow, solid thin arrows, curved arrow and dashed
arrows represent the pump wavelength, the emission
wavelengths, the ET process and the nonradiative decays,
respectively.
PHOTOPTICS2013-InternationalConferenceonPhotonics,OpticsandLaserTechnology
28

4.3 JO Parameters
The JO analysis was applied using the absorption
bands of Nd
3+
in the Tm
3+
/Nd
3+
codoped optical
fiber to characterize its spectroscopic properties. The
concentration of Tm
3+
and Nd
3+
in the Tm
3+
/Nd
3+
codoped optical fiber was approximately taken as
1.7610
25
m
-3
and 0.9110
25
m
-3
, respectively. They
were estimated from the Tm
3+
doped and the Nd
3+
doped optical fiber fabricated by modified solution
doping method (Han and Kim, 2002). The values of
the JO parameters were, respectively, 8.1610
-24
,
3.2010
-24
and 2.6710
-24
m
2
for
2
,
4
and
6
. The
JO intensity parameters of the present work
compared with the results of the Tm
3+
/Nd
3+
codoped
glasses (Brandão et al., 2006); (Chung and Heo,
2001), the Tm doped fibers (Peterka et al., 2004);
(Walsh and Barnes, 2004), and the Nd doped fiber
preform and glass (Martinez et al., 1998); (Thomas
et al., 1992) are listed in Table 2.
The JO parameters obtained in the present work
indicated the trend as Ω
2
> Ω
4
> Ω
6
as the same
trend has been found in previous reports (Chung and
Heo, 2001); (Martinez et al., 1998); (Thomas et al.,
1992); (Walsh and Barnes, 2004). Nevertheless, the
trend of the Tm
3+
/Nd
3+
codoped glass (Brandão et
al., 2006) showed higher Ω
6
than Ω
4
(Ω
2
> Ω
6
> Ω
4
).
Since the intensity parameter (
2
) is related to the
degree of covalence (Digonnet, 1993), the large
value of
2
in the present work indicates the
presence of covalent bonding between Tm
3+
and
Nd
3+
. It is known that ionic metals like fluoride and
fluorophosphates glasses have very small values of
2
(Binnemans et al., 1998), whereas covalent
materials like silicate glasses have large values.
6
is related to the rigidity of material and the higher
ratio of
4
/
6
(= 1.2) implies that the Tm
3+
/Nd
3+
codoped fiber possessed a good spectroscopic
quality.
4.4 The Spectroscopic and Nonlinear
Optical Parameters
The values of line strengths and absorption cross-
sections from the transitions of
4
I
9/2
to respective
higher energy levels are listed in Table 3. The rms
deviation (Yanbo et al., 2006) of the calculated and
measured absorption line strengths was 2.9910
-25
m
2
. The spectroscopic parameters of the Tm
3+
/Nd
3+
codoped fiber are summarized in Table 4. In the
transitions of Tm
3+
, the radiative transition
probabilities were dominated by
3
H
4
3
H
6
transition. In addition,
3
H
5
3
H
6
and
3
F
4
3
H
6
transitions had strong line strengths and radiative
transition probabilities which were the good
evidence of the emissions of Tm
3+
around 1279 nm
(Yang, et al., 2006) and 1720 nm (Zou and Toratani,
1996). For the spectroscopic parameters of Nd
3+
,
4
F
3/2
4
I
11/2
transition was more dominant than that
of the others (Digonnet, 1993).
The branching ratios of the Tm
3+
/Nd
3+
codoped
fiber hold the same significance as previous reports
(Stokowski et al., 1981); (Thomas et al., 1992);
(Walsh and Barnes, 2004); (Watekar et al., 2006).
For the transitions originated from
3
H
4
level of Tm
3+
,
the
3
H
4
3
H
5
transition indicates the smallest
branching ratios (1.57%). Therefore, the
3
H
5
level
was not well populated and the emission efficiency
of 1279 nm was generally smaller than that of 1414
nm (Heo et al., 1997). In general, Nd
3+
doped silica
glass favours the
4
F
3/2
4
I
11/2
transition and the
branching ratio of it is closed to 50%.
When comparing the radiative lifetimes of the
Tm
3+
/Nd
3+
codoped fiber with those of previous
studies, the radiative lifetimes of Tm
3+
at
3
H
5
and
3
F
4
levels agreed well with those found by others
(Peterka et al., 2004); (Walsh and Barnes, 2004),
whereas the radiative lifetime of Tm
3+
at
3
H
4
level
was slightly lower than that reported in previous
studies (Peterka et al., 2004); (Walsh and Barnes,
2004); (Watekar et al., 2006). Moreover, the
radiative lifetime of upper level (
3
H
4
, 0.54 ms) was
too short to achieve the desired population inversion
than that of the lower level (
3
F
4
, 3.70 ms). This is
normally termed a self-terminating transition
(Quimby and Miniscalco, 1989). As a result, in the
glasses doped with Tm
3+
only, the population
inversion is not possible under 800 nm excitation
and the emission spectrum was hardly recorded (Lee
et al., 2003). In the case of the radiative lifetime of
Nd
3+
in the Tm
3+
/Nd
3+
codoped fiber, that of
4
F
3/2
level was found to increase (Lu and Dutta, 2001);
(Thomas et al., 1992); Yanbo et al., 2006). It is
noted that the molar ratio of Tm
3+
to Nd
3+
(= 2) was
a clear evidence of the optimum composition to
deplete the clustering of the Nd
3+
ions (Chung et al.,
1997). Since the clustering effect causes fast decay
in the emission spectrum, it decreases the total
radiative lifetime (Lu and Dutta, 2001).
The fluorescence lifetime of
4
F
3/2
level in the
Tm
3+
/Nd
3+
codoped fiber upon exciting at 800 nm
was 0.56 ms. It was more than or nearly equal to that
reported by others (Krupke, 1974); (Stokowski et al.,
1981); (Thomas et al., 1992). Nonradiative lifetime
(
4
F
3/2
level) and radiative quantum efficiency
(Krupke, 1974) of the Tm
3+
/Nd
3+
codoped fiber were
0.67 ms and 0.17, respectively. Because of the poor
NearInfraredBroadbandEmissionandSpectroscopicPropertiesofTm3+/Nd3+CodopedOpticalFiber
29
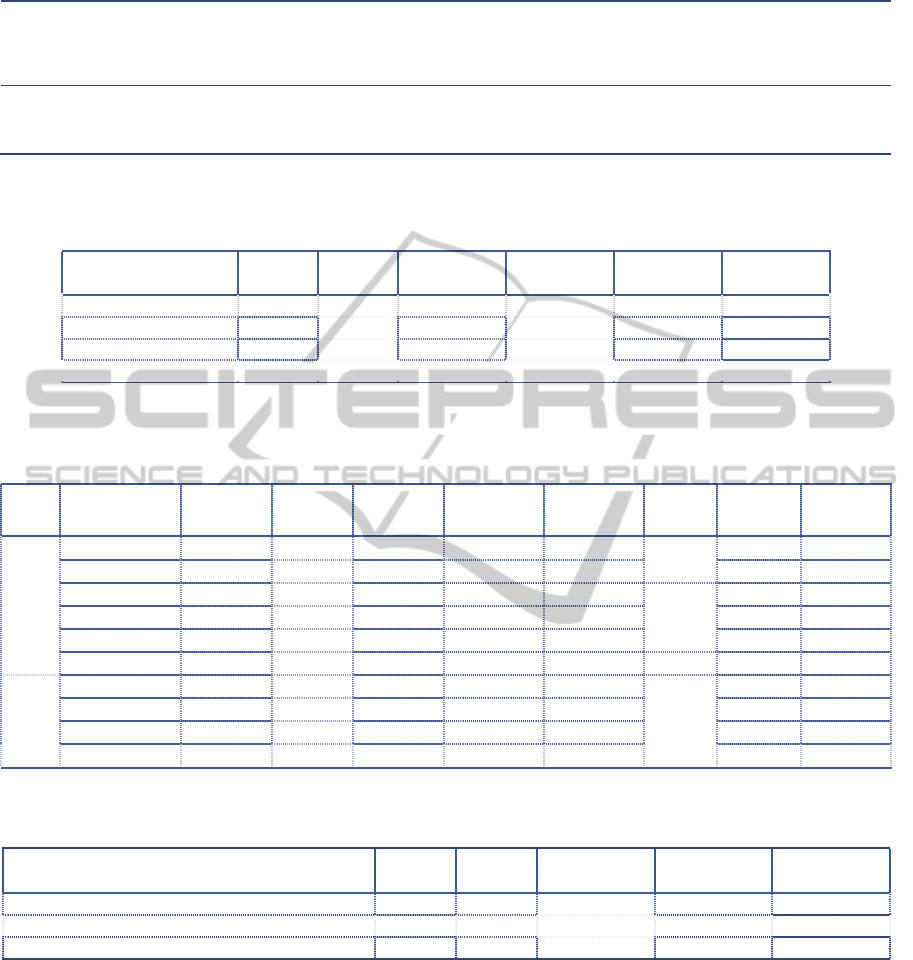
Table 2: Comparison of the JO parameters in different types of materials.
JO
parameter
(10
-24
m
2
)
Present
work
Tm
3+
/Nd
3+
codoped glass
(Brandão, et
al., 2006)
Tm
3+
/Nd
3+
codoped glass*
(Chung & Heo,
2001)
Tm doped
fiber
(Peterka, et
al., 2004)
Tm doped
fiber (Walsh
& Barnes,
2004)
Nd doped
fiber preform
(Martinez, et
al., 1998)
Nd doped
glass
(Thomas, et
al., 1992)
2
8.16 ± 0.30 7.28 3.74 3.26 6.23 5.81 9.31
4
3.20 ± 0.13 4.55 1.43 1.20 1.91 3.80 4.13
6
2.67 ± 0.23 6.18 1.09 0.46 1.36 2.42 3.91
*The JO intensity parameters were taken from Tm
3+
doped glasses.
Table 3: The values of absorption cross-section (σ
a
), measured line strength (S
med
) and calculated line strength (S
cal
)
estimated based on the absorption bands of Nd
3+
in the Tm
3+
/Nd
3+
codoped fiber.
Transitions
(from
4
I
9/2
)
λ
peak
(nm)
n (λ)
σ
a
(10
-25
m
2
)
S
med
(10
-24
m
2
)
S
cal
(10
-24
m
2
)
(∆S)
2
(10
-50
m
4
)
2
K
13/2
+
4
G
7/2
+
4
G
9/2
528 1.481 4.38 1.58 1.58 0.00
4
G
5/2
+
2
G
7/2
582 1.473 23.12 10.29 10.03 6.76
4
F
7/2
+
4
S
3/2
750 1.460 4.32 1.77 1.91 1.96
4
F
3/2
889 1.453 1.03 0.83 0.88 0.25
Table 4: The spectroscopic parameters, viz., calculated line strength (S
cal
), radiative transition probabilities (A
JJ´
),
fluorescence branching ratios (
JJ´
), radiative lifetimes (τ
r
), effective linewidths (∆λ
eff
) and emission cross-sections (σ
e
), of
the Tm
3+
/Nd
3+
codoped fiber estimated along with peak emission wavelengths.
Transitions
λ
peak
(nm)
n (λ)
S
cal
(10
-24
m
2
)
A
JJ´
(s
-1
)
JJ´
(%)
τ
r
(ms)
∆λ
eff
(nm)
σ
e
(10
-25
m
2
)
Tm
3+
3
H
5
3
H
6
1279 1.446 3.32 281.01 98.64
3.51
35.33 13.50
3
H
5
3
F
4
3870 1.434 1.30 3.87 1.36 - -
3
H
4
3
H
6
800 1.457 3.87 1674.71 90.14
0.54
- -
3
H
4
3
F
4
1414 1.444 2.02 154.11 8.29 61.08 6.41
3
H
4
3
H
5
2300 1.440 1.66 29.10 1.57 - -
3
F
4
3
H
6
1800 1.442 7.35 270.18 100.00 3.70 - -
Nd
3+
4
F
3/2
4
I
9/2
934 1.452 0.88 532.40 42.92
0.81
55.50 4.59
4
F
3/2
4
I
11/2
1083 1.449 1.54 594.16 47.90 59.32 8.71
4
F
3/2
4
I
13/2
1362 1.445 0.57 108.92 8.78 49.61 4.80
4
F
3/2
4
I
15/2
1940 1.441 0.07 4.94 0.40 - -
Table 5: Abbe number (
e
), nonlinear refractive index (n
2
), nonlinear refractive index coefficient () and susceptibility ()
of the Tm
3+
/Nd
3+
codoped fiber comparing with the results reported previously.
n
e
e
n
2
(10
-13
esu)
(10
-4
m
2
/W)
(10
-6
m
2
/ V
2
)
Present work 1.478 20.0 5.69 1.61 1.25
Yb
3+
/Tm
3+
codoped glass (Watekar, et al., 2005) - 55.6 1.35 0.38 0.30
Nd doped glass (Stokowski, et al., 1981) 1.720 45.0 3.44 - -
emission intensity of the fiber upon exciting at 800
nm, the fluorescence lifetime of Tm
3+
was not
possible to observe.
The effective linewidths of Tm
3+
from
3
H
5
3
H
6
and
3
H
4
3
H
5
transition reported by other groups
(Balda et al., 2008); (Yang et al., 2006); (Zhou et al.,
2010) were broader by nearly 30 nm than the values
estimated here. Nevertheless, the emission cross-
sections of Tm
3+
were found to increase significantly
(Balda et al., 2008); (Yang, et al., 2006). On the
other hand, in the case of Nd
3+
the effective
linewidths were larger but the peak emission cross-
sections were smaller (Stokowski et al., 1981);
(Thomas et al., 1992) since the decrease of the
emission cross-section is mainly due to the increase
of the effective linewidths (Choi et al., 2003).
The nonlinear optical parameters of the
Tm
3+
/Nd
3+
codoped fiber comparing with that of the
Yb
3+
/Tm
3+
codoped glass (Watekar et al., 2005) and
the Nd doped glass (Stokowski et al., 1981) are
PHOTOPTICS2013-InternationalConferenceonPhotonics,OpticsandLaserTechnology
30

listed in Table 5. The calculated results showed low
Abbe number and reasonably high nonlinear
refractive index (Boling and Glass, 1978).
Therefore, the Tm
3+
/Nd
3+
codoped fiber can also be
applied to the development of future phase and
amplitude modulators and fast all-optical switches
for communication (Digonnet, 1993).
5 CONCLUSIONS
We fabricated the Tm
3+
/Nd
3+
codoped optical fiber
by the MCVD process. The fiber was excited by the
He-Ne laser operating at 633 nm and the emissions
were found to appear at 934, 1083, 1279, 1363, 1414
and 1720 nm. The emission bands of Tm
3+
at 1279,
1414 and 1720 nm assured the ET process between
Tm
3+
and Nd
3+
ions. The process was so beneficial
that the Tm
3+
/Nd
3+
codoped fiber can be good
candidate for the broadband fiber laser in NIR
region. In addition, the trend of the JO parameters
(Ω
2
> Ω
4
> Ω
6
) indicated that the Tm
3+
/Nd
3+
codoped fiber occupied a good spectroscopic
quality. Further, higher radiative lifetime and larger
effective linewidths originated from
4
F
3/2
level as
well as considerably large stimulated emission
cross-sections at 1279 and 1414 nm were observed
in the Tm
3+
/Nd
3+
codoped fiber. Furthermore, the
nonlinear optical parameters of the fiber were
calculated and the considerably highly nonlinear
refractive index was found.
ACKNOWLEDGEMENTS
This work was supported partially by the Ministry of
Science and Technology, the New Growth Engine
Industry Project of the Ministry of Knowledge
Economy, the Core Technology Development
Program for Next-generation Solar Cells of
Research Institute of Solar and Sustainable Energies,
National Research Foundation of Korea (NRF) grant
funded by the Korea government (MEST) (No.
2011-0031840), the Brain Korea-21 Information
Technology Project, and by the (Photonics 2020)
research project through a grant provided by the
Gwangju Institute of Science and Technology in
2012, South Korea.
REFERENCES
Aull, B. & Jenssen, H., 1982. Vibronic interactions in
Nd:YAG resulting in nonreciprocity of absorption and
stimulated emission cross sections. IEEE J. Quantum
Electron., vol. 18, no. 5, pp. 925-930.
Balda, R. et al., 2008. Spectroscopic properties of the 1.4
μm emission of Tm
3+
ions in TeO
2
-WO
3
-PbO glasses.
Opt. Express, vol. 16, no. 16, pp. 11836-11846.
Binnemans, K., Deun, R. V., Gorller-Walrand, C. &
Adam, J.L., 1998. Optical properties of Nd
3+
-doped
fluorophosphate glasses. J. Alloy. Compd., vol. 275-
277, pp. 455-460.
Boling, N. L. & Glass, A. J., 1978. Empirical relationships
for predicting nonlinear refractive index changes in
optical solids. IEEE J. Quantum Electron., vol. 14, no.
8, pp. 601-608.
Brandão, M. J. S. et al., 2006. Optical properties and
energy transfer processes in (Tm
3+
, Nd
3+
) doped
tungstate fluorophosphate glass. J. Appl. Phys., vol.
99, no. 11, p. 113525.
Carnall, W. T., Fields, P. R. & Rajnak, K., 1968. Spectral
intensities of the trivalent lanthanides and actinides in
solution. II. Pm
3+
, Sm
3+
, EU
3+
, Gd
3+
, Tb
3+
, Dy
3+
and
Ho
3+
. J. Chem. Phys., vol. 49, no. 10, pp. 4412-4423.
Choi, J. H. et al., 2003. Optical absorption and emission
properties of Nd
3+
doped fluorophosphates glass for
broadband fiber amplifier applications. Proc. SPIE,
vol. 4974, pp. 106-111.
Chung, W. J. & Heo, J., 2001. Energy transfer process for
the blue up-conversion in calcium aluminate glasses
doped with Tm
3+
and Nd
3+
. J. Am. Ceram. Soc., vol.
84, no. 2, pp. 384-352.
Chung, W. J., Yoo, J. R., Kim, Y. S. & Heo, J., 1997.
Mechanism of the blue up-conversion in Tm
3+
/Nd
3+
-
doped calcium aluminate glasses. J. Am. Ceram. Soc.,
vol. 80, no. 6, pp. 1485-1490.
Fowler, W. B. & Dexter, D. L., 1962. Relation between
absorption and emission probabilities in luminescent
centers in ionic solids. Phys. Rev., vol. 128, pp. 2154-
2165.
Digonnet, M. J. F. (ed.), 1993. Rare-earth-doped fiber
lasers and amplifiers. Marcel Dekker, Inc.
Han, W.-T. & Kim, Y. H., 2002. Linear and nonlinear
optical properties of optical fibers containing PbTe
quantum dots for all optical switching application. 2
nd
Int. China-Korea Glass and Glass-Ceramics Symp.,
Shanghi.
Heo, J., Cho, W. Y. & Chung, W. J., 1997. Sensitizing
effect of Tm
3+
on 2.9 μm emission from Dy
3+
-doped
Ge
25
Ga
5
S
70
glass. J. Non-Cryst. Solids, vol. 212, pp.
151-156.
Judd, B. R., 1962. Optical absorption intensities of rare-
earth ions. Phy. Rev., vol. 127, pp. 750-761.
Kobayashi, S., Shibata, N., Shibata, S. & Izawa, T., 1978.
Characteristics of optical fibers in infrared wavelength
region. Review of ECL, vol. 26, no. 3, pp. 453-467.
Kobayashi, S., Shibata, S., Shibata, N. & Izawa, T., 1977.
Refractive-index dispersion of doped fused silica.
1
st
International Conference on Integrated Optics and
Optical Fiber Communication (IECE), Tokyo.
Krupke, W. F., 1974. Induced-emission cross sections in
neodymium laser glasses. IEEE J. Quantum Electron.,
NearInfraredBroadbandEmissionandSpectroscopicPropertiesofTm3+/Nd3+CodopedOpticalFiber
31

vol. QE-10, no. 4, pp. 450-457.
Lahoz, F., Shepherd, D. P., Wilkinson, J. S. & Hassan, M.
A., 2008. Efficient blue upconversion emission due to
confined radiative energy transfer in Tm
3+
–Nd
3+
co-
doped Ta
2
O
5
waveguides under infrared-laser
excitation. Opt. Commun., vol. 281, pp. 3691-3694.
Lee, D. J., Heo, J. & Park, S. H., 2003. Energy transfer
and 1.48 μm emission properties in chalcohalide
glasses doped with Tm
3+
and Tb
3+
. J. Non-Cryst.
Solids, vol. 331, pp. 181-189.
Lucas, J. et al., 1978. Preparation and optical properties of
neodymium fluorozirconate glasses. J. Non-Cryst.
Solids, vol. 27, pp. 273-283.
Lu, K. & Dutta, N. K., 2001. Spectroscopic properties of
Nd-doped glass for 944 nm laser emission. J. Appl.
Phys., vol. 89, no. 6, pp. 3079-3083.
Martinez, A., Zenteno, L. A. & Kuo, J. C. K., 1998.
Optical and spectroscopic characterization of Nd-
doped aluminosilicate fiber preforms made by the
MCVD method using chelate delivery. Appl. Phys. B,
vol. 67, pp. 17-21.
Milam, D. & Weber, M. J., 1976. Measurement of
nonlinear refractive-index coefficients using time-
resolved interferometry: application to optical
materials for high-power neodymium lasers. J. Appl.
Phys., vol. 47, pp. 2497-2501.
Peterka, P. et al., 2004. Theoretical modelling of S-band
thulium-doped silica fibre amplifiers. Opt. Quant.
Electron., vol. 36, pp. 201-212.
Quimby, R. S. & Miniscalco, W. J., 1989. Continuous-
wave lasing on a self-terminating transition. Appl.
Opt., vol. 28, no. 1, pp. 14-16.
Rakov, N., Gómez, L. A., Rátiva, D. J. & Maciel, G. S.,
2002. Blue upconversion enhancement by a factor of
200 in Tm
3+
-doped tellurite glass by codoping with
Nd
3+
ions. J. Appl. Phys., vol. 92, no. 10, pp. 6337-
6339.
Rakov, N., Gómez, L. A., Rátiva, D. J. & Maciel, G. S.,
2009. Blue upconversion emission from Tm
3+
sensitized by Nd
3+
in aluminum oxide crystalline
ceramic powders. Appl. Phys. B, vol. 94, pp. 199-202.
Shen, S. et al., 2002. Tellurite glasses for broadband
amplifiers and integrated optics. J. Am. Ceram. Soc.,
vol. 85, no. 6, pp. 1391-1395.
Stokowski, S. E., Saroyan, R. A. & Weber, M. J., 1981.
Nd-doped laser glass spectroscopic and physical
properties. Lawrence Livermore National Laboratory,
M-095, Rev. 2, 1.
Tanabe, S., 2002. Rare-earth-doped glasses for fiber
amplifiers in broadband telecommunication. C. R.
Chim., vol. 5, no. 5, pp. 815-824.
Tanabe, S., Feng, X. & Hanada, T., 2000. Improved
emission of Tm
3+
doped glass for a 1.4-μm amplifier
by radiative energy transfer between Tm
3+
and Nd
3+
.
Opt. Lett., vol. 25, no. 11, pp. 817-819.
Thomas, I. M., Payne, S. A. & Wilke, G. D., 1992. Optical
properties and laser demonstrations of Nd-doped sol-
gel silica glasses. J. Non-Cryst. Solids, vol. 151, no. 3,
pp. 183-194.
Walsh, B. M. & Barnes, N. P., 2004. Comparison of
Tm:ZBLAN and Tm:silica fiber lasers; spectroscopy
and tunable pulsed laser operation around 1.9 μm.
Appl. Phys. B, vol. 78, pp. 325-333.
Watekar, P. R., Ju, S., Boo, S. & Han, W.-T., 2005. Linear
and non-linear optical properties of Yb
3+
/Tm
3+
co-
doped alumino-silicate glass prepared by sol-gel
method. J. Non-Cryst. Solids, vol. 351, pp. 2446-2452.
Watekar, P. R., Ju, S. & Han, W.-T., 2006. A small-signal
power model for Tm-doped silica-glass optical fiber
amplifier. IEEE Photon. Technol. Lett., vol. 18, no.
19, pp. 2035-2037.
Weber, M. J., Lynch, J. E., Blackburn, D. H. & Cronin, D.
J., 1983. Dependence of the stimulated emission cross
section of Yb
3+
on host glass composition. IEEE J.
Quantum Electron., vol. 19, pp. 1600-1608.
Yanbo, Q. et al., 2006. Spectroscopic properties of Nd
3+
-
doped high silica glass prepared by sintering porous
glass. J. Rare Earth., vol. 24, pp. 765-770.
Yang, Z., Luo, L. & Chen, W., 2006. The 1.23 and 1.47
μm emissions from Tm
3+
in chalcogenide glasses. J.
Appl. Phys., vol. 99, no. 7, pp. 076107-3.
Zabicky, J. (ed.), 2009. The chemistry of metal enolates,
part 1. John Wiley & Sons Ltd.
Zhang, J., Chung, W. J., Zhao, X. & Heo, J., 2010. Nd
3+
sensitized blue upconversion luminescence in
Nd
3+
/Pr
3+
co-doped Ge–Ga–S–CsBr chalcohalide
glasses. J. Non-Cryst. Solids, vol. 356, pp. 2406-2408.
Zhang, J. W. et al., 2006. Optical amplification in Nd
3+
doped electro-optic lanthanum lead zirconate titanate
ceramics. Appl. Phys. Lett., vol. 89, pp. 061113.
Zhou, B., Lin, H. & Pun, E.Y.-B., 2010. Tm
3+
-doped
tellurite glasses for fiber amplifiers in broadband
optical communication at 1.20 µm wavelength region.
Opt. Express, vol. 18, no.18, pp. 18805-18810.
Zou, X. & Toratani, H., 1996. Spectroscopic properties
and energy transfers in Tm
3+
singly- and Tm
3+
/Ho
3+
doubly-doped glasses. J. Non-Cryst. Solids, vol. 195,
pp. 113-124.
PHOTOPTICS2013-InternationalConferenceonPhotonics,OpticsandLaserTechnology
32
