
To Frag or to Be Fragged
An Empirical Assessment of Latency in Cloud Gaming
Ulrich Lampe
1
, Qiong Wu
1
, Ronny Hans
1
, Andr
´
e Miede
2
and Ralf Steinmetz
1
1
Multimedia Communications Lab (KOM), TU Darmstadt, Rundeturmstr. 10, 64283 Darmstadt, Germany
2
Fakult
¨
at f
¨
ur Ingenieurwissenschaften, HTW des Saarlandes, Goebenstr. 40, 66117 Saarbr
¨
ucken, Germany
Keywords:
Cloud Computing, Cloud Gaming, Quality of Service, Latency, Measurement.
Abstract:
With the emergence of cloud computing, diverse types of Information Technology services are increasingly
provisioned through large data centers via the Internet. A relatively novel service category is cloud gaming,
where video games are executed in the cloud and delivered to a client as audio/video stream. While cloud
gaming substantially reduces the demand of computational power on the client side, thus enabling the use of
thin clients, it may also affect the Quality of Service through the introduction of network latencies. In this
work, we quantitatively examine this effect, using a self-developed measurement tool and a set of actual cloud
gaming providers. For the two providers and three games in our experiment, we find absolute increases in
latency between approximately 40 ms and 150 ms, or between 85% and 800% in relative terms.
1 INTRODUCTION
Since its popularization in the mid-2000s, cloud com-
puting has substantially altered the way in which In-
formation Technology (IT) services are delivered and
brought massive changes to the IT sector (Dikaiakos
et al., 2009). Today, the decade-old vision of deliver-
ing IT as a “utility” has come closer to realization than
ever before (Buyya et al., 2009).
A relatively novel business model, within the
greater context of cloud computing, is cloud gaming.
The principal idea of this concept is to execute video
games in a cloud data center and deliver them to a
client as audio/video stream via the Internet. The client
thus serves as a simple playback and input device; the
computationally complex task of executing the actual
game logic and rendering the game images is shifted
to the cloud (Choy et al., 2012; Jarschel et al., 2011;
Ross, 2009; S
¨
uselbeck et al., 2009).
From a formal standpoint, based on the popular
NIST definition of cloud computing (Mell and Grance,
2011), cloud gaming can most intuitively be inter-
preted as a subclass of the Software as a Service model,
because it constitutes a functionally complex service
that is offered on the basis of low-level infrastructure
services.
From a customer perspective, one main advantage
of cloud gaming exists in the ability to access games
at any place and time, independent of any specific de-
vice upon which they are installed (Choy et al., 2012).
Furthermore, hardware expenditures are substantially
reduced, because a simplistic thin client is usually suffi-
cient for access (Chen et al., 2011). In addition, games
do not have to be purchased for a fixed (and commonly
quite notable) amount of money, but can be leased on a
pay-per-use basis. From the provider perspective, one
main benefit is the prevention of copyright infringe-
ments (Ross, 2009). In addition, distribution costs
may be substantially reduced, because the need for the
delivery of physical media is alleviated. Furthermore,
the development process may be greatly simplified if
games are exclusively developed for the cloud, rather
than multiple different platforms.
However, the use of the Internet also introduces
a new component into the delivery chain. Being a
public network, the Internet lies (partially) out of the
control sphere of both the user and the provider, and
follows a “best effort” philosophy, i. e., it does not
make any end-to-end Quality of Service (QoS) assur-
ances (Courcoubetis et al., 2011). Hence, limitations
of the network infrastructure, such as high latency,
small bandwidth, or high packet loss, may potentially
affect the QoS of the overall cloud gaming system for
the user.
In this work, we focus on the QoS parameter of
latency. This parameter plays an important role for the
overall game experience (Dick et al., 2005; S
¨
uselbeck
et al., 2009). As the title of this work indicates, this
5
Lampe U., Wu Q., Hans R., Miede A. and Steinmetz R..
To Frag or to Be Fragged - An Empirical Assessment of Latency in Cloud Gaming.
DOI: 10.5220/0004345900050012
In Proceedings of the 3rd International Conference on Cloud Computing and Services Science (CLOSER-2013), pages 5-12
ISBN: 978-989-8565-52-5
Copyright
c
2013 SCITEPRESS (Science and Technology Publications, Lda.)

applies specifically for action-oriented games such as
first-person shooters, where it may determine whether
a player is “fragged”, i.e., her/his character is killed,
or is able to frag her/his opponent (Claypool and Clay-
pool, 2010; Dick et al., 2005).
Hence, the research question we aim to empirically
answer in this work is: “What is the impact of cloud
gaming on the QoS parameter of latency, as compared
to a local execution of a video game?”
In the following Section 2, we introduce the exper-
imental setup and infrastructure. Subsequently, in Sec-
tion 3, we extensively present and discuss the results.
An overview of related work is given in Section 4.
The paper concludes with a summary and outlook in
Section 5.
2 EXPERIMENTAL DESIGN
In this section, we describe the overall design of our
experiment. To begin with, we briefly explain the
dependent and independent variables that were con-
sidered. Subsequently, we introduce our measurement
tool and briefly describe its technical implementation.
2.1 Dependent Variable: Latency
As explained in the previous section, in this work, we
focus on the QoS parameter of latency. It thus consti-
tutes the only dependent variable in our experiments.
More specifically, we consider user-perceived latency.
By that term, we refer to the timespan that elapses be-
tween a certain action performed by the user, e. g., the
press of a mouse button or a key, and the correspond-
ing game reaction, e. g., the appearance of gunfire or
the menu. It is also referred to as “interactive response
time” in related research (Choy et al., 2012).
Based on the combined findings of Choy et al.,
Wang, and Wilson, latency can be split into the follow-
ing components if a game is locally executed (Choy
et al., 2012; Wang, 2012; Wilson, 2009):
•
Input lag, which corresponds to the timespan be-
tween two subsequent sampling events of the game
controller, e. g., mouse or keyboard.
•
Game Pipeline CPU Time, i. e., the time which is
required for processing the input and realizing the
game logic.
•
Game Pipeline GPU Time, i. e., the time which the
graphic card requires for rendering the next frame
of the game.
•
Frame Transmission, which denotes the time that
is required for transferring the frame from the back-
buffer to the frontbuffer of the graphic card, and
subsequently to the screen.
•
LCD Response Time, which indicates the timespan
that is required to actually display the frame on the
screen.
Once a game is executed in the cloud and delivered
via a network, the following additional components
have to be considered (Choy et al., 2012; Wang, 2012;
Wilson, 2009):
•
Upstream Data Transfer, i. e., the time that it takes
to sent the user input to the cloud gaming provider.
•
Capture and Encoding, which denotes the time
requirements for capturing the current frame and
encoding it as video stream.
•
Downstream Data Transfer, i. e., the timespan for
transferring the stream to the client.
•
Decoding, which indicates the time for converting
the video stream back into a frame.
Intuitively, one might reason that a cloud-based
game will always exhibit a higher latency that a locally
executed game due to the additional latency compo-
nents. However, this is not necessarily true. In fact,
due to the use of potent hardware in the cloud and de-
pending on the geographical distance between the user
and the cloud provider, the reduction of time spent in
the game pipeline may overcompensate the network,
encoding, and decoding latencies (Wang, 2012).
2.2 Independent Variables: Games,
Providers, and Networks
The dependent variable in our experiments, latency,
may potentially be determined by various factors, i. e.,
a set of independent variables. In our work, we fo-
cus on different games, cloud gaming providers, and
network connections as suspected key determinants.
With respect to the main subject of our research,
i. e., the examined games, our focus was on action-
oriented titles. As explained in the previous section,
these games are commonly very sensitive to latency
increases and thus, of elevated interest. We specifically
chose the following titles, all of which are available
both in the cloud and for local installation:
•
Shadowgrounds
1
is a 3D first-person shooter game
developed by Frozenbyte. It was initially released
in the year 2005.
•
Shadowgrounds Survivor
2
is a sequel to Shadow-
grounds. It was also developed by Frozenbyte and
released in 2007.
1
http://www.shadowgroundsgame.com/
2
http://www.shadowgroundssurvivor.com/
CLOSER2013-3rdInternationalConferenceonCloudComputingandServicesScience
6

•
Trine
3
is an action-oriented puzzle game. It was
developed by Frozenbyte as well and released in
2009.
The determination of representative cloud gaming
providers is somewhat challenging. Following an ini-
tial hype around cloud gaming, which resulted in a
variety of new suppliers, the market appears to be in
a phase of consolidation today. For example, Gaikai,
one of the pioneers in cloud gaming, was acquired
in August 2012 by the major industry player Sony
(Gaikai, 2012), and has temporally ceased its services.
This work includes measurements for three provision-
ing options:
•
Cloud Gaming Provider A (CGP-A), which is lo-
cated in the Americas and operates a dedicated
infrastructure
4
.
•
Cloud Gaming Provider B (CGP-B), with head-
quarters in the Asian-Pacific region, which also
uses a dedicated infrastructure.
•
A Local Personal Computer (Local), which is
equipped with an Intel Core 2 Quad Q6700 CPU,
an NVidia Geforce GTX 560 GPU, and 4 GB of
memory.
As it has been explained before, cloud gaming
employs the Internet as delivery channel. Because
the network as such is out of the control sphere of
both provider and user, we focus on the user’s network
connection in our experiments. Specifically, we regard
the following techniques:
•
Universal Mobile Telecommunications System
(UMTS), which marks the third generation (3G) of
cellular networks and has been widely deployed in
many industrialized countries since the mid-2000s.
We use a variant with with the High Speed Packet
Access (HSPA) extensions.
•
Long Term Evaluation (LTE), which corresponds
to the fourth generation (4G) of cellular networks.
It has recently been or is currently being introduced
by many mobile network providers.
•
Very High Speed Digital Subscriber Line (VSDL),
which denotes the cutting-edge in traditional fixed-
line, copper cable-based Internet access.
2.3 Measurement Tool:
GALAMETO.KOM
The aim of our approach is to automate the measure-
ment process to the largest possible extent. For that
3
http://www.trine-thegame.com/
4
Unfortunately, due to legal considerations, we are
required to anonymize the names of the cloud gaming
providers.
matter, we have devised a GAme LAtency MEasure-
ment TOol, or in brief, GALAMETO.KOM. This tool
autonomously invokes a predefined action in the game
and measures the time interval until the corresponding
reaction can be observed.
As a preparatory step, the tool requires the user to
specify the trigger that invokes a certain action in the
game. Such trigger may consist in pressing a mouse
button or a key. Furthermore, the user has to spec-
ify the screen area that will reflect the corresponding
reaction, such as the display of gunfire or the main
menu. In order to reliably identify the reaction, the
user further declares a numerical sensitivity value
δ
.
This sensitivity value reflects the change of the aver-
age color within the predefined screen area. Lastly,
in order to start an experiment, the user specifies the
desired number of observations in the sample.
For each measurement iteration,
GALAMETO.KOM first invokes the specified
trigger. That is, it submits the user-defined activity
to the game and stores a timestamp
t
act
. Then, the
tool scans the frontbuffer of the graphics card and
computes the initial average color value
c
init
for the
predefined screen area. That procedure is continuously
repeated, each time updating the current average color
c
curr
and a corresponding timestamp
t
react
. Once
a change of color, i. e., a reaction with sufficient
magnitude, is detected (i. e., if
|c
curr
−c
init
| ≥ δ
holds),
the latency
t
lat
= t
react
− t
act
can be computed. The
latency value is stored as new observation, and the
process is repeated until a sample of the desired size
has been collected.
2.4 Measurement Procedure
For our experiment, we followed a so-called full fac-
torial design. That is, we conducted measurements
for each possible value combination of the three in-
dependent variables. Because the local execution of
a single-player game is independent of the network
connection, there are seven possible combinations of
provider and network. For each combination, we exam-
ine the three selected games. Thus, our experimental
setup consists of 21 different test cases.
For each test case, we acquired a sample of 250 ob-
servations. Subsequently, we checked for statistically
significant differences between the test cases with re-
spect to the mean latencies using a parametric
t
-test
(Jain, 1991; Kirk, 2007). For validation purposes, a
non-parametric Mann-Whitney
U
-test was addition-
ally applied (Kirk, 2007). Both tests were conducted at
the same confidence level of 95% (i. e.,
al pha = 0.05
).
The mean latencies of a pair of test cases are only
considered significantly different if the according indi-
ToFragortoBeFragged-AnEmpiricalAssessmentofLatencyinCloudGaming
7

cation is given by both tests.
All experiments were executed using the previ-
ously specified laptop computer in order to avoid mea-
surement inaccuracies due to hardware differences.
The different network connections were provided by
a major German telecommunications provider. No ar-
tificial network disturbances were introduced into the
measurement process.
3 EXPERIMENTAL RESULTS
AND DISCUSSION
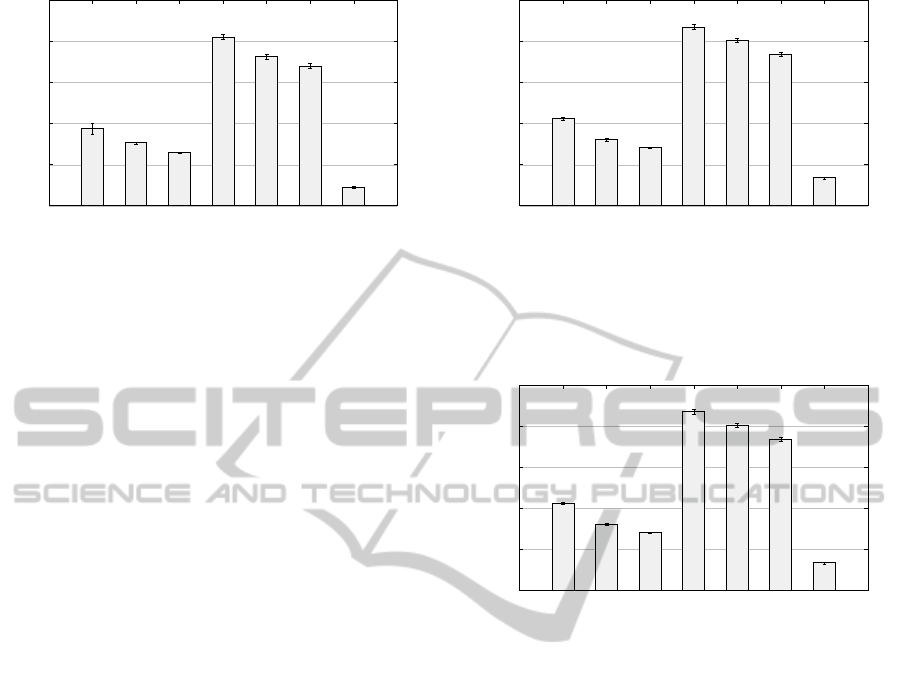
The results of our experiment, i. e., observed mean la-
tencies, along with the corresponding confidence inter-
vals, are illustrated in Figures 1, 2, and 3 for the three
games respectively. In the appendix, we further pro-
vide corresponding box-and-whisker plots (Figures 4
through 6). In addition, Table 1 contains the detailed
results that have been the basis for the figures.
As can be seen, a local execution of the games
yields the lowest latencies, ranging from 22 ms for
Shadowgrounds to 44 ms for Trine. As it may have
been expected, the latencies significantly increase with
the novelty of the game. Because the remaining latency
components can be assumed constant, this indicates a
growth of computational complexity within the game
pipeline, i. e., the overall increase in latency can likely
be traced back to increased CPU and GPU time.
For cloud gaming provider A, we observe mean la-
tencies between approximately 65 ms and 130 ms. The
latencies significantly decrease with improved network
connectivity. Specifically, with respect to the cellular
networks, LTE is able to reduce the mean latency by
up to 35 ms compared to UMTS. A fixed-line connec-
tion, namely VSDL, yields a further reduction of up to
12 ms. In general, the latency increases diminish com-
pared to a local execution with the novelty of the game.
This indicates that the latency of the game pipeline
can, in fact, be reduced through the use of dedicated
hardware in the cloud data center (cf. Section 2.1).
However, the effect does not compensate for the net-
work delay in our test cases. Hence, regardless of the
game and network connection, provider A is not able
to compete with a local execution in terms of latency.
Depending on the network connection, cloud gaming
adds between 40 ms and 90 ms of latency for each
considered game. These differences are statistically
significant at the assumed confidence level of 95%.
For cloud gaming provider B, we find even higher
mean latencies between about 150 ms and 220 ms.
Once again, there is a significant reduction in these fig-
ures with improved network connectivity. Compared
to UMTS, LTE achieves a reduction of up to 29 ms,
which very similar to the results for cloud gaming
provider A. Likewise, VSDL shaves off between 9 ms
and 17 ms in latency in comparison to LTE. In con-
trast to provider A, we do not find a decreasing latency
margin with increasing novelty, i. e., computational
complexity, of the game. Thus, provider B is even
less capable than provider A of competing with a local
execution in terms of latency. Specifically, depending
on the game, provider B adds between 100 ms and
150 ms of latency. As for provider A, these increases
are statistically significant.
In summary, with respect to the research question
from Section 1, we conclude that cloud gaming has
a significant and negative impact on the QoS param-
eter of latency, compared to the local execution of a
game. Depending on the provider and network con-
nection, cloud gaming results in an latency increases
between 40 ms and 150 ms. In relative terms, the
increases amount to between 85% (Trine at CGP-A
using VDSL) and 828% (Shadowgrounds at CGP-B
using UMTS).
As previously explained, our focus in this work
was on QoS, i. e., objective quality figures. Thus, the
subjective perception of our results may substantially
differ between various player groups. According to
Dick et al., the mean tolerable latencies for an unim-
paired experience in a multi-player game are in the
range between 50 and 100 ms; maximal tolerable la-
tencies are approximately 50 ms higher, i. e., in the
order of 100 to 150 ms (Dick et al., 2005). User stud-
ies by Jarschel et al. also indicate that the Quality
of Experience (QoE) quickly drops with increasing
latency, specifically in fast-paced games such as rac-
ing simulations or first-person shooters (Jarschel et al.,
2011). Hence, based on the observed numbers, we
believe that cloud gaming is primarily attractive for
slow-paced games, as well as casual players who likely
have moderate QoS expectations compared to experi-
enced and sophisticated gamers.
Given the reliance on the Internet as delivery
medium, cloud gaming would likely profit from a shift
away from the best-effort philosophy towards sophis-
ticated QoS mechanisms. The development of such
mechanisms has been an active field of research for
many years, resulting in proposals such as Integrated
Services (IntServ) or Differentiated Services (DiffServ)
(Tanenbaum, 2003). However, past experience – for
example, with the rather sluggish introduction of IPv6
– has shown that many Internet service providers are
rather reluctant to make fundamental infrastructure
changes unless a pressing need arises. In addition,
as the ongoing debate about net neutrality shows, the
introduction of QoS management techniques on the In-
ternet is not merely a technical issue. For a more com-
CLOSER2013-3rdInternationalConferenceonCloudComputingandServicesScience
8
0
50
100
150
200
250
CGP-A
UMTS
CGP-A
LTE
CGP-A
VSDL
CGP-B
UMTS
CGP-B
LTE
CGP-B
VSDL
Local
N/A
Mean Latency [ms]
Provider, Network
Figure 1: Mean latencies with 95% confidence intervals for
the game Shadowgrounds per test case (sample size
n =
250).
prehensive discussion, we refer the interested reader
to Xiao (Xiao, 2008).
Assuming that the Internet itself will remain to fol-
low a best-effort philosophy in the short and medium
term, two main options remain for cloud providers to
improve the QoS of their systems.
The first option consists in moving the data cen-
ters geographically closer to the clients. However,
for a constant client base, such decentralization im-
plies building a larger number of data centers. Due
to the reduced size and thus, smaller economies of
scale of these data centers (Greenberg et al., 2008),
such approach is likely to be cost-intensive. A viable
alternative may consist in the exploitation of servers
in existing content delivery networks, as proposed by
Choy et al. (Choy et al., 2012).
Second, cloud providers may upgrade their servers
to reduce the latency of the game pipeline. Thus, they
could aim to (over-)compensate for the network la-
tency. However, while such an approach may be suc-
cessful for computationally complex games, it will
likely fail for older games where the impact of the
game pipeline is relatively small. In addition, server
upgrades can be costly, specifically if disproportion-
ately expensive high-end components have to be pur-
chased.
Hence, in our opinion, a key challenge for cloud
providers consists in finding an economically reason-
able balance between QoS (and thus, the potential
number of customers) and cost.
4 RELATED WORK
With the interest in – not to say hype around – cloud
computing in recent years, this paradigm has been a
very intensive area of research. However, the specific
0
50
100
150
200
250
CGP-A
UMTS
CGP-A
LTE
CGP-A
VSDL
CGP-B
UMTS
CGP-B
LTE
CGP-B
VSDL
Local
N/A
Mean Latency [ms]
Provider, Network
Figure 2: Mean latencies with 95% confidence intervals for
the game Shadowgrounds Survivor per test case (sample size
n = 250).
0
50
100
150
200
250
CGP-A
UMTS
CGP-A
LTE
CGP-A
VSDL
CGP-B
UMTS
CGP-B
LTE
CGP-B
VSDL
Local
N/A
Mean Latency [ms]
Provider, Network
Figure 3: Mean latencies with 95% confidence intervals for
the game Trine per test case (sample size n = 250).
issue of cloud gaming has, according to our percep-
tion, received relatively little attention by the research
community to date.
Chen et al. have, to the best of our knowledge,
been the first to conduct empirical latency measure-
ments of actual cloud gaming providers (Chen et al.,
2011). In their experiments, they regarded OnLive, a
commercial provider, as well as, StreamMyGame, a
free software tool that permits to set up a private video
game stream. Chen et al. propose and implement a
measurement tool which is based on similar concep-
tual ideas as GALAMETO.KOM. Most notably, the
authors also trigger a certain action – in their case, the
invocation of the in-game menu – and observe the ap-
pearance of the corresponding reaction based on color
changes. In their experiments, they find streaming
delays – which do not include the network latency –
between 135 ms and 240 ms for OnLive and up to
500 ms for StreamMyGame. Thus, their results are in
a similar order of magnitude as the values that have
been observed in our experiments. In contrast to this
work, Chen et al. trigger the comparison process in
ToFragortoBeFragged-AnEmpiricalAssessmentofLatencyinCloudGaming
9

the measurement tool through a redirected Direct3D
function call and operates on the backbuffer of the
graphics card, not the frontbuffer. Thus, the latency
component that is introduced through the copying of
the backbuffer scene into the frontbuffer has not been
considered in their work. In addition, and more impor-
tantly, the authors do not use a locally executed game
as benchmark in their experiments.
Jarschel et al. have conducted a user-study involv-
ing 58 participants on QoE of cloud gaming depending
on network characteristics (Jarschel et al., 2011). For
that purpose, they generate an audio/video stream us-
ing a PlayStation 3 gaming console. This stream is
subjected to artificial delay and packet loss, ranging
between 0 and 300 ms and 0 and 1% respectively,
in different test scenarios. Jarschel et al. find that
the quality of the downstream, i. e., the link between
provider and user, has a substantially higher impact
on the QoE than the quality of the upstream, i. e., the
link between user and provider. Their results also indi-
cate that packet loss is of higher relevance than latency
for the subjective quality perception. The main dif-
ference compared to our work consists in the focus
on subjective, rather than objective quality aspects. In
addition, Jarschel et al. did not regard commercial
cloud providers in their experiments.
Wang and Dey have proposed a cloud gaming sys-
tem for mobile clients called Cloud Mobile Gaming
(CMG) (Wang and Dey, 2009). As part of their work,
they examine the impact of different factors on the user
experience. The considered factors involve the video
stream configuration and quality, the game configura-
tion, delay (i. e., latency), and packet loss. Similarly
to Jarschel et al., the authors use a controlled exper-
imental setup, in which they systematically vary the
values of the previously mentioned factors. Using on
a study group of 21 participants, they infer impair-
ment functions for these factors. The findings are
subsequently validated using a control group of 15
participants. Based on practical measurements, the
authors conclude that their CMG system may provide
a subjectively good or mediocre gaming experience in
Wi-Fi and cellular networks, respectively. In contrast
to our work, which considers public cloud gaming
providers and the local execution of games, Wang and
Dey exclusively examine their own, proprietary cloud
gaming system.
Outside the academic world, West has measured
the latency of various locally executed games on a
PlayStation 3 console (West, 2008). West uses a com-
modity digital camera in order to take high-frequency
photographs of the game controller and the attached
screen during gameplay. Based on a subsequent man-
ual analysis of the resulting picture stream, he deduces
the timespan between a button press and the corre-
sponding action. West finds latencies between approx-
imately 50 and 300 ms on the PlayStation 3. The main
benefit ob West’s method is the clear separation be-
tween the gaming system and the measurement system.
In addition, the camera-based approach also permits to
capture the LCD response time. However, the accuracy
of the measurement is limited by the maximal fram-
erate of the camera. In addition, GALAMETO.KOM
only requires a brief preparatory manual tuning phase,
whereas West’s method requires substantial manual ef-
fort, which renders the collection of large data samples
difficult.
In summary, to the best of our knowledge, our work
is the first to empirically examine and systematically
compare the user-perceived latency for both cloud-
based and locally executed games. Our research results
thus permit us to objectively quantify the QoS impact
of moving games from a local computer to the cloud,
which can be a decisive factor for the acceptance of
cloud gaming among potential customers.
5 SUMMARY AND OUTLOOK
The cloud computing paradigm has substantially trans-
formed the delivery of IT services. A relatively new
service class within this context is cloud gaming. In
cloud gaming, video games are centrally executed in a
cloud data center and delivered to the customer as an
audio/video stream via the Internet. While this model
has many advantages both from a user and provider
perspective, it also introduces the Internet into the de-
livery chain, which may inflict the Quality of Service
for the user.
In this work, our focus was on the experimental
evaluation of user-perceived latency in cloud-based
and locally executed video games. For that mat-
ter, we created the semi-automatic measurement tool
GALAMETO.KOM. We conducted latency measure-
ment for two cloud gaming providers, using three dif-
ferent games and network types, respectively.
Our results indicate that cloud gaming exhibits
significantly higher latency than a local execution. Ab-
solute increases were in the range between 40 ms and
150 ms, while the the relative increases approximately
amounted to between 85% and 800%. The margin
between cloud providers and the local execution di-
minished with an improved network connection and
an increase in computational complexity of the game.
In our future work, we aim to substantially extend
our experiments through the consideration of addi-
tional games, providers, networks, and devices. In this
process, we will pursue a longitudinal design, which
CLOSER2013-3rdInternationalConferenceonCloudComputingandServicesScience
10

permits to identify time-dependent variations in la-
tency. We additionally strive to analyze the effects of
network disturbances, such as fluctuating bandwidth
or increased packet loss, on the QoS parameter of user-
perceived latency. Furthermore, we aim to examine
how cloud gaming providers can cost-efficiently pro-
vide their services under consideration of QoS aspects.
ACKNOWLEDGEMENTS
This work has been sponsored in part by the
E-Finance Lab e.V., Frankfurt am Main, Germany
(http://www.efinancelab.com).
REFERENCES
Buyya, R., Yeo, C., Venugopal, S., Broberg, J., and Brandic,
I. (2009). Cloud Computing and Emerging IT Plat-
forms: Vision, Hype, and Reality for Delivering Com-
puting as the 5th Utility. Future Generation Computer
Systems, 25(6):599–616.
Chen, K., Chang, Y., Tseng, P., Huang, C., and Lei, C. (2011).
Measuring the Latency of Cloud Gaming Systems. In
19th ACM International Conference on Multimedia.
Choy, S., Wong, B., Simon, G., and Rosenberg, C. (2012).
The Brewing Storm in Cloud Gaming: A Measurement
Study on Cloud to End-User Latency. In 11th Annual
Workshop on Network and Systems Support for Games.
Claypool, M. and Claypool, K. (2010). Latency Can Kill:
Precision and Deadline in Online Games. In First An-
nual ACM SIGMM Conference on Multimedia Systems.
Courcoubetis, C., Dramitinos, M., Stamoulis, G., Blocq, G.,
Miron, A., and Orda, A. (2011). Inter-Carrier Inter-
connection Services: QoS, Economics and Business
Issues. In 2011 IEEE Symposium on Computers and
Communications.
Dick, M., Wellnitz, O., and Wolf, L. (2005). Analysis of Fac-
tors Affecting Players’ Performance and Perception in
Multiplayer Games. In 4th ACM SIGCOMM Workshop
on Network and System Support for Games.
Dikaiakos, M., Katsaros, D., Mehra, P., Pallis, G., and Vakali,
A. (2009). Cloud Computing: Distributed Internet
Computing for IT and Scientific Research. IEEE Inter-
net Computing, 13(5):10–13.
Gaikai (2012). Gaikai.com :: History. http://
www.gaikai.com/history.
Greenberg, A., Hamilton, J., Maltz, D., and Patel, P. (2008).
The Cost of a Cloud: Research Problems in Data Cen-
ter Networks. ACM SIGCOMM Computer Communi-
cation Review, 39(1):68–73.
Jain, R. K. (1991). The Art of Computer Systems Perfor-
mance Analysis: Techniques for Experimental Design,
Measurement, Simulation, and Modeling. Wiley.
Jarschel, M., Schlosser, D., Scheuring, S., and Hossfeld, T.
(2011). An Evaluation of QoE in Cloud Gaming Based
on Subjective Tests. In 5th International Conference on
Innovative Mobile and Internet Services in Ubiquitous
Computing.
Kirk, R. (2007). Statistics: An Introduction. Wadsworth
Publishing, 5th edition.
Mell, P. and Grance, T. (2011). The NIST Definition of
Cloud Computing – Special Publication 800-145. Tech-
nical report, National Institute of Standards and Tech-
nology.
Ross, P. (2009). Cloud Computing’s Killer App: Gaming.
IEEE Spectrum, 46(3):14.
S
¨
uselbeck, R., Schiele, G., and Becker, C. (2009). Peer-to-
Peer Support for Low-Latency Massively Multiplayer
Online Games in the Cloud. In 8th Annual Workshop
on Network and Systems Support for Games.
Tanenbaum, A. S. (2003). Computer Networks. Pearson
Education, 4th edition.
Wang, J. (2012). NVIDIA GeForce GRID – A Glimpse
at the Future of Gaming. http://www.geforce.com/
whats-new/articles/geforce-grid.
Wang, S. and Dey, S. (2009). Modeling and Characteriz-
ing User Experience in a Cloud Server Based Mobile
Gaming Approach. In 2009 IEEE Global Telecommu-
nications Conference.
West, M. (2008). Measuring Responsiveness in Video
Games. http://www.gamasutra.com/view/feature/
132122/measuring responsiveness in video .php.
Wilson, D. (2009). Exploring Input Lag Inside and Out.
http://www.anandtech.com/show/2803/7.
Xiao, X. (2008). Technical, Commercial and Regulatory
Challenges of QoS: An Internet Service Model Per-
spective. Morgan Kaufmann.
All online references in this paper were last accessed
and validated in January 2013.
APPENDIX
Please refer to the next page.
ToFragortoBeFragged-AnEmpiricalAssessmentofLatencyinCloudGaming
11
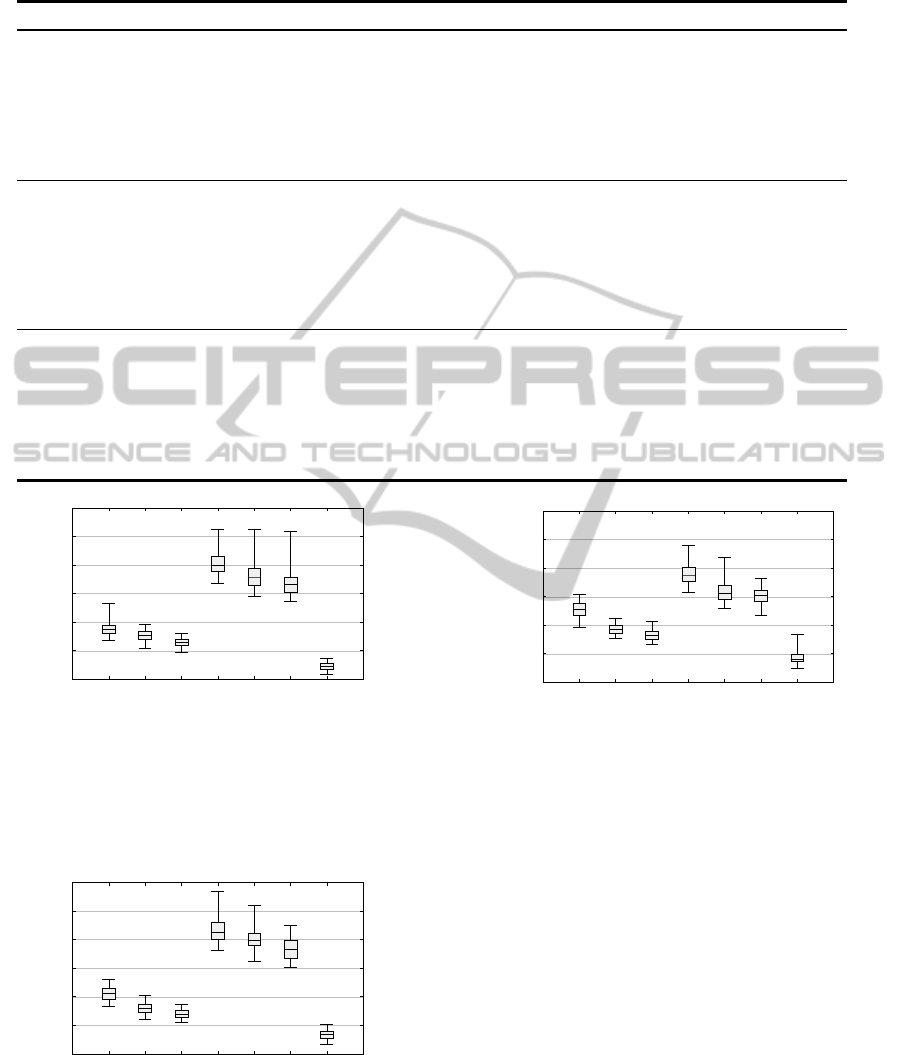
Table 1: Detailed results for the independent variable latency per test case (in ms). Abbreviations: SG – Shadowgrounds; SGS –
Shadowgrounds Survivor; CI95 – Radius of the 95% confidence interval; Pc. – Percentile.
Game Provider Network Mean CI95 2.5th Pc. 25th Pc. Median 75th Pc. 97.5th Pc.
SG CGP-A UMTS 93.65 6.49 68.98 81.06 87.49 95.00 132.66
SG CGP-A LTE 76.39 1.34 55.04 69.74 76.65 83.19 96.76
SG CGP-A VSDL 64.39 0.98 48.01 59.05 64.52 69.96 79.75
SG CGP-B UMTS 205.34 3.00 167.71 189.81 200.33 216.11 262.00
SG CGP-B LTE 181.47 3.20 145.54 163.79 179.08 193.80 263.31
SG CGP-B VSDL 170.09 3.29 136.85 151.75 166.23 178.13 259.15
SG Local N/A 22.13 0.93 7.91 17.46 22.68 27.80 36.00
SGS CGP-A UMTS 106.19 1.61 83.63 96.21 106.89 115.02 130.41
SGS CGP-A LTE 80.41 1.40 60.26 72.82 79.59 87.32 102.33
SGS CGP-A VSDL 70.43 1.00 56.06 64.66 70.00 76.13 86.90
SGS CGP-B UMTS 217.63 3.27 182.11 200.11 213.73 231.18 285.12
SGS CGP-B LTE 201.58 2.85 161.56 189.64 198.71 210.90 261.06
SGS CGP-B VSDL 184.45 2.73 150.83 167.37 183.18 199.11 224.45
SGS Local N/A 33.79 1.11 16.64 27.69 34.03 39.98 51.08
Trine CGP-A UMTS 128.13 1.91 95.56 117.01 128.43 139.00 153.98
Trine CGP-A LTE 93.06 1.31 76.26 85.96 93.24 99.48 112.61
Trine CGP-A VSDL 82.88 1.25 67.05 75.82 82.03 88.62 106.85
Trine CGP-B UMTS 189.58 2.57 157.01 176.04 187.87 201.02 239.97
Trine CGP-B LTE 160.76 3.11 130.12 145.36 156.74 169.60 219.02
Trine CGP-B VSDL 151.69 2.01 118.01 141.79 152.10 161.56 181.86
Trine Local N/A 44.68 1.83 25.14 35.90 41.01 49.29 84.01
0
50
100
150
200
250
300
CGP-A
UMTS
CGP-A
LTE
CGP-A
VSDL
CGP-B
UMTS
CGP-B
LTE
CGP-B
VSDL
Local
N/A
Latency [ms]
Provider, Network
Figure 4: Box-and-whisker plot of latencies for the game
Shadowgrounds per test case (sample size
n = 250
). The box
indicates the 25th and 75th percentiles, whereas the whiskers
mark the 2.5th and 97.5th percentiles. The median, i. e., 50th
percentile, is denoted by a horizontal bar within the box.
0
50
100
150
200
250
300
CGP-A
UMTS
CGP-A
LTE
CGP-A
VSDL
CGP-B
UMTS
CGP-B
LTE
CGP-B
VSDL
Local
N/A
Latency [ms]
Provider, Network
Figure 5: Box-and-whisker plot of latencies for the game
Shadowgrounds Survivor per test case (sample size
n = 250
).
Same notation as in Figure 4.
0
50
100
150
200
250
300
CGP-A
UMTS
CGP-A
LTE
CGP-A
VSDL
CGP-B
UMTS
CGP-B
LTE
CGP-B
VSDL
Local
N/A
Latency [ms]
Provider, Network
Figure 6: Box-and-whisker plot of latencies for the game
Trine per test case (sample size
n = 250
). Same notation as
in Figure 4.
CLOSER2013-3rdInternationalConferenceonCloudComputingandServicesScience
12
