
Outdoor 3D Acquisition System for Small and Fast
Targets: Application to Honeybee Monitoring at the
Beehive Entrance
Guillaume Chiron, Petra Gomez-Kr¨amer and Michel M´enard
L3I, Universit´e de la Rochelle, Avenue M. Cr´epeau, La Rochelle, France
Abstract. In response to recent biologists needs, we propose to lay the foun-
dations of a stereo vision-based system for monitoring honeybees in 3D at the
beehive entrance. In this context, this article highlights difficulties and introduces
some solutions for problems related to the detection of the bees and tracking them
in 3D under uncontrolled conditions. This study is a prerequisite for our next step
that aims to detect and analyze behaviors of the bees based on their trajectories
and additional external data such as the weather or health conditions.
1 Introduction
The honeybee is a bio-indicator species, and nowadays researchers use beehives for en-
vironment monitoring purpose. An overdose of contaminants in the environment could
result in bees excessive death-rate or behavior alterations. Behavior alterations are more
and more spotted despite the difficulties of observing them at a big scale. Thus, in re-
sponse to biologists’ needs, it becomes essential to collect data on bees at different lev-
els: numbers of bees, trajectories and behaviors. When done manually on videos, this
process is time consuming and suffers from a lack of precision due to human errors. We
believe that computer vision can effectively achieve those tasks.
Monitoring bees automatically in a outdoor uncontrolled environment arises a lot of
constraints. Bees are small are fast targets and their motions could be chaotic. The high
activity especially on front of the beehive results in a high occlusion rate. Working in
natural conditions also raises problems such as background soiling.
Counting bees has been the first automatic application technically feasible. [1] in-
troduced the first functionally mechanical counter. Nowadays, the less intrusive infrared
sensors counters presented in [2] are widely used. A new category of counters are also
able to identify bees individually by radio frequency identification (RFID) [3].
Vision based bee trajectory analysis is recently having a growing interest. The lit-
erature covers important methods for 2D tracking and behavior analysis of bees inside
the beehive. In [4], bees are tracked using a hybrid particle filter. [5] proposes a method
based on hidden markov models (HMM) to detect bees’ behavior from their trajectories.
[6] goes further by introducing a joint tracking and behavior analysis. In addition to that
work, [7] adds geometric constraints and an weighted adaptive pattern to enhance the
detection.
Chiron G., Gomez-Krämer P. and Ménard M..
Outdoor 3D Acquisition System for Small and Fast Targets: Application to Honeybee Monitoring at the Beehive Entrance.
DOI: 10.5220/0004346300100019
In Proceedings of GEODIFF 2013 (GEODIFF-2013), pages 10-19
ISBN: 978-989-8565-49-5
Copyright
c
2013 SCITEPRESS (Science and Technology Publications, Lda.)

Recently, [8] introduces a non-invasivevideo monitoring system that tracks bees on
front of their beehive for a counting purpose. This application is based on a classic 2D
vision acquisition system and uses global nearest neighbor (GNN) and interactive mul-
tiple model (IMM) comparable methods to track the multiple targets. The preliminary
counting error rate results presented are still below the other counters. In [9], the authors
attempted to track bees visiting flowers. This application is mono target and provides
short and noisy trajectories which are not suitable for behavior analysis.
Our work takes place in the context of an environment monitoring platform illus-
trated by Figure 1. The main purpose of the platform is to cross data and to make it
available to biologists. [10] introduced a first block: a robust vision based bee counter.
A RFID version of the counter will be added in a near future thanks to a partnership
(INRA institute). Blocks such as an air quality monitor are also planned to be linked to
the platform. Our beehive monitoring system is one of the blocks under construction.
This block could also use data from other blocks to improve their process. For example,
the temperature, the time of the day and the historical data could be used to choose a
adapted bee’s motion model to improve the tracking.
Fig.1. Environmental monitoring platform sharing information with different blocks. This article
introduces the base for the beehive monitoring system block.
The purpose of our project is to analyse behaviors of honeybees on front of the
beehive. We introduce in this article the base for a beehive activity monitoring system
and highlight the advantages and drawbacks of using a 3D vision for that application.
This article is organized as follows. We present our 3D acquisition system in Section
2. Sections 3 and 4 introduce the segmentation and the tracking methods used. Section
5 shows some preliminary results. Finally, Section 6 concludes by opening promising
perspectives about tracking and behavioral analysis.
2 Acquisition System
We present in this section the constraints linked to the application. Then we summarize
suitable 3D sensors available on the market in 2012. Finally we focus on a stereo vision
system and its configuration.
2.1 Application Constraints
Several constraints have to be taken into account for the choice of the 3D camera like
the number, the size, the dynamic of the targets, the lighting conditions and the scene
background. Each constraint is outlined in the following.
11
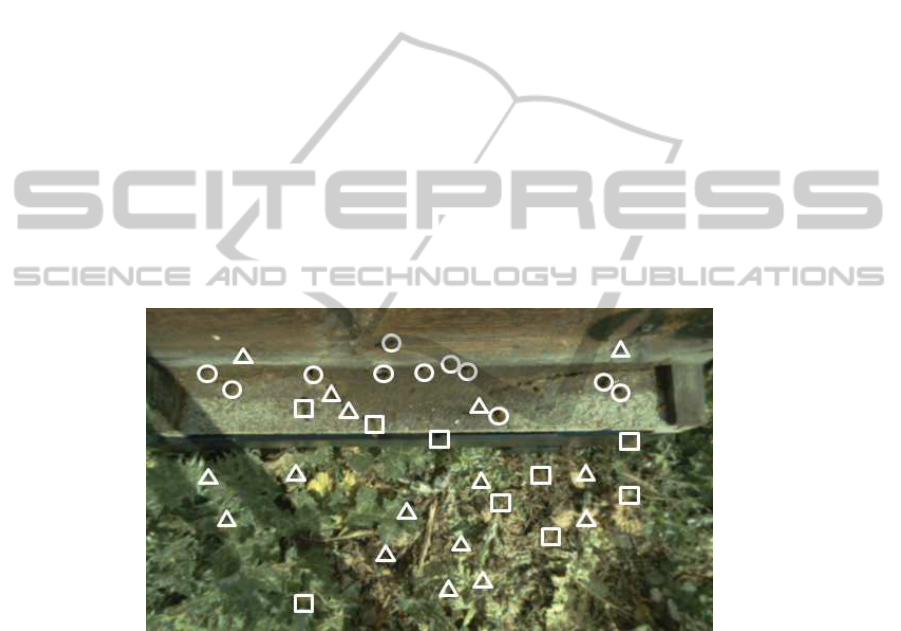
Number. Figure 2 shows an high activity on front of the beehive. The bee counter [10]
reveled that bees’ arrivals and departures could occur by important waves. This big
amount of target evolving in 3D results in many occlusions.
Size. To assure counting purpose, the camera needs to capture the entire 50 cm wide
board from where bees get in and out. Adult bees measure in average 12*6 mm and to
be detected on the flight board, we set a limit of 6 pixels per bee on the images. Thus,
XcamResolution=(6 px/0.6 cm)*50 cm=500 px is the minimum resolution satisfying
that small sized target constraint.
Dynamic. Bee motion is barely predictable. Theycan fly at speed of 8 m/s, so theycould
cross the whole flight board and being only captured on 1 or 2 images with a classic
24 frame/sec sensor. Even if we observed mostly slower bees around the beehive, a
high frequency capturing system is recommended. An average exposure time results in
blurring for wings flapping but that not important for our application.
Light. Captures are performed outdoor, so lighting conditions are not controllable. Im-
ages could contain more bees’ shadows than bees themselves. The sunlight interferes
with 3D sensors technologies such as infrared grid projection/sensors (e.g. Microsoft
Kinect).
Background. [8] segment the bees from a white flight board which is an optimal con-
dition. Our application aims to work on a textured flight board (e.g. due to dirt) which
could become similar to bees’ color.
Fig.2. Beehive entrance captured by a 2D camera. Circles mark 11 walking bees; squares mark
8 flying bees; triangles mark 13 bee shadows.
According to the constraints mentioned above, we believe that especially the high
occlusion rate and the chaotic dynamic of the targets require another additional data
(3rd dimension) to assure a robust detection and tracking of the targets.
2.2 Candidate 3D Sensors
We focus our attention on two kinds of 3D sensors (also called 2.5D sensors): time of
flight (TOF) and stereo vision cameras. Contrary to a homemade multiple camera sys-
tems [11], those built-in 3D cameras don’trequire any calibration and directly provide a
12
depth map and gray (or RGB) images corresponding. As we later focus on stereo vision
systems, additional information on TOF cameras are given in [12].
Table 1. Comparison of 6 camera configurations (resolution and frame rate) proposed by leaders
of TOF and stereo vision systems in 2012.
Time of flight Stereo vision
Cb. Nano (Pmdtec), 160x120px,90fps
Bum.Bee 2 (P.Grey), 640x480px,48fps
D70 (Fotonic), 160px*120px, 50fps
G3 EV (TYZX), 752x480px, 50fps
SR4000 (Mesa), 176px *144px, 50fps
SVC (F.Robotics), 752x480px, 30fps
The resolution of TOF cameras presented in Table 1 are too low for our applica-
tion because the requirement of the representation of a bee by 6 pixels is not satisfied.
Nevertheless, the high frame rate of the Cb. Nano kept our attention. Capturing a fast
moving object at a speed of 90 fps would reduce tracking failures. In that case we would
focus on a smaller part of the flight board to get enough pixels to detect a bee. Then,
we also retain the stereo vision G3 EV that seems to satisfy the small and fast target
constraints.
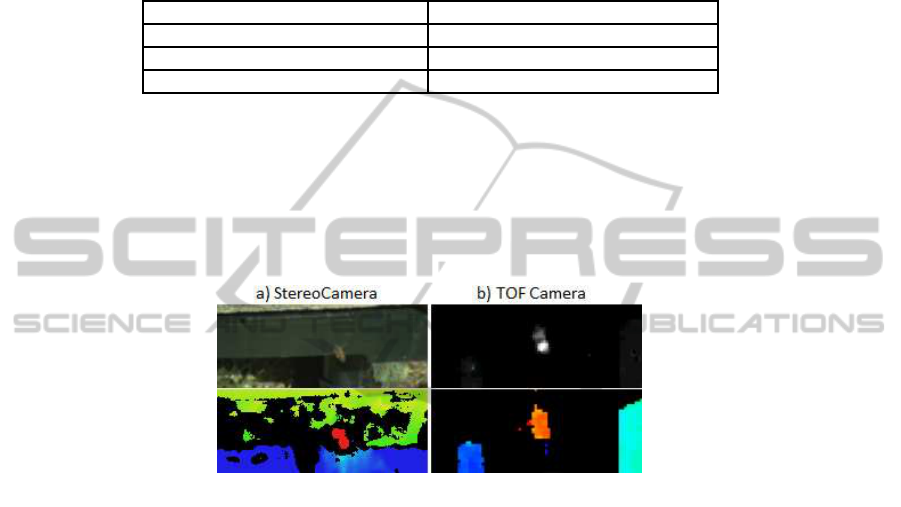
Fig.3. Images (top row) and depth maps (bottom row) captured by Cb.Nano (TOF) and G3 EV
(stereo vision) for a sample bee.
Figure 3 shows some images and depth maps respectively acquired by the G3 EV
and CamBoard Nano cameras. The image a) provides a clear RGB image while the
image b) provides an intensity map limited by the amount of light received by the
sensor. The depth map a) is well computed on highly textured areas. In reasonable
conditions (targets closer than 50 cm from the camera and moving at an average speed),
bees’ textures are well captured and thus left and right images are correctly matched.
The close detection range of 2 m of b) filters the main part of the background. Then,
depth for white or reflecting objects is not well captured. Also, targets getting far from
the center tend to be not clearly captured by the sensor. Finally, stereo cameras have
a lower frame rate than TOF cameras due to the depth map computation complexity.
The G3 EV reaches 50 fps thanks to an embedded processors unit. Table 2 summarizes
the strengths and weaknesses of both cameras tested and evaluated according to our
application constraints.
So far, the G3 EV stereo camera is the best compromise to capture high resolution
images and depth maps at a correct frequency.
13
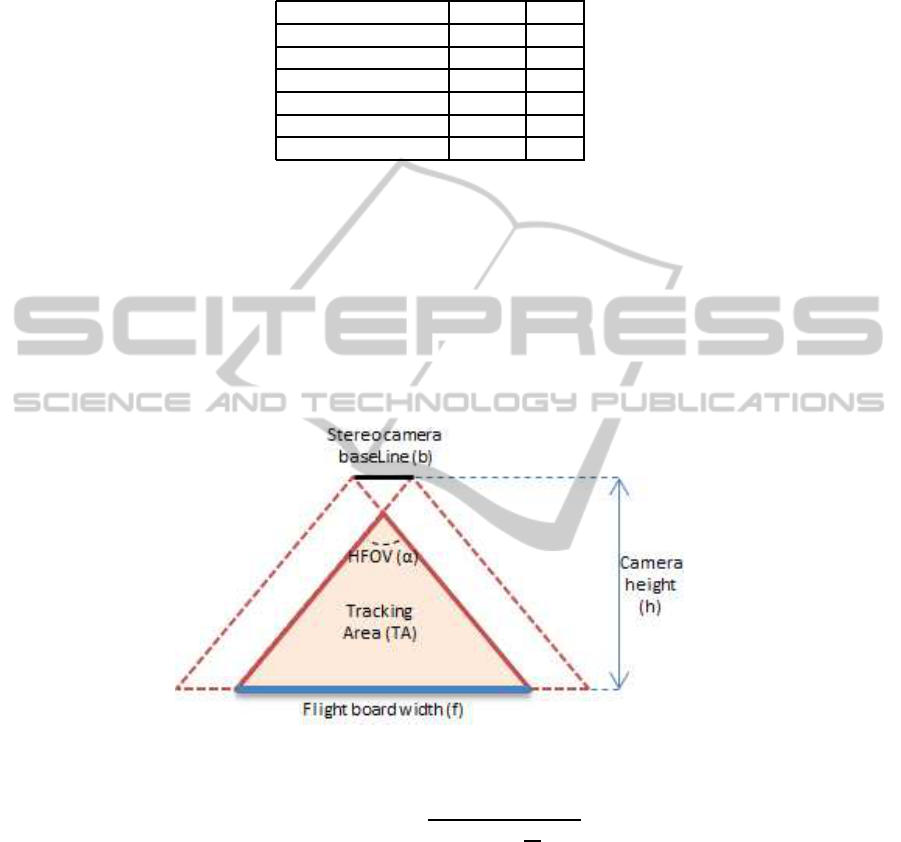
Table 2. Compared capture with TOF (CamBoard Nano) and stereo vision camera (G3 EV)
according to our application constraints.
Cb. Nano G3 EV
Frame rate +++ ++
Resolution + +++
Small targets detection +++ +++
Fast targets detection +++ ++
Depth map accuracy ++ +++
Depth map consistency +++ ++
2.3 Stereo Camera Configuration
Figure 4 shows the configuration of the stereo camera targeting the flight board. We
choose a small baseline which is more accurate for close rang applications. Then, ac-
cording to the lenses available from the constructor, we find the best solution to max-
imize the tracking area TA=(f/2)
2
/tan(α/2) keeping at least 6 pixels per centimeters on
the flight board using (1) to be able to detect the bee correctly. Finally the chosen con-
figuration for this application is a 3 cm baseline camera equipped with 62 degree HFOV
lenses placed at a height of 50 cm from the flight board.
Fig.4. Stereo camera configuration.
P ixelP erCm =
XcamResolution
2h tan
∝
2
(1)
The stereo camera computes the depth image using patch matching algorithms be-
tween the right and left images. As shown in Figure 5, different effects are observable
on the depth map according to the situation. The background part hidden by a target
is different according to the point of view the target is observed from. For every flying
target, the depth map shows the target distance as well as a depth shadow region corre-
sponding to the unmatched background. Thus, as well as normal distance information,
depth shadowareas on the depth map can witness the presence of targets. Sometimes the
14
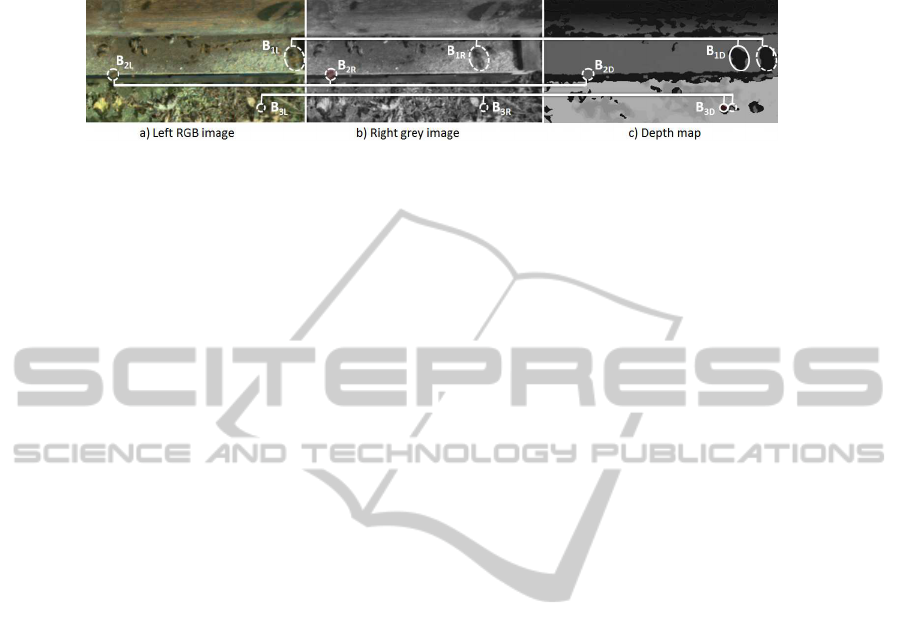
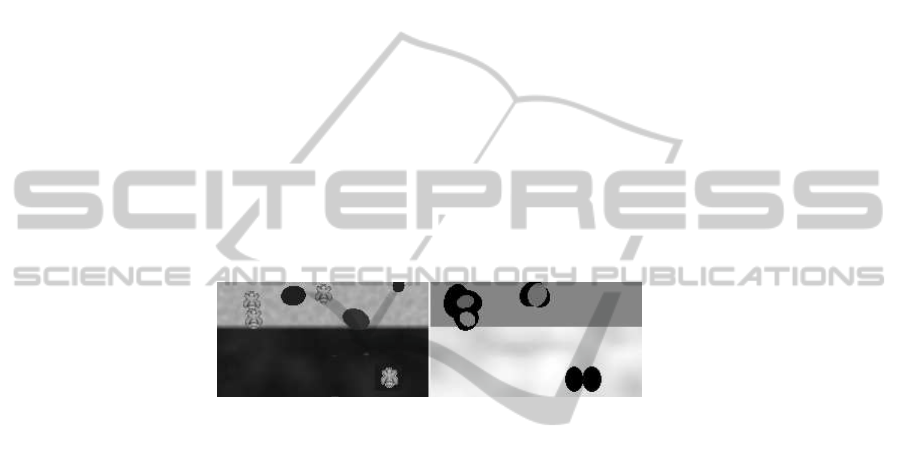
Fig.5. Different depth map effects observed with the G3 EV camera. B
1
(high speed target) isn’t
matched between a) and c), and it results in the right shadow effect on c), plus its high height from
the background produces the additional left shadow effect. B
2
(non moving target) is correctly
matched but being closed the background, no shadow effect is observed. B
3
(normal speed target)
is half matched and produces a double shadow effect for the same reasons as B
1
.
matching step fails and wrong patches are associated together, it results in inconsistent
depth regions.
3 Segmentation
The bee segmentation step takes advantage of the 3D information available. A color
motion mask and depth mask are combined using adaptive thresholding to detect walk-
ing bees and flying bees. Then centroids (X,Y) of every region define the 2D position
of the targets. The 3rd coordinate Z (depth value) of the target is the median value of
the corresponding region on the depth map.
3.1 Color Motion Mask
In [4] and [8], bees are detected by pattern matching using respectively eigenbee and
ovalgraduate template overa backgroundsubtraction. A comparativestudy of advanced
background subtraction methods is done in [13]. To succeed in outdoor conditions (e.g.
unstable light, grass moving with wind), background subtraction methods need to be
performedon a small temporal window. Problems arise for non-movingtargets like fan-
ning bees. We prefer to use a less computationally demanding temporally local method:
cM ask = (|I
t−1
− I
t
| > s) & (|I
t+1
− I
t
| > s) (2)
where I
t
is the image at time t and s is the motion detection threshold. Low thresholds
enable small changes detection (e.g. fanning bees that are constantly flapping wings),
and high thresholds just detect flying and walking bees. The hue could be used to filter
bee shadows, but it tends to overestimate motions when the saturation has a low value.
Therefore a combined hue and gray mask is preferable. Filtering and morphological
operation are applied to the motion mask to filter the noise.
3.2 Depth Mask
Flying bees produce either a local distance peak or depth shadow areas (e.g. matching
failure due to speed) on the depth map. As explained in Section 2.3, high bees also
15

produce a second depth shadow area on the same horizontal line due to background
mismatching. The flying mask dM askF is obtained by:
dMaskF = (D
t
+ b < D
m
) k (D
t
= 0 & D
m
= 0) (3)
where D
t
is the depth map at time t, D
m
is the median depth map over a time period
and b a depth detection threshold. Afterwards, morphological opening is applied to the
mask.
Walking bees produce mainly a distance peak that is more or less observableaccord-
ing to quality of the backgroundmatching. The walking mask dM askW is obtained by
applying following operations: blurring, morphological erosion and peak detection.
4 Tracking
We use the widely spread GNN association method summarized in [14] based on a
Kalman Filter with a constant speed model for tracking. Our GNN chooses the best
association hypothesis between tracks and observation according to their probabilities
using the Hungarian Algorithm. The following statistical distance is used:
d
2
ij
= (Y − M X
+
)
′
S
−1
(Y − M X
+
) (4)
It represents the association cost between the predicted position i and the observation
j, where Y is the observation, M the measurement matrix, X
+
the predicted position
a priori and S the innovation covariance defined by S = M E
+
M
′
+ Em with Em
the measure noise matrix and E
+
the predicted noise covariance matrix. The costs of
new targets and false alarms are linked to the probability density functions β
NT
and β
FA
.
Associated observations are processed using target’s Kalman Filter, and non-associated
observations become candidates for a new track.
Kalman filters are tuned as followed: The initial noise matrix has to be especially
high in order to handle high speed target entering the screen. As bees’ motions seem
chaotic outside the beehive, the model noise matrix also needs to be very high. In op-
posite, measures are relatively accurate (expect in case of merged observations) so the
measure noise matrix could be low.
With camera captured data, bee coordinates (X,Y) and Z are respectively pixels in
the image reference and millimeters in the camera based reference. A projection of X
and Y can be done using the intrinsic camera parameters :
posXY = F (camXY − cXY )Z (5)
where cXY is the projected optical center of the camera and F the focal distance. When
measure of Z is unavailable (depth shadow effect), we take the predicted Z from the
Kalman filter (state and error covariance) directly to the next prediction step, so the
correction step is skipped for Z.
16
5 Preliminary Results
A ground truth is needed to evaluate the results for counting and tracking. Labeling
video frames over a long period of time is not feasible especially in cluttered situations.
Moreover manual labeling is source of error, when estimating counting error rate of
counters, human counting error is usually taken in account in the estimation. To get
around those problems, we made a simulator that produces comparable honeybee tra-
jectories and corresponding color images and depth images as the 3D camera would
capture. Compared to labeled data, simulated data has the advantage to be scalable and
easily tunable.
Simulated bees tend to reach a random goal which changes time to time. A constant
speed motion model is used and noise is injected to randomize the trajectories. Shownin
Figure 6, the color image is simply built up using bee images well resized according to
its 3D position (X,Y,Z). The depth image is made up following the 3D camera shadow
rules. For example, if the bee is far away from the ground, the matching between left
and right frame can not be done for the background behind the bee that is observable on
the image. In this case the bee produces a depth shadow area on its side. Then the blur
effect due to the speed or of wings flapping could also result in a non-matching area as
well.
Fig.6. Images and depth map produced by the simulator.
The following results are preliminary, and conditions for the real captured data were
absolutely uncontrolled. For example, some plant’s stem could exceed the height of the
flight board resulting in more false alarms. Bees half positioned in the entrance of the
beehive are left apart in the statistics. They don’t exhibit any interesting behavior and
their detection is even manually difficult.
5.1 3D Bee Detection
This part shows the performance of the 3D bee detection step. It especially witnesses
the proportion of hazardous depth detection for overlapping bees. Miss detected bees is
not a main issue since no counting step is done on every frame in a absolute manner.
It will only result in no association during one or few tracking steps. Following figures
are an average number of bee per frame over a sequence of frame.
Simulated. Over 200 simulated frames with a constant number of 15 moving bees, 0.5
bee per frame are over detected and the Z coordinate is not well detected on 1.7 bee.
Real Data. Over 10 frames picked up randomly from a captured video. In average,
a frame contains around 13 targets, 2.7 bees per frame are over detected and the Z
coordinate is not well detected on 2.3 bees.
17

5.2 3D Tracking
This part shows the performance of the tracking step taking the advantage of the 3D
information.
Simulated Data. Table 3 shows the advantage of having 3D information for a target
with an high occluding rate. Results have been established using the measures from
simulated trajectories over 500 frames on 50 frames track lengths. For small amounts
of bees, better 2D tracking results are explained by the more restrictive gating step in
3D than in 2D. Under real conditions, 3D information is not constantly available so we
can expect lower results. But the 2D less accurate measures would also make the 2D
tracking maintenance rate decrease.
Real Data. Since no trajectory ground truth has been established, it is difficult to esti-
mate the results of tracking. We estimate that 80% of the bees are well tracked.The 20%
failure is mainly is due to high speed targets, long miss detection, complex scenarios
(e.g. triple crossing).
Table 3. Comparative track maintenance rates between 2D or 3D tracking on simulated observa-
tions. Tracks represent the number of track generated over the 500 frames. Bees represents the
number of bees flying simultaneously in the area.
Bees(tracks) 2(18) 5(50) 10(89) 20(157) 30(236)
2D tracking 100% 98% 88% 88% 78%
3D tracking 94% 95% 96% 93% 91%
6 Conclusions
Our work takes place in the context of an environment monitoring platform. The pur-
pose of the project is to analyse the behavior of bees using to their trajectories and
other data provided by the platform. This article positions the base for a 3D monitoring
system at the beehive entrance including: 3D capture, bee detection and tracking. De-
tection and tracking algorithms are still in a early state, but the preliminary results and
following perspectives are promising.
6.1 Perspectives
In complex tracking situations (e.g. Z info missing, 3 bees overlapping), our GNN
method reaches its limit. We are currently working to use a combined MHT-IMM track-
ing method to improve tracking results.
This work is a preliminary for a behavioral analysis. Based on 3D trajectories col-
lected, we will be able to build a database of bees’ behaviors of front at the beehive
entrance. To ensure the feasibility of behavior identification of bees outside the bee-
hive, we will implement a behavior recognition system based on HMM as the image of
[5]. Then as [8] or [6], we plan to take advantage of the behavior knowledge to improve
the tracking step. The first idea is to drive the choice of the motion model in IMM. To
go further, we also plan to use data coming from the platform such as weather, historical
behaviors and even crossed data between beehives.
18

References
1. Chauvin, R.: Sur la mesure de l’activit´e des abeilles au trou de vol d’une ruche a dix cadres.
Insectes Sociaux 23 (1976) 75–81
2. Struye, M., Mortier, H., Arnold, G., Miniggio, C., Borneck, R.: Microprocessor-controlled
monitoring of honeybee flight activity at the hive entrance. Apidologie 25 (1994) 384–395
3. Streit, S., Bock, F., Pirk, C., Tautz, J.: Automatic life-long monitoring of individual insect
behaviour now possible. Zoology 106 (2003) 169–171
4. Khan, Z., Balch, T., Dellaert, F.: A rao-blackwellized particle filter for eigentracking. In:
Conference on Computer Vision and Pattern Recognition (CVPR). Volume 2., IEEE (2004)
II–980
5. Feldman, A., Balch, T.: Representing honey bee behavior for recognition using human train-
able models. Adaptive Behavior 12 (2004) 241–250
6. Veeraraghavan, A., Chellappa, R., Srinivasan, M.: Shape-and-behavior encoded tracking of
bee dances. Transactions on Pattern Analysis and Machine Intelligence (PAMI) 30 (2008)
463–476
7. Maitra, P., Schneider, S., Shin, M.: Robust bee tracking with adaptive appearance template
and geometry-constrained resampling. In: Workshop on Applications of Computer Vision
(WACV), IEEE (2009) 1–6
8. Campbell, J., Mummert, L., Sukthankar, R.: Video monitoring of honey bee colonies at the
hive entrance. Visual observation & analysis of animal & insect behavior (ICPR) (2008)
9. Estivill-Castro, V., Lattin, D., Suraweera, F., Vithanage, V.: Tracking bees-a 3d, outdoor
small object environment. In: Conference on Image Processing (ICIP), IEEE (2003) 1021–
1024
10. Blois, J.: Vid´eosurveillance d‘abeilles, comptage d‘entr´ees/sorties `a l‘entr´ee de la ruche.
(2011)
11. Nummiaro, K., Koller-Meier, E., Svoboda, T., Roth, D., Van Gool, L.: Color-based object
tracking in multi-camera environments. Lecture Notes in Computer Science (2003) 591–599
12. Piatti, D.: Time-of-Flight cameras: test, calibration and multi-frame registration for auto-
matic 3D object reconstruction. PhD thesis, Politecnico di Torino, Italy (2011)
13. Parks, D., Fels, S.: Evaluation of background subtraction algorithms with post-processing.
In: Conference on Advanced Video and Signal Based Surveillance (AVSS), IEEE (2008)
192–199
14. Blackman, S., Popoli, R.: Design and analysis of modern tracking systems. Volume 685.
Artech House Norwood, MA (1999)
19
