
Evaluation of an Augmented-Reality-based 3D User Interface to Enhance
the 3D-Understanding of Molecular Chemistry
Patrick Maier and Gudrun Klinker
Fachgebiet Augmented Reality (FAR), Technische Universit
¨
at M
¨
unchen, Fakult
¨
at f
¨
ur Informatik,
Garching bei M
¨
unchen, Germany
Keywords:
Direct Manipulation, 3D User Interface, Augmented Chemical Reactions, Evaluation, Augmented Reality.
Abstract:
The spatial understanding of chemical molecules is crucial for learning chemistry at school. With a good
3D understanding of molecules, chemical processes become obvious compared to a 2D representation in
textbooks or just the molecular formula. With the increasing spread of computers, smartphones and tablets,
the field of computer aided learning becomes more and more important. Common molecular viewers such as
Jmol (Jmol, 2012) present chemical simulations as 3D renderings on a regular computer screen in combination
with desktop-based user interfaces using a mouse and a keyboard to manipulate 3D molecules. Such interfaces
may be cumbersome to use since users have to associate 2D mouse motion and key presses with 3D object
motions. In this paper we investigate the hypothesis that the understanding of spatial structures of molecules
is enhanced by Augmented-Reality-based 3D user interfaces with which students can directly manipulate the
virtual 3D molecules by freely moving and rotating a 3D object in air with their hands. Our results show
that a direct manipulation 3D user interface improves the 3D understanding in comparison to the traditional
desktop-based user interface with mouse and keyboard.
1 INTRODUCTION
To support students learn chemistry, we have to help
them understand the spatial structure of molecules.
Knowing the 3D structure of molecules is impor-
tant to understand the chemical behavior and prop-
erties of the molecules. Learning the 3D structure
of molecules just by looking at the 2D drawings or
formulas of the textbook seams not to be the best
method.
Hardware representations that the students can
touch have been a well-established method in chem-
istry education for a long time. Yet, such hardware
models are not always available, and it is time con-
suming to build them for each student and for each
molecule. Furthermore, such hardware representa-
tions are mostly not flexible or dynamic in their struc-
ture.
As computers get more powerful and mobile, in-
teractive 3D representations of the molecules are able
to provide a better way for students to inspect and un-
derstand the 3D structures. Applications can show
complex molecules and animations that the students
can inspect. But there is a drawback in the classical
3D presentation programs: the molecules can only be
rotated and moved via the mouse and the keyboard.
This indirect mapping of mouse movements to the 3D
model is not always intuitive. Students have to learn
the mapping of 2D mouse movements and keystrokes
to 3D object manipulations involving six degrees of
freedom. As a result, some of the students’ focus may
be diverted from the molecules to the user interface,
and the structure of the molecules may not be made
completely clear.
To combine the benefits of the physical molecule
representations with the power of computers, there
are direct manipulation 3D user interfaces which use
Augmented Reality and tracked real objects to control
the position and orientation of the molecules.
In this paper, we report on evaluating the Aug-
mented Reality based 3D user interface of the Appli-
cation Augmented Chemical Reactions (ACR) against
the mouse and keyboard based user interface of the
Application Jmol (Jmol, 2012). The evaluation took
place at a secondary school with a class of 14-15 year
old students of the 8th grade. In the next section, we
take a look at previous work in this field and we de-
scribe both types of 3D user interfaces.
294
Maier P. and Klinker G..
Evaluation of an Augmented-Reality-based 3D User Interface to Enhance the 3D-Understanding of Molecular Chemistry.
DOI: 10.5220/0004349502940302
In Proceedings of the 5th International Conference on Computer Supported Education (CSEDU-2013), pages 294-302
ISBN: 978-989-8565-53-2
Copyright
c
2013 SCITEPRESS (Science and Technology Publications, Lda.)
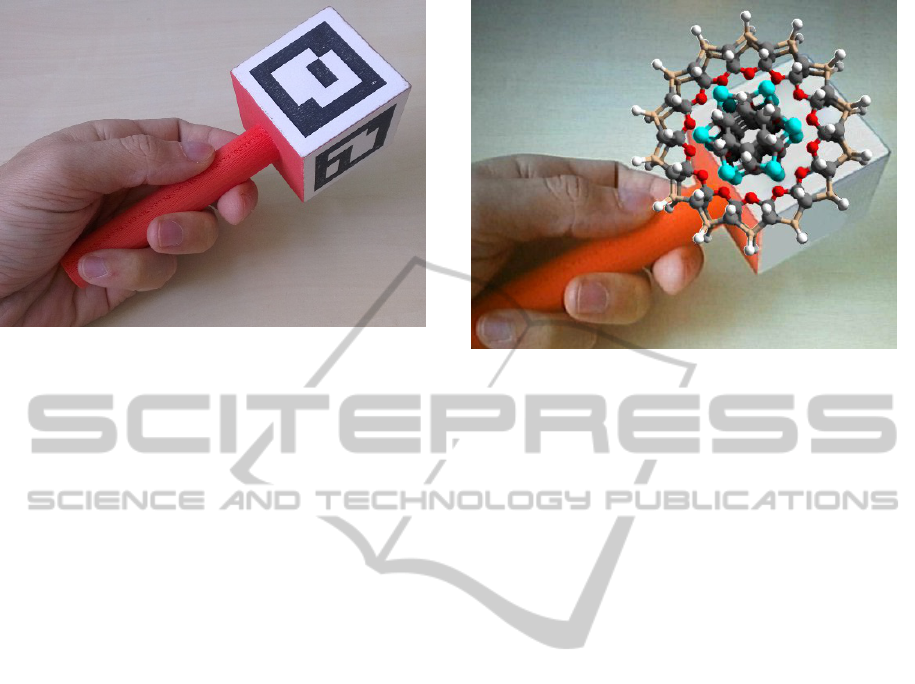
Figure 1: This device is tracked by a computer with a web-
cam. It is used as a 3D input device for direct manipulation.
2 BACKGROUND
Many schemes to support the learning progress of stu-
dents have been developed. To support the students in
understanding the spatial structure of molecules, the
most suitable methodologies have to be developed.
A number of research efforts have shown that using
physical models and therefore using direct manipu-
lation helps students explore and understand the spa-
tial structure of objects (Herman et al., 2006; Arnold
et al., 2012; Hoyek et al., 2011). It has also been
shown that a direct manipulation interface for rota-
tion via a sensor with 3 degrees of freedom (3 DoF)
yields better performance without lacking accuracy,
compared to 3D rotation via a mouse (Hinckley et al.,
1997). Work at the IBM Almaden Research Center
investigated the user performance of different 3D in-
put devices (Zhai, 1998).
2.1 Desktop-based user Interface with
Mouse and Keyboard
There are many applications that help users under-
stand the spatial structure and also the resulting dy-
namics of molecules (Panagiotopoulos et al., 2012;
Johnson et al., 2011; Jmol, 2012). Yet, the commonly
used user interface to rotate and move virtual objects
is still a combination of mouse and keyboard (Chen
et al., 1988).
2.2 3D Augmented-Reality-based user
Interface
To combine the advantages of the physical direct
manipulation with showing complex structures, Aug-
Figure 2: Augmentation of a protein molecule on top of the
marker cube.
mented Chemistry (Fjeld et al., 2007) and Augmented
Chemical Reactions (Maier et al., 2009b) (Maier
et al., 2009a) have been introduced. Both systems use
Augmented Reality to deliver a direct manipulation
3D user interface to control the position and orienta-
tion of the virtual objects.
Generally speaking, Augmented Reality adds vir-
tual information or objects interactively and in real-
time to the real world, generating the impression that
the added information is part of the physical world.
To this end, the application Augmented Chemical Re-
actions employs a physical cube with a handle that
is textured on all sides with black and white patterns
(Figure 1). In a typical setup, a student holds the cube
by the handle and manipulates it while sitting at a
desk in front of a monitor. A webcam records the
scene with the cube, and Augmented Chemical Re-
actions uses a marker tracking algorithm similar to
the AR-toolkit (Kato and Billinghurst, 1998; Pustka
et al., 2011) to detect and recognize the currently vis-
ible patterns on the cube. According to the size and
deformation of the patterns, the algorithm calculates
their position and orientation relative to the webcam
– and thus the pose of the cube and handle. With this
information, the virtual molecule can be drawn on top
of the webcam image, leading to the illusion, that the
molecule is attached to the cube (Figure 2). The vir-
tual molecule moves in unison with the physical cube.
This is a three-dimensional direct manipulation user
interface.
3 EVALUATION
We conducted a user study with 14-15 year old stu-
dents of a german gymnasium (secondary school) to
EvaluationofanAugmented-Reality-based3DUserInterfacetoEnhancethe3D-UnderstandingofMolecularChemistry
295
determine whether direct manipulation of the position
and orientation of virtual molecules leads to a better
spatial understanding of virtual molecules than input
via a standard mouse and keyboard. We selected a
class in the 8th grade – just at the time when they had
been taught the basic concept of what a molecule is,
but they had not learned yet about the spatial structure
of molecules. Therefore they were ideally suited for
a study investigating which of the two user interfaces
leads to a better 3D understanding of molecules.
None of them already had experience with Aug-
mented Chemical Reactions or the Jmol application.
Most of the students had lots of experience with play-
ing 3D games, but nearly none had already used to use
a 3D chemical modeling application or another 3D
design application. Only one student stated to have
already a good knowledge about the chemical struc-
tures of molecules. As his prior results in building
the molecules were already correct, he did not have
the change to improve. So this results could not be
used to get a measurement of the performance of the
application and thus was removed (see section 4.1).
3.1 Experimental Setup
In cooperation with a chemistry teacher, we selected
ten different molecules to be inspected in this study.
Those molecules were (1) Sulfur S
8
, (2) Methane
CH
4
, (3) Ethanol C
2
H
5
OH, (4) Acetic acid C
2
H
4
O
2
,
(5) Benzene C
6
H
6
, (6) Hydrogen sulfide H
2
S, (7)
Phosphor P
4
, (8) Phosphorus trifluoride PF
3
, (9) Hex-
ane C
6
H
1
4 and (10) Carbon tetrabromide CBr
4
.
We had two computer rooms, one for the Jmol and
one for the Augmented Chemical Reactions (ACR) ap-
plication. Each student desk was equipped with the
respective computer equipment.
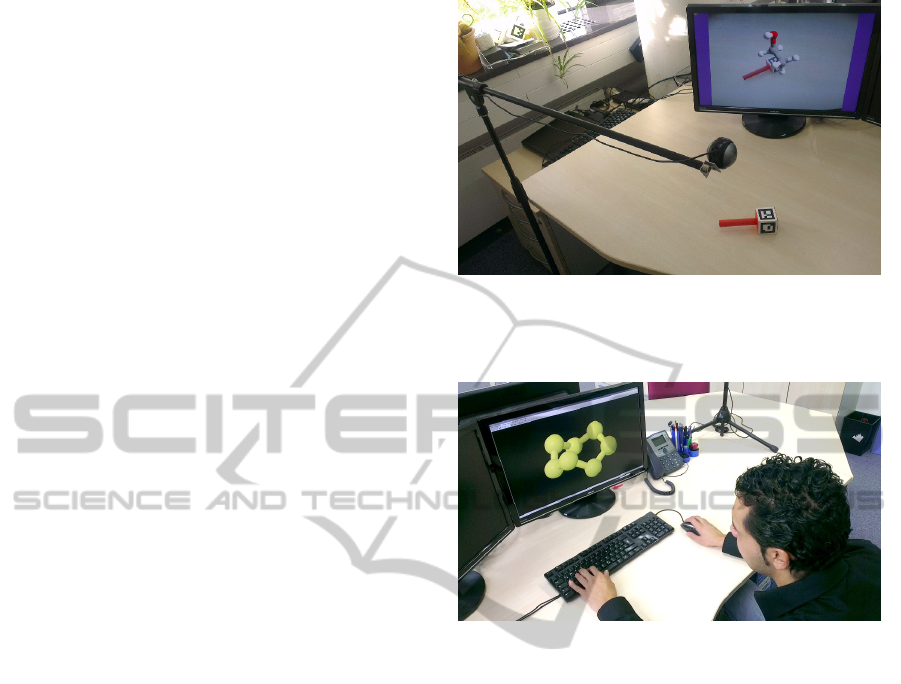
Computer Setup for ACR. The first computer room
was set up to run the ACR application with a 3D
direct manipulation user interface. Here a monitor,
a keyboard, and a marker cube with a handle were
placed on each student desk. A webcam on a mi-
crophone stand in shoulder height of a sitting per-
son faced towards the student desk and the marker
handle. To control the position and the orientation
of the virtual molecule, the students had to hold the
marker cube into the field of view of the webcam.
The video stream, augmented with the currently se-
lected molecule, was shown on the monitor in front
of the student, as shown in Figure 3. The students
could cycle through the set of molecules by pressing
the space-bar on the keyboard.
With a well-aligned arrangement of the cam-
era, the user, the hand-held handle and the moni-
tor, the AR illusion via a directly manipulated phys-
Figure 3: Computer setup for the ACR application, using
a webcam a physical cube on a handle and a monitor. The
keyboard that is required to cycle through a set of molecules
is not shown.
Figure 4: Typical setup to inspect and manipulate molecules
on a monitor via keyboard and mouse in the Jmol applica-
tion.
ical object can be maintained with minimal strain
on the hand-eye coordination. A more immersive,
perfectly aligned setup can be achieved when the
monitor-based arrangement is replaced with a video-
see-through or optical-see-through head-mounted dis-
play. Yet, such arrangements are costly and thus cur-
rently not deployable in classrooms. For this rea-
son, the current test setup was based on webcams and
monitors on student desks.
Computer Setup for Jmol. The second room was set
up to run the Jmol application (Jmol, 2012), using a
classical mouse and keyboard interface to manipulate
virtual 3D molecular structures on the screen. To this
end, a monitor, a mouse and a keyboard were placed
on each student desk. When started, Jmol showed
the first of the ten molecules, centered in the mid-
dle of the screen. By moving the mouse upwards
or downwards, the molecule rotated around its hori-
zontal axis. By moving the mouse leftwards or right-
wards, the molecule rotated around its vertical axis.
Schemes for translating and zooming molecules do
exist in Jmol, but they were not required in the cur-
rent setup. The students could view and explore the
molecule from all sides before switching to the next
CSEDU2013-5thInternationalConferenceonComputerSupportedEducation
296
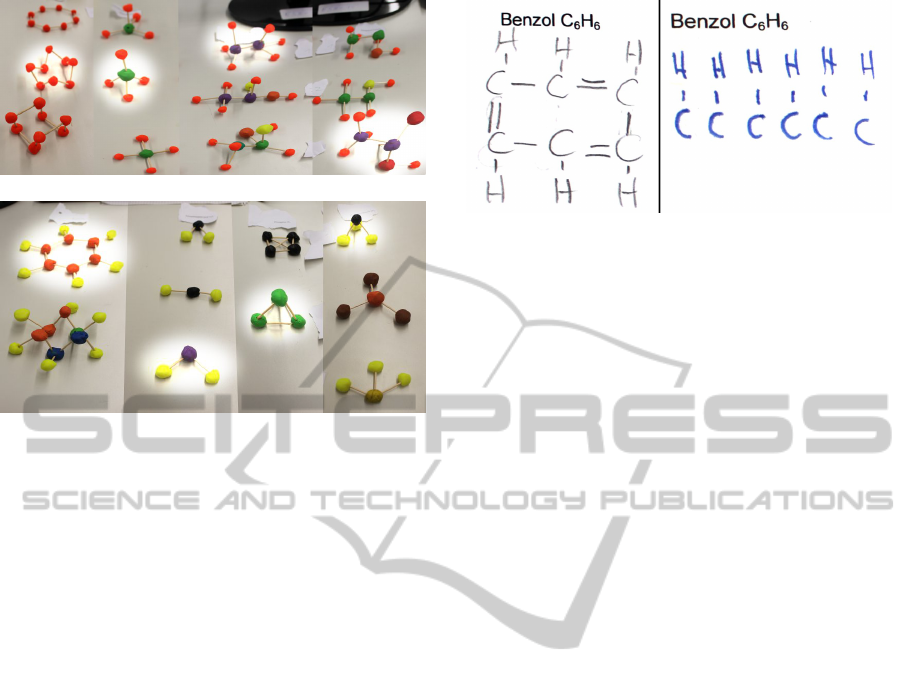
(a) Molecules #1 to #4
(b) Molecules #5 to #8
Figure 5: This is the set of versions of the first eight
molecules. The correct versions are highlighted.
molecule by pressing a button in the application. Fig-
ure 4 shows the Jmol setup that uses the mouse and
the keyboard to manipulate the position and orienta-
tion of the molecule.
Further Physical Setups for Further Student
Tasks. In addition to the computer setup, the stu-
dent desks carried papers and pencils and modeling
clay with tooth picks. Furthermore, two to three clay
models of each molecule were laid out on a table in a
separate area in one of the rooms. Only one of these
clay models of each molecule was correct. The other
two were wrong with different degrees of spatial inap-
propriateness. Figure 5 shows the set of molecule ver-
sions for the first eight molecules. This is described
further in task 5 of the next section.
3.2 Evaluation Design
We used a between-subjects design, consisting of two
separate groups of students from the eighth grade of
a secondary school. The first group, Group ACR con-
sisted of 12 students, the second group, Group Jmol
had 11 students. With the help of their teacher, the
students were grouped to form a similar distribution
of grades to ensure that both groups had the same
knowledge.
The entire evaluation consisted of an introduc-
tion phase, five tasks including use of one of the two
molecular visualization programs, and a brief subjec-
tive interview at the end.
Introduction Phase (5 minutes). At the beginning,
all students were in the same room. They received
Figure 6: Example of a good and a bad drawing of the
chemical formula of molecule #5 as LEWIS structure for
Task 1.
an exercise sheet with printed-out molecular formu-
las of all ten molecules. The paper also contained a
short introduction to the topic and explained what the
students were asked to do in this evaluation. We ad-
ditionally explained the topic and the following tasks
to the students.
Potentially confounding factors.
• The students were asked to work by themselves
and not to copy from fellow students (cheat), due
to the negative consequences to the evaluation.
Yet, the potential for such an influence on the eval-
uation cannot be completely discarded.
• Since this is a between-subject design, learning
effects are not crucial. For didactic reasons, we
use the same, well-defined sequence through the
set of molecules rather than a randomized order. If
learning effects occur, they affect both conditions
in a similar way and can thus be clearly identi-
fied. Yet, the test design consists of a large num-
ber of sequentially executed tasks, each involving
all eight molecules, and required carry-over expe-
riences between the tasks. Thus, learning can be
seen as an omnipresent aspect over time.
Task 1: Drawings of All 10 Molecular Structures
(15 minutes). As their first task, the students were
asked to draw the LEWIS structure (McNaught and
Wilkinson, 1997) for all molecules of the exercise
sheet next to the molecular formulas – a topic that had
been covered in class during the week before the eval-
uation. They previously were taught by their teacher
how to draw this kind of structures. This should give
the students a basic understanding of the connections
of the atoms in the molecule. Figure 6 shows an ex-
ample of a good and a bad drawing.
After this first task the students were split into
the two groups and went to their respective computer
rooms.
Task 2: Uninformed Modeling of All 10 Spatial
Molecular Structures (20 minutes). At their desks,
students were asked to build models of the ten molec-
ular formulas with clay and toothpicks, according to
EvaluationofanAugmented-Reality-based3DUserInterfacetoEnhancethe3D-UnderstandingofMolecularChemistry
297
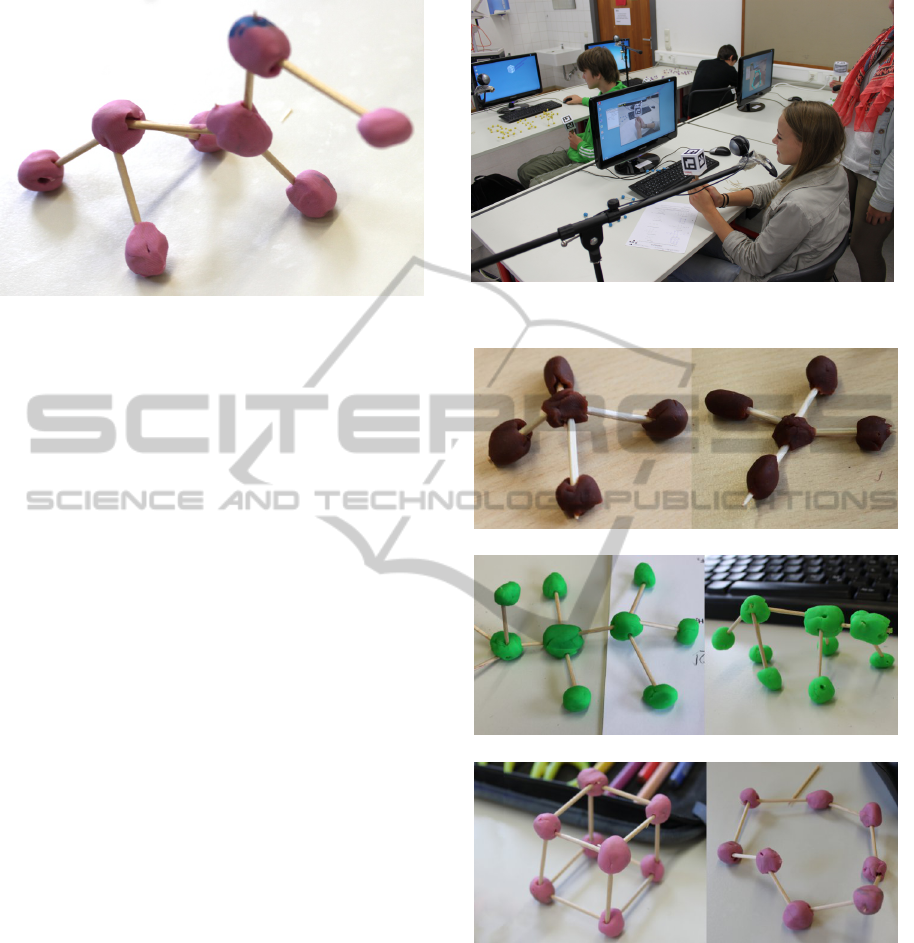
Figure 7: Model of acetic acid C
2
H
4
O
2
(molecule # 4), built
by a student for Task 2. Students used modeling clay and
toothpicks.
their current guess on what such a 3D structure could
look like. They had not yet received any theoretical
training on such 3D structures. We requested students
to build these models in order to have reference data
on the students’ understanding of spatial molecular
structures prior to using the computer-based chemi-
cal visualization applications. The students had 20
minutes to model up to 10 molecules with clay. We
accepted that not everyone would complete this task.
For the analysis, we therefore only took the finished
models into account. Figure 7 shows a model of the
fourth molecule, acetic acid (C
2
H
4
O
2
), built by a stu-
dent.
Task 3: Explore 3D Molecular Structures with the
Respective Visualization Application (20 minutes).
Each group was then asked to use their assigned visu-
alization software to inspect all ten molecules. With
ACR, the students sat in front of the display with the
webcam above their shoulder and the marker cube in
their hand. On the screen they saw the captured image
plus their controlled virtual molecule rendered on top
of the marker cube. The students could cycle through
the set of molecules by pressing the space-bar on the
keyboard. Figure 8 shows a part of the classroom with
students working on the ACR version. With Jmol,
the students used the mouse and the keyboard to ro-
tate and move the molecules. To switch to the next
molecule, they had to click a button in the software.
The students did not receive initial tutoring for ei-
ther of the two software systems. Rather, they started
immediately with the given molecular assignments.
None were observed to have difficulties using the user
interfaces.
The students had 20 minutes to inspect all ten
molecules. After this time, the applications were
stopped. In the meantime we took photos of the
molecules built for Task 2.
Figure 8: Classroom with students using the ACR for Task
3.
(a) worsened (Mol. #2 Methane CH
4
)
(b) improved (Mol. #3 Ethanole C
2
H
5
OH)
(c) strongly improved (Mol. #1 Sulfur S
8
)
Figure 9: Before-after state of a worsening 9(a), normal im-
provement 9(b) and a large improvement 9(c) (Task 4).
Task 4: Informed Modeling of All 10 Spatial
Molecular Structures (10 minutes). With their new
knowledge of the spatial structure of the molecules,
the students were asked to improve the molecular
models they had built in task 2.
To measure how the 3D understanding of the spa-
tial structure of the molecules changed, we compared
the initial version of the molecules with the new ver-
sion. Figure 9 shows typical clay models before and
CSEDU2013-5thInternationalConferenceonComputerSupportedEducation
298

after using the software.
Task 5: Selection between Several Pre-built Clay
Models of each Molecule. To also get an objec-
tive measurement of how both 3D user interfaces im-
proved the spatial understanding, we confronted the
students with 2-3 pre-built clay models of the first
eight molecular structures (see Figure 5). For the first
eight molecules, we had built one clay model version
that was the correct solution, one that was completely
wrong and a third one that was almost correct, but still
noticeably different from the correct one. Here, we
could evaluate to what extent the students had gained
a spatial understanding of molecular structures. Fig-
ure 5 shows the alternative clay models for the first
eight molecules.
Closing Phase: Informal Interview and Question-
naire. At the end of the evaluation we had a short
joint informal interview in front of the whole class.
We also handed out a questionnaire to learn a bit about
the students’ prior knowledge. We asked the students
what they liked and what they did not like. The stu-
dents stated that they liked the idea of learning the
molecule structure using a computer application. Es-
pecially the group using ACR told that they had a lot
of fun using the user interface. Where the group with
Jmol liked the general idea of using an application
to show the 3D structure, the ACR users were fasci-
nated about the user interface with the marker cube.
All stated that they would like to continue using the
application in their class to further learn about the ge-
ometry of molecules.
4 RESULTS
The evaluation consisted of two parts – the build-
ing and the improvement of the clay molecules and
the selection of the right version. Table 5 at the end
presents the raw absolute scores of all tasks. Empty
cells denote that the students did not model the spe-
cific molecule or did not select any version in the last
task.
The subsequent sections give the results, discuss
these scores and suggest interpretations.
4.1 Improvements to Students’ Clay
Models
To measure how the AR-based and the mouse-based
user interfaces of ACR and Jmol affected the spatial
understanding of the virtual molecules, we compared
the models built in Task 2 with the models changed in
Task 4.
With the help of the chemistry teacher, we scored
the molecules (Table 5). Table 1 presents the inter-
pretation of the students’ improvements from Task 2
to Task 4 – due to the use of the chemical education
applications (Jmol, ACR). When the second version
(Task 4) of the models was worse than the first ver-
sion (Task 2), we scored this with −1 point. No im-
provement of the molecule was scored as 0 points,
and an improvement was scored as +1 point. When
the first version was totally wrong and the second was
completely correct, we scored +2 points. When stu-
dents already provided a perfectly correct solution in
the first version (Task 2) and they did not change any-
thing on the molecule in Task 4, we did not count it
– as this does not deliver insight regarding the use-
fulness of the software system (user interface). The
scores are presented in Table 1. A Kruskal-Wallis test
shows that there is a significant difference in the me-
dians χ
2
(3, N = 45) = 32.34, p < 0.0001 at a signif-
icance level of 5%. The results show that the direct
manipulation 3D user interface of the ACR applica-
tion helped the students significantly better than the
Table 1: Scores representing students’ improvements be-
tween uninformed modeling of the molecules in Task 2 and
informed modeling in Task 4, i.e., after having visualized
the molecules with Augmented Chemical Reactions (ACR)
or Jmol int Task 3.
Group 1 (ACR)
a
a
a
a
a
a
User
Mol
1 2 3 4 5 6 7 8
1 -1 1
2 2 1 2
3 1 1 0 0
4 1 1 2 0 0
5 1 1 0
6 1 1 0
7 1 1 1
8 0 2 1
9 1 0 0 1 2 0 0 0
10 1 0 0 1 0 2 0
11 2 1 2
12 0 0 0 0 2
Group 2 (Jmol)
a
a
a
a
a
a
User
Mol
1 2 3 4 5 6 7 8
1 2 2 0 1 0
2 0 0 0 0
3 0 0 0 0
4 1 -1 1 0
5 1 -1 0
6 2 0 0 0
7 0 1 1 -1 2
8 1 0 0 1
9 1 0 0 2
10 1 0 0 2
11 1 1 0 1
EvaluationofanAugmented-Reality-based3DUserInterfacetoEnhancethe3D-UnderstandingofMolecularChemistry
299
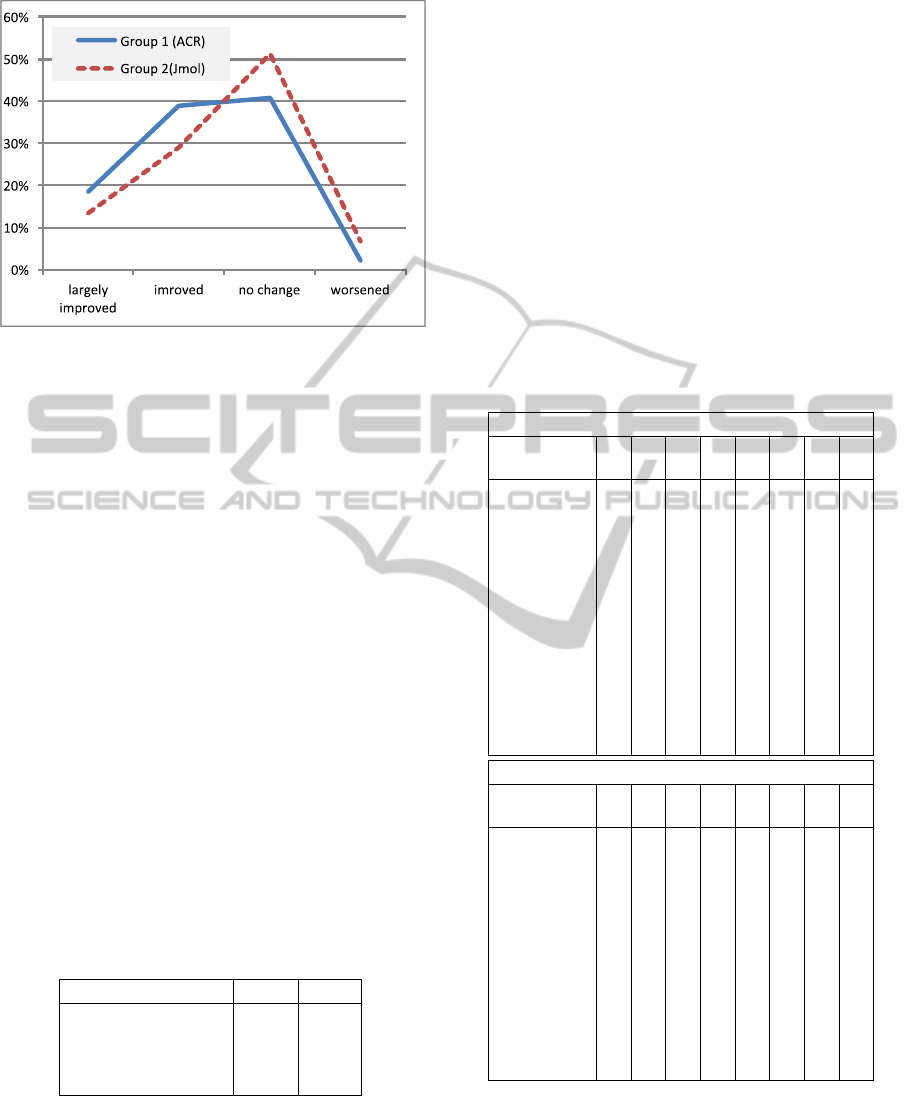
Figure 10: Percentages of the quality of the changes that
students made to improve their clay models in Task 4.
The height of the graph represents the percentage of the
molecules which were strongly improved, improved, no
change or worsened.
keyboard and mouse 3D User-Interface of Jmol.
Table 2 and the corresponding graph in Fig-
ure 10 show how many percent of the molecules were
strongly improved, improved, unchanged or worsened
by students using the Jmol the ACR program, respec-
tively. The numbers enhance the statistical finding
that Group 1 (ACR) using the direct manipulation 3D
user interface had a significantly better improvement
than Group 2 (Jmol) using mouse and keyboard. Both
the percentages for large improvements and for nor-
mal improvements are higher for ACR than for Jmol,
whereas the percentages of no change and of worsen-
ing changes are smaller. A deeper analysis of the re-
sults shows that students of group 1 (ACR) who were
wrong in Task 2 improved more in task 4 than stu-
dents of group 2 (Jmol). This also shows that ACR
with the direct manipulation user interface helps more
to understand the spacial structures than using an indi-
rect manipulation user interface with mouse and key-
board (Jmol).
Table 2: Percentages of the quality the changes that students
made to improve their clay models in Task 4.
ACR Jmol
Strongly improved 18% 13%
Improved 39% 29%
No change 41% 51%
Worsened 2% 7%
4.2 Students’ Ability to Pick the
Correct Clay Model out of a given
Set of Three per Molecule
Since students’ dexterous abilities may vary and the
quality of some of the students’ clay models may thus
have depended on that, we designed Task 5 as a test
that was independent of the students’ own modeling
skills and time limitations. We had prepared three
clay model versions of the first eight molecules, with
one being correct, one being slightly wrong and one
being completely wrong. The students were asked to
indicate for each molecule which one they considered
to be the correct model. They received 2 points for
the correct answer, 1 point for the nearly correct an-
swer, and 0 points when they selected the completely
wrong clay model. Although we asked the students
not to copy from the others, we cannot guarantee that
they did not. Table 3 summarizes the score of table 5,
pertaining to Task 5.
Table 3: Scores of students’ selections of three clay model
versions of each molecule in Task 5.
Group 1 (ACR)
a
a
a
a
a
a
User
Mol
1 2 3 4 5 6 7 8
1 2 2 2 2 2 2 2 2
2 2 2 1 1 2 2 2 2
3 1 2 2 0 2 2 2 1
4 1 2 2 2 0 1 2 2
5 1 1 1 1 0 0 2 2
6 1 0 2 2 2 0 2 1
7 2 0 2 2 2 1 2 2
8 2 2 2 2 2 2 2 2
9 2 0 2 1 2 2 2 2
10 1 2 2 1 2 2 2 1
11 2 2 1 2 2 2 2 2
12 2 2 2 2 2 2 2 2
Group 2 (Jmol)
a
a
a
a
a
a
User
Mol
1 2 3 4 5 6 7 8
1 2 2 2 1 2 1 2 2
2 2 2 2 1 0 2 2 2
3 2 2 1 2 2 0 2 1
4 2 1 0 2 0 1 2 2
5 2 2 2 2 0 2 2 2
6 1 2 2 2 2 2 2 2
7 2 2 0 1 2 2 2 2
8 2 2 1 1 0 0 2 0
9 2 2 1 1 0 1 2 2
10 2 2 1 1 0 1 2 2
11 2 2 0 1 0 1 2 2
We calculated the average points that students
achieved for each molecule. They are shown in Ta-
ble 4 and in Figure 11. Interestingly, molecule #1
and #2 had a better result with the user interface of
Jmol. The variance of these results of the group Jmol
is unusual small in relation to the other molecules.
This leads to the assumption that there was some-
CSEDU2013-5thInternationalConferenceonComputerSupportedEducation
300
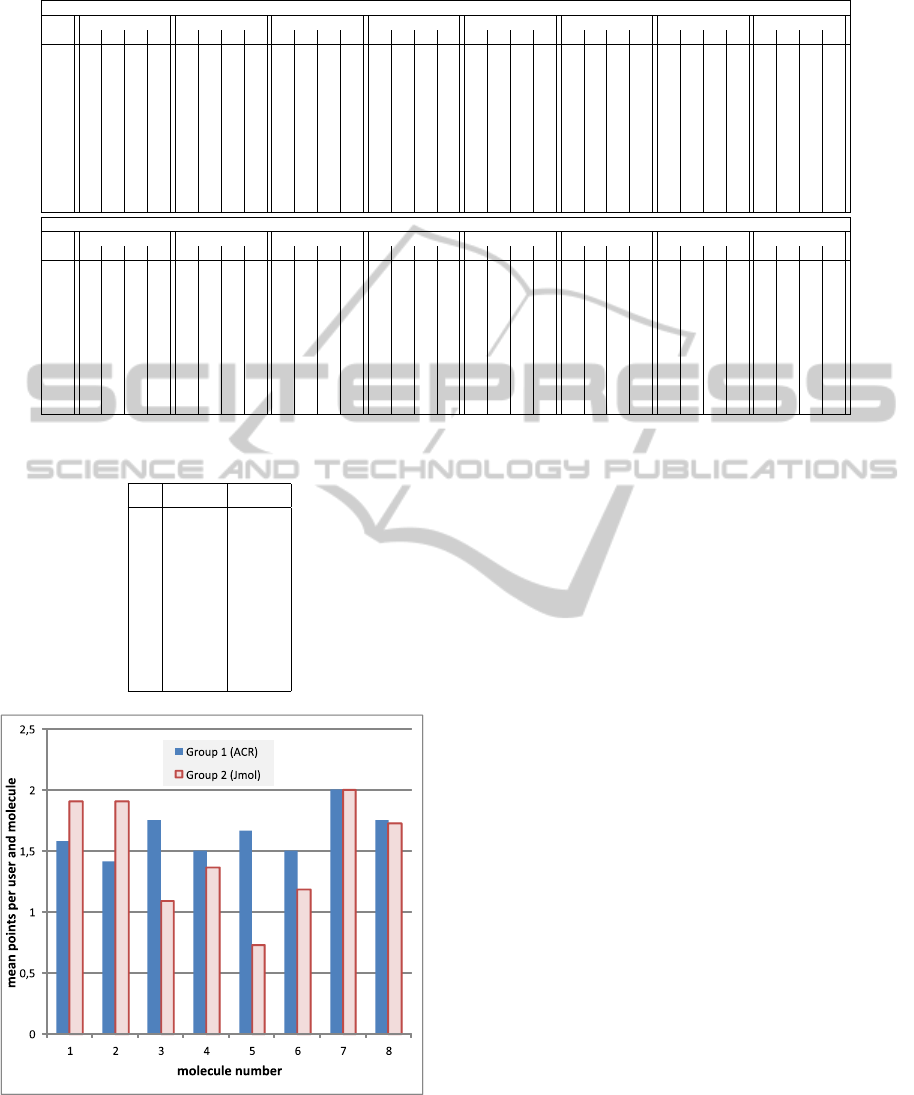
Table 5: Scores of all task assignments, T1, T2, T4 and T5.
Group1(ACR)
User Mol.1 Mol.2 Mol.3 Mol.4 Mol.5 Mol.6 Mol.7 Mol.8
T 1 T 2 T 4 T 5 T 1 T 2 T 4 T 5 T 1 T 2 T 4 T 5 T 1 T 2 T 4 T 5 T 1 T 2 T 4 T 5 T 1 T 2 T 4 T 5 T 1 T 2 T 4 T 5 T 1 T 2 T 4 T 5
1 1 2 0 2 2 2 2 1 2 2 0 2 0 2 1 2 2 0 2
2 2 3 3 2 2 1 3 2 2 1 2 1 0 1 2 2 1 0 3 2 1 2 2 2
3 1 0 2 1 2 3 3 2 2 1 2 2 0 1 1 0 1 0 0 2 1 3 3 2 1 2 3 1
4 2 0 2 1 2 2 3 2 0 1 3 2 0 2 2 2 2 1 1 0 1 1 0 2 2 2
5 2 1 2 1 2 1 0 0 1 1 0 0 0 1 1 0 1 0 0 2 2 2
6 1 0 2 1 2 0 1 0 1 2 2 2 1 0 0 0 0 2 1
7 2 0 2 2 2 1 2 0 0 1 2 2 0 2 1 2 1 1 1 2 2 2
8 1 2 2 2 2 1 3 2 0 1 2 2 0 2 0 2 1 2 1 2 2 2
9 1 1 2 2 2 1 1 0 0 1 1 2 0 0 1 1 0 3 2 1 0 0 2 1 0 0 2 2 0 0 2
10 1 0 2 1 2 0 0 2 2 1 1 2 1 0 1 1 2 3 3 2 1 0 0 2 1 0 3 2 2 1 1 1
11 1 0 3 2 2 3 3 2 2 1 2 2 3 2 1 2 2 3 3 2 1 0 3 2 2 2
12 1 0 0 2 2 0 0 2 2 0 0 2 2 0 0 2 1 2 1 2 1 0 3 2 2 2
Group2(Jmol)
User Mol.1 Mol.2 Mol.3 Mol.4 Mol.5 Mol.6 Mol.7 Mol.8
T 1 T 2 T 4 T 5 T 1 T 2 T 4 T 5 T 1 T 2 T 4 T 5 T 1 T 2 T 4 T 5 T 1 T 2 T 4 T 5 T 1 T 2 T 4 T 5 T 1 T 2 T 4 T 5 T 1 T 2 T 4 T 5
1 1 1 3 2 2 1 3 2 2 2 0 0 0 1 0 2 1 0 1 1 1 0 0 2 2 3 3 2
2 1 1 1 2 2 1 1 2 2 2 0 1 0 1 0 0 2 1 1 1 2 2 2
3 1 1 1 2 2 1 1 2 2 1 0 2 0 2 1 0 0 0 1 1 1 2 2 1
4 2 0 2 2 2 3 1 1 0 1 2 0 0 2 0 1 3 3 1 0 2 2 1 1 2
5 0 0 2 2 2 2 0 2 0 1 1 2 0 2 0 0 1 3 3 2 0 2 2 2
6 1 0 3 1 2 3 3 2 2 2 2 2 2 2 2 2 2 2 1 3 3 2 1 2 2 2 2 2
7 2 0 0 2 2 3 3 2 2 0 2 1 0 2 3 2 1 1 2 2 1 1 0 2 2 1 3 2
8 1 0 2 2 2 3 3 2 2 1 1 1 2 1 1 1 2 0 1 0 1 1 2 2 2 0
9 1 0 2 2 2 3 3 2 2 1 1 1 2 1 1 1 2 0 1 3 3 1 1 0 3 2 2 2
10 1 0 2 2 2 3 3 2 2 1 1 1 2 1 1 1 2 0 1 3 3 1 1 0 3 2 2 2
11 1 0 2 2 2 2 3 2 2 2 2 0 1 1 2 0 1 3 3 1 1 1 2 2 2 1 1 2
Table 4: Average number of points students achieved for
each molecule in Task 5.
ACR Jmol
1 1.58 1.91
2 1.42 1.91
3 1.75 1.09
4 1.50 1.36
5 1.67 0.73
6 1.50 1.18
7 2.00 2.00
8 1.75 1.73
Figure 11: This diagram shows the mean points users had
for each molecule with Task 5 (Selecting the right version
of the molecules).
thing unintended going on (copying from others).
Molecule #1 with its crown-like structure can be seen
in Figure 11. Molecule #2 has a simple tetrahedron
structure with the carbon atom in the middle. For
molecules #3, #4, #5, and #6, group ACR was bet-
ter than group Jmol, while molecules #7 and #8 faired
approximately even in both groups. The large differ-
ence in the results of Molecule #5 could be explained
in the following way: Students using the Jmol appli-
cation could not remember the flat structure of the
molecule anymore, so they probably took the more
complex looking structure, whereas the students with
the ACR could have remembered the flat structure.
Molecule #7 and #8 were so easy that nearly every-
one has picked the right version.
On average across all molecules, students of group
ACR achieved 13.17 points, compared to 11.91 of
group Jmol.
5 DISCUSSION
AND CONCLUSIONS
Although the time for using the software was not very
long, there is already a significant difference in the
improvement of the spatial understanding of the 3D
molecules. We think that by using a direct manipula-
tion 3D user interface, students can literally grasp the
spatial structure. Whereas with mouse and keyboard,
there is a mapping of the movements (2D horizontal
movement of the mouse on the table results in a rota-
tion of the virtual molecule on the screen). With this
mapping, it seems to be not so easy to concentrate on
the spatial structure of the virtual molecules. People
are used to direct manipulation from their childhood.
EvaluationofanAugmented-Reality-based3DUserInterfacetoEnhancethe3D-UnderstandingofMolecularChemistry
301

Consequently this user interface is more natural and
supports the learning of the spatial structures.
All students also mentioned that they had fun us-
ing the application and would like to use it more of-
ten in class. Fun is also one of the most important
enablers in learning.
Our evaluation showed that this assumption seems
to be valid. Further investigations with a longer period
of the study could investigate this finding in more de-
tail.
ACKNOWLEDGEMENTS
We would like to thank the Josef-Hofmiller-
Gymnasium for their kind support. Special thanks go
to Nina Hefter and Andreas Dippon who helped a lot
in this study.
REFERENCES
Arnold, O., Fujima, J., Jantke, K. P., and Tanaka, Y. (2012).
Exploring and understanding the abstract by direct
manipulation of the concrete. In CSEDU (2), pages
100–107.
Chen, M., Mountford, S., and Sellen, A. (1988). A study
in interactive 3-d rotation using 2-d control devices.
In ACM SIGGRAPH Computer Graphics, volume 22,
pages 121–129. ACM.
Fjeld, M., Fredriksson, J., Ejdestig, M., Duca, F., B
¨
otschi,
K., Voegtli, B., and Juchli, P. (2007). Tangible user
interface for chemistry education: comparative eval-
uation and re-design. In Proceedings of the SIGCHI
conference on Human factors in computing systems,
pages 805–808. ACM.
Herman, T., Morris, J., Colton, S., Batiza, A., Patrick, M.,
Franzen, M., and Goodsell, D. (2006). Tactile teach-
ing: Exploring protein structure/function using phys-
ical models*. Biochemistry and Molecular Biology
Education, 34(4):247–254.
Hinckley, K., Tullio, J., Pausch, R., Proffitt, D., and Kas-
sell, N. (1997). Usability analysis of 3d rotation tech-
niques. In Proceedings of the 10th annual ACM sym-
posium on User interface software and technology,
pages 1–10. ACM.
Hoyek, N. E., Collet, C., Guillot, A., Thiriet, P., and
Sylvestre, E. (2011). Experimental research valida-
tion for the use of 3d in teaching human anatomy. In
Verbraeck, A., Helfert, M., Cordeiro, J., and Shishkov,
B., editors, CSEDU (2), pages 225–227. SciTePress.
Jmol (2012). Jmol: an open-source Java viewer for chemi-
cal structures in 3D. http://www.jmol.org/.
Johnson, E. M., Khoo, E., Cowie, B., de Lange, W., and
Torrens, R. (2011). Ict/ elearning for developing vi-
sual spatial thinking in university science teaching. In
CSEDU (2)’11, pages 73–78.
Kato, H. and Billinghurst, M. (1998). Marker tracking and
hmd calibration for a video-based augmented reality
conferencing system. In 2nd IEEE and ACM Inter-
national Workshop on Augmented Reality (IWAR 99),
pages 85–94.
Maier, P., T
¨
onnis, M., and Klinker, G. (2009a). Augmented
Reality for teaching spatial relations. In CD-ROM
Proceedings from the Conference of the International
Journal of Arts and Sciences. ISSN: 1943-6114.
Maier, P., T
¨
onnis, M., and Klinker, G. (2009b). Dynamics
in Tangible Chemical Reactions. In Proceedings from
the International Conference on Chemical Engineer-
ing (ICCE 2009). ISSN: 2070-3724.
McNaught, A. and Wilkinson, A. (1997). Compendium of
chemical terminology, volume 1669, chapter Lewis
formula (electron dot or Lewis structure), page 1135.
Blackwell Science Oxford, UK.
Panagiotopoulos, C. G., Manolis, G. D., and
Athanatopoulou, A. (2012). Edusoft package
for structural engineering - web-based educational
material using java for structural dynamics. In
Helfert, M., Martins, M. J., and Cordeiro, J., editors,
CSEDU (2), pages 299–303. SciTePress.
Pustka, D., Huber, M., Waechter, C., Echtler, F., Keitler, P.,
Newman, J., Schmalstieg, D., and Klinker, G. (2011).
Automatic configuration of pervasive sensor networks
for augmented reality. IEEE Pervasive Computing,
10(3):68–79.
Zhai, S. (1998). User performance in relation to 3d input
device design. ACM Siggraph Computer Graphics,
32(4):50–54.
CSEDU2013-5thInternationalConferenceonComputerSupportedEducation
302
