
Quantifying Energy Usage in Data Centers through Instruction-count
Overhead
K. F. D. Rietveld and H. A. G. Wijshoff
LIACS, Leiden University, Niels Bohrweg 1, 2333CA, Leiden, The Netherlands
Keywords:
Energy Saving, Software Overhead, Instruction Reduction, Web Applications.
Abstract:
Energy usage of data centers is rising quickly and the electricity cost can no longer be neglected. Most
efforts to relieve the increase of energy usage concentrate on improving hardware efficiency, by improving the
hardware itself or by turning to server virtualization. Yet, no serious effort is made to reduce electricity usage
by targeting the software running in data centers. To be able to effectively target software, a quantification
of software overhead is necessary. In this paper, we present a quantification of the sources of overhead in
applications that are these days ubiquitous in data centers: web applications. Experiments with three web
applications show that up to 90% of the instructions executed to generate web pages are non-essential, in
other words overhead, and can be eliminated. Elimination of these non-essential instructions results in an
approximately linear decrease in page generation time as well as significantly reduced energy usage. In order
to get the rising energy cost of data centers under control it is obligatory to be able to quantify the source of
energy cost. In this paper we present an approach how to quantify wasted energy based on a quantification of
non-essential instructions that are executed.
1 INTRODUCTION
Applications that have seen a steady rise in ubiquity
in the last 10 years are web applications. In many data
centers web applications are hosted that provide much
of the World-Wide Web’s content. Web applications
are often built from several readily available compo-
nents to speed up development, such as web devel-
opment frameworks and database management sys-
tems (DBMSs). This modularity allows for rapid pro-
totyping, development and deployment. The World-
Wide Web has heavily benefited from this modular
approach.
However, it is well known that modularity does
not come for free. The use of rapid development
frameworks and other re-usable modules comes at the
cost of reduced performance. In a time where energy
consumption of data centers is becoming a greater and
greater concern, the call to break down the layers in
order to regain efficiency will become bigger. To be
able to effectively target efforts to reduce energy con-
sumption of web applications, the sources of overhead
must be quantified. An instruction-level quantifica-
tion of overhead in web applications does not exist to
our knowledge. Therefore, in this paper, we present
an initial study to quantify the overhead induced by
this modular and layered approach. We argue that this
overhead is significant.
In the last decade, the increasing energy consump-
tion of data centers has already drawn the attention
of governments. The US Environment Protection
Agency (EPA) reported on the energy efficiency of
data centers in a 2007 report (U.S. Environmental
Protection Agency, 2007). Their study says energy
consumption of US data centers had doubled in the
period from late 2000 to 2006. Based on this trend,
they projected another doubling in electricity use for
the period from 2006 to 2011. This would mean a
quadrupling in electricity use by data centers in about
10 years time.
Contrary to the EPA prediction, a 2011 report by
Jonathan G. Koomey (2011) claims electricity by US
data centers increased by 36% instead of doubling
from 2005 to 2010. This is significantly lower than
predicted by the EPA report. Koomey attributes this
to a lower server installed base than predicted earlier,
caused by the 2008 financial crises and further im-
provements in server virtualization. Nevertheless, the
energy consumption is still increasing and while the
increase was only 36% in the US, according to the
Koomey report the increase amounted to 56% world-
wide.
The server installed base is an important metric,
because each installed server adds up to the amount
189
F. D. Rietveld K. and A. G. Wijshoff H..
Quantifying Energy Usage in Data Centers through Instruction-count Overhead.
DOI: 10.5220/0004357901890198
In Proceedings of the 2nd International Conference on Smart Grids and Green IT Systems (SMARTGREENS-2013), pages 189-198
ISBN: 978-989-8565-55-6
Copyright
c
2013 SCITEPRESS (Science and Technology Publications, Lda.)

of electricity used, not only due to the energy used
by the server itself but also because cooling capacity
has to be increased. The EPA report makes many rec-
ommendations to reduce electricity use in data cen-
ters. Many of these recommendations seek for so-
lutions in hardware. Better power management can
make servers more energy efficient. The server in-
stalled base can be reduced by making better use of
virtualization to consolidate servers. Recommenda-
tions are also made to develop tools and techniques
to make software more efficient by making better use
of parallelization and to avoid excess code. However,
these recommendations are not as concrete as those
for hardware improvements.
An interesting observation in the EPA report is
that those responsible for selecting and purchasing
computer equipment are not the same as those respon-
sible for power and cooling infrastructure. The latter
typically pay the electricity bills. This leads to a split
incentive, because those who could buy more energy
efficient hardware have little incentive to do so. We
believe a similar split incentive exists with software
developers. Software developers are not in charge of
obtaining the necessary computing equipment in data
centers and also are not aware of the electricity bills.
Therefore, software developers have very little incen-
tive to further optimize the software to reduce energy
consumption. The fact that software optimization is a
very diligent and costly task does not help.
Many statistics have been collected on data center
cost and performance. For example Computer Eco-
nomics, Inc. (2006) describes several metrics that are
used in data center management to optimize perfor-
mance and drive costs down. Many of these metrics
concentrate around MIPS or the number of servers
and processors. Mainframe size is expressed in MIPS,
and cost can be expressed in spending (on hardware,
software, personnel, etc.) per MIPS. Statistics on
Intel-based UNIX and Windows operating environ-
ments are expressed in number of servers and pro-
cessors. In such statistics a distinction is made be-
tween installed MIPS versus used MIPS. These num-
bers should not be too far apart, because server ca-
pacity staying idle is neither cost nor energy efficient.
However, as soon as a server is no longer idle, the
work performed is counted as used MIPS. Of such
used MIPS it is not investigated whether these MIPS
did useful work or were mainly overhead. In other
words, no distinction is made between essential MIPS
and non-essential MIPS, with non-essential MIPS be-
ing accrued from the cost of the usage of rapid devel-
opment frameworks and software modularity.
In this paper, we address the quantification of en-
ergy usage through non-essential instruction (MIPS)
count overhead. We investigate three existing and
representative web applications and show that in this
manner accurate measurements on spilled energy us-
age can be obtained. To our belief, this will result in
an incentive for data centers to prioritize the need for
software overhead reduction instead of only improv-
ing hardware energy efficiency.
In Section 2 we give an overview of how non-
essential MIPS are determined in web applications.
Section 3 describes the experimental setup and the
web applications used. The sources of overhead are
quantified in Section 4. Section 5 links the results of
the experiments to the expected reduction in energy
consumption. Section 6 discusses work related to this
paper. Finally, Section 7 lists our conclusions.
2 DETERMINATION OF
NON-ESSENTIAL MIPS
We have defined a number of categories of over-
head, or non-essential MIPS, in web applications that
make use of the PHP language and a MySQL DBMS,
which we will quantify. The instruction count of
non-essential MIPS for each category is obtained by
counting instructions in the original program code
and in the program code with the overhead source
removed. The difference in instruction count is the
number of instructions for the corresponding over-
head source.
The first category of overhead we will consider is
overhead caused by development frameworks for web
applications. Many applications are written with the
use of a framework to dramatically shorten develop-
ment time and increase code re-use. One of the appli-
cations we survey in this paper has been developed us-
ing the CakePHP framework. The CakePHP simpli-
fies development of web applications by performing
most of the work serving web requests and abstract-
ing away the low-level data access through a DBMS.
Frameworks like this affect performance by, for ex-
ample, performing unnecessary iterations and copies
of results sets, or even by executing queries of which
the results are not used at all.
The second category of overhead is the PHP lan-
guage itself. Due to PHP’s nature as a script language,
there is a start-up overhead due to parsing and inter-
pretation of the source files and the potential to thor-
oughly optimize the code in a similar way to compiled
languages is removed.
As a third category, we consider the current mod-
ular design of DBMSs, which has as result that a sin-
gle DBMS instance can be easily used for a variety
of applications. A downside of this modularity is that
SMARTGREENS2013-2ndInternationalConferenceonSmartGridsandGreenITSystems
190

when an application has a request to retrieve data, this
request has to go out of process. Depending on the ar-
chitecture of the website, the request is either served
by a DBMS running on the same server as the web
server executing the PHP code or the request is sent
to a remote DBMS host. Overhead that is incurred
can include: context switching overhead, network and
protocol overhead and data copying overhead.
The fourth category of overhead is caused by
DBMS APIs implemented in shared libraries. The li-
brary sends SQL queries to the DBMS and retrieves
the results. As a result of this architecture details on
the data accesses are shielded off and also overhead is
introduced by iterating result sets at least twice: once
when the DBMS builds up the result set and sends this
to the application program and once in the application
program itself when the results are iterated.
3 EXPERIMENTAL SETUP
In this paper we quantify three web applications: dis-
cus, RUBBoS (ObjectWeb Consortium, n.d.-a) and
RUBiS(ObjectWeb Consortium, n.d.-a) and RUBiS
(ObjectWeb Consortium, n.d.-b). Although it can be
questioned whether these three applications are repre-
sentative of typical web applications running in data
centers, we are convinced that at least these bench-
marks can be used to create an initial quantification
of the overhead. In our experiments, we have focused
on read-only workloads.
discus
discus is an in-house developed student administra-
tion system. The system is based on CakePHP de-
velopment framework, version 1.2.0. To quantify
the overhead for full page generations, all forms of
caching (e.g. query or page caching) in CakePHP
have been disabled. We focus on two particular
page loads: the students index and the individual stu-
dent view. All experiments have been carried out
with three different data sets: small (25.000 tuples),
medium (0.5 million tuples) and large (10 million tu-
ples).
RUBBoS
The RUBBoS benchmark was developed by a col-
laboration between RICE University and INRIA and
models a typical bulletin board system or news web-
site with possibility to post comments (ObjectWeb
Consortium, n.d.-a). We have used the PHP-version of
RUBBoS. To quantify the overhead in different typi-
cal pages served by RUBBoS, we looked at the page
generation times of the following pages: StoriesOfT-
heDay, BrowseStoriesByCategory, ViewStory, View-
Comment. We believe these pages are typical for the
workload that characterizes a news story website. As
data set we have used the data set that is made avail-
able at the RUBBoS website.
RUBiS
The RUBiS benchmark (ObjectWeb Consortium,
n.d.-b) models a simple auction website and is sim-
ilar to the RUBBoS benchmark as it has been devel-
oped by the same collaboration. For our tests with
RUBiS we have used the same methodology as with
RUBBoS. The PHP-version of RUBiS was used and
the following pages were picked: ViewBidHistory,
ViewItem, ViewUserInfo and SearchItemsByCategory.
The data set that is available from the RUBiS website
has been used as data set in our experiments.
The experiments have been carried out on an Intel
Core 2 Quad CPU (Q9450) clocked at 2.66 GHz with
4 GB of RAM. The software installation consists out
of Ubuntu 10.04.3 LTS (64-bit), which comes with
Apache 2.2.14, PHP 5.3.2 and MySQL 5.1.41. No ex-
traordinary changes were made to the configuration
files for Apache and MySQL, except that in MySQL
we have disabled query caching to be able to consis-
tently quantify the cost for executing the necessary
queries. In the experiments we obtained two met-
rics. Firstly, we obtained the page generation time
which we define as the difference between the time
the first useful line of the PHP code started execution
until the time the last line of code is executed. Sec-
ondly, we acquire the number of instructions executed
by the processor to generate the page by reading out
the INST_RETIRED hardware performance counter of
the CPU.
4 QUANTIFICATION
In this section, we will quantify the overhead for each
of the categories described in Section 2. To quantify
the overhead induced by the PHP programming lan-
guage we have compared the performance of the three
code bases to the code bases compiled to native ex-
ecutables using the HipHop for PHP project(HipHip
for PHP Project, n.d.). This project is developed
by Facebook and is a compiler that translates PHP
source code to C++ source code, which is linked
against a HipHop runtime that contains implementa-
tions of PHP built-in functions and data types. Both
the Apache HTTP server and the PHP module are re-
placed by the HipHop-generated executable. In Fig-
QuantifyingEnergyUsageinDataCentersthroughInstruction-countOverhead
191
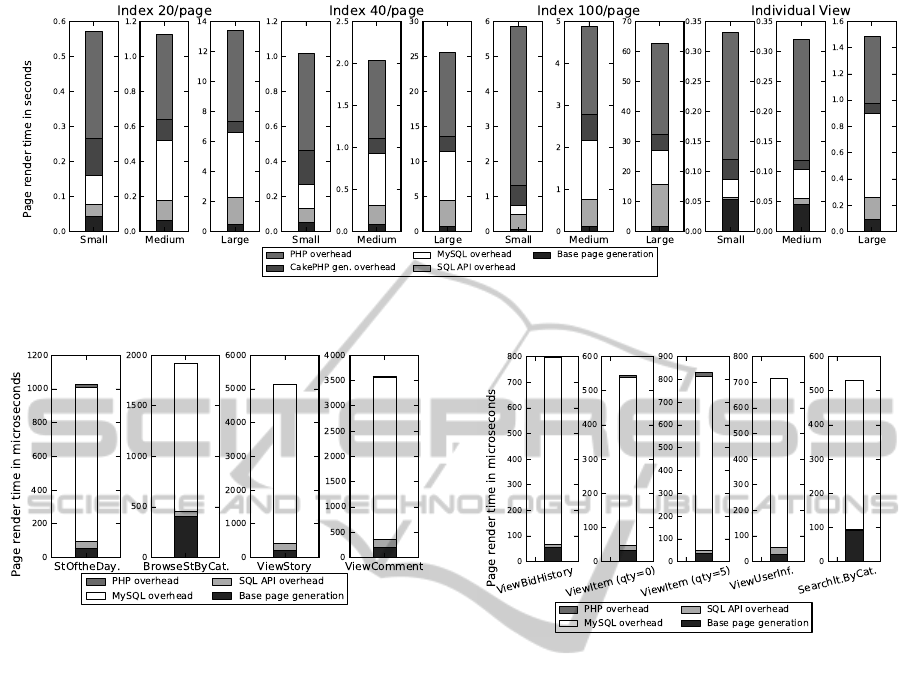
Figure 1: Page generation time in seconds for different pages and data set sizes from discus. Each category (e.g. “Index
20/page”) contains up to 10 different page loads over which the average over 5 runs is taken.
Figure 2: Page generation time in microseconds for differ-
ent pages from the RUBBoS benchmark. Times displayed
are averages of 10 runs on a warmed-up server.
ures 1, 2 and 3 the difference in page generation time
between Apache and the HipHop-compiled executa-
bles is shown as “PHP overhead”. Figures 4, 5 and 6
depict the number of instructions executed to gener-
ate the page. For the discus code base we observe that
roughly 1/3 to 2/3 of the page generation time can
be attributed to PHP overhead. A similar overhead is
found in the figures depicting the number of instruc-
tions
The RUBBoS and RUBiS benchmarks do not
show an improvement in page generation time when
the HipHop-version is tested. However, the instruc-
tion count does noticeably decrease. Compared to
discus, the RUBBoS and RUBiS source code is quite
straightforward and it is possible that aggressive com-
piler optimizations do not have much effect. Although
less instructions are retired, it is plausible that instead
more time is spent waiting for (network) I/O.
To quantify the overhead of development frame-
works, we have focused on one of the main sources
of overhead in the CakePHP framework, which is the
data access interface or in particular the automatic
generation of SQL queries. The difference between
the code bases with and without automatic query gen-
Figure 3: Page generation time in microseconds for differ-
ent pages from the RUBiS benchmark. Times displayed are
averages of 10 runs on a warmed-up server.
eration is displayed in Figures 1 and 4 as “CakePHP
gen. overhead”. For most cases, the overhead of au-
tomatic query generation ranges from 1/12 to 1/5 of
the total page generation time. This is significant if
one considers the total page generation time in the or-
der of seconds and the fact that there is no technical
obstacle to make the queries static after the develop-
ment of the application. CakePHP employs caching to
get around this overhead (which was disabled to un-
cover this overhead). However, caching does not help
if similar queries are often executed with different pa-
rameters. We have not done similar experiments for
RUBBoS and RUBiS, because these code bases use
static queries instead of a rapid development frame-
work.
We made the application code compute the results
of the SQL queries instead of sending these queries to
a different DBMS process, to quantify the overhead
of using common DBMS architecture. This was done
by modifying the HipHop-compiled discus, RUBBoS
and RUBiS code bases by replacing calls to MySQL
API with code that performs the requested query. For
example, calls to the function mysql_query were re-
SMARTGREENS2013-2ndInternationalConferenceonSmartGridsandGreenITSystems
192
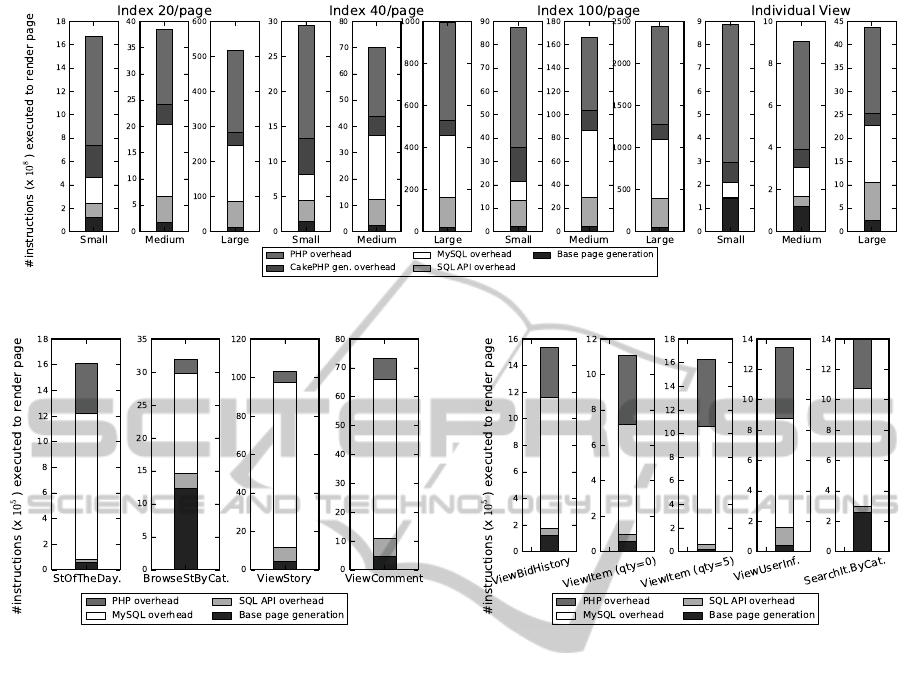
Figure 4: Instruction count in 10
8
s of instructions for different pages and data set sizes from discus.
Figure 5: Instruction count in 10
5
of instructions for differ-
ent pages from the RUBBoS benchmark.
placed with a complete code that performs the re-
quested query and fills an array with the result tu-
ples. Algorithmically seen, the query is performed
in exactly the same manner as it would have been
performed by MySQL. Using the Embedded MySQL
Server Library (MySQL Project, n.d.), it is also pos-
sible to perform SQL queries within the client process
without contacting a remote DBMS. This approach
does not address the DBMS API Overhead as de-
scribed in Section 2, because the generic MySQL API
function calls remain in use, shielding off the data ac-
cess from the application code. Furthermore, our ob-
jective is to obtain a minimum amount of instructions
required for processing queries, to emphasize the cost
of using a generic, modular DBMS.
The time results are displayed in Figures 1, 2 and
3. Compared to the original execution time of the
Apache-version of the discus application, the MySQL
overhead accounts for roughly 8% to 40% of the ex-
ecution time. If we compare the MySQL overhead to
the execution time of the original HipHop-compiled
version however, the MySQL overhead accounts for
roughly 20% to 60% of the execution time. These
larger numbers are also reflected in the RUBBoS and
Figure 6: Instruction count in 10
5
s of instructions for dif-
ferent pages from the RUBiS benchmark.
RUBiS results, where the MySQL overhead is esti-
mated to be around 72% to 90% of the page genera-
tion time. Put differently, elimination of the MySQL
server improved the page generation times for the
RUBBoS and RUBiS applications by about a factor
10. We again see similarly sized reductions in instruc-
tion count in Figures 4, 5 and 6.
Once the SQL queries have been expanded to code
inside the application code, several sources of over-
head of DBMS APIs become apparent. It is now pos-
sible to more tightly integrate the application code
with the query computation code. In the majority
of the cases the loops that iterate over the result set
can be merged into the loops that perform the actual
queries and thus build the result sets, saving an itera-
tion of the result set.
In Figure 1 we observe that it is possible to achieve
at least a factor 2 speedup in most cases compared to
the HipHop-version of discus. For the Index 100/page
with the large data set case, a factor 10 speedup is
obtained. Although the overhead of the DBMS API
does not appear that significant compared to the to-
tal execution time, it does prove to be of significance
when put in the perspective of the execution time of
QuantifyingEnergyUsageinDataCentersthroughInstruction-countOverhead
193

the application when the usage of MySQL has been
removed. The same reasoning holds true when the
results of the RUBBoS and RUBiS applications are
analyzed, displayed in Figures 2 and 3 respectively.
When compared to the total execution time of the
derivative of the application with the MySQL over-
head removed, removing the SQL API overhead re-
sults in speedups close to a factor of 2 in half of the
cases.
5 ENERGY CONSUMPTION
From the results collected we can deduce that in gen-
eral the time spent per instruction stays in the same or-
der of magnitude both when non-essential (overhead)
instructions are removed as well as when the prob-
lem size is increased. Overall, there is an approx-
imately linear relation between the page generation
time and the amount of instructions executed to gen-
erate a page.
For the applications that have been surveyed, re-
moval of non-essential instructions has an immediate
approximately linear impact on performance.
Table 1: Displayed is the ratio of non-essential instructions
executed for each essential instruction.
Ratio
20/page
Small
14.92
Medium
23.26
Large
41.67
40/page
Small
22.72
Medium
30.30
Large
45.45
100/page
Small
43.48
Medium
38.46
Large
47.62
Indiv. View
Small
4.69
Medium
6.17
Large
18.52
Table 2: Displayed is the ratio of non-essential instructions
executed for each essential instruction.
Ratio
RUBBoS, BrowseStByCat.
1.56
RUBBoS, ViewComments.
14.29
RUBBoS, ViewStory.
21.28
RUBBoS, StoriesOfTheDay.
25.64
RUBiS, SearchItByCat.
4.4
RUBiS, ViewBidHistory
11.83
RUBiS, ViewItem-qty-0
17.54
RUBiS, ViewItem-qty-5
80.64
RUBiS, ViewUserInfo
32.26
Tables 1 and 2 show the number of non-essential
instructions that are executed for each essential in-
struction for the discus and RUBBoS/RUBiS exper-
iments respectively. The overhead varies greatly from
page to page. In the majority of cases however, the
overhead is significant: more than 20 non-essential in-
structions are executed for each essential instruction.
An overhead of a factor 20.
In the discus experiments we observe a trend that
as the data set size increases, the overhead increases
as well. Put differently, the overhead expands when
the same code is ran on a larger data set. It is very well
possible that this increase in overhead is caused by the
data reformatting done in the CakePHP framework,
when the result set received from the DBMS is for-
matted into an array that can be used for further pro-
cessing by CakePHP framework objects. The fact that
the overhead of the MySQL and SQL API categories
increases linearly with the data size and thus stays
constant per row also indicates that the cause of this
increase in overhead is to be sought in the CakePHP
framework. From this result it can be expected that
in this case the reduction in non-essential instructions
will be larger as the data set size increases.
Table 3: The Instruction Time Delay (ITD) is shown, which
is the ratio of the average time per essential instruction
against the average time per non-essential instruction. The
latter is the weighted average of the time per instruction of
the different overhead categories.
ITD
RUBBoS, BrowseStByCat. 0.42
RUBBoS, ViewComments. 0.84
RUBBoS, ViewStory. 0.90
RUBBoS, StoriesOfTheDay. 1.55
RUBiS, SearchItByCat. 0.91
RUBiS, ViewBidHistory 0.91
RUBiS, ViewItem-qty-0 1.16
RUBiS, ViewItem-qty-5 3.63
RUBiS, ViewUserInfo 1.43
discus 20/page, Medium 1.42
discus 40/page, Medium 1.30
discus 100/page, Medium 1.15
discus Indiv. View, Medium 1.03
We showed a significant reduction in MIPS to be
executed by a factor of 10. However, if we look at
the ratio of time per essential instruction versus the
average time per non-essential instruction (instruc-
tion time delay) for the web applications we have
surveyed, depicted in Table 3, we observe that for
most cases the average time per essential instruction
is larger than the average time per non-essential in-
struction. A possible explanation for this is that the
majority of essential instructions are expected to be
SMARTGREENS2013-2ndInternationalConferenceonSmartGridsandGreenITSystems
194

Table 4: The Instruction Time Delay (ITD) is shown, simi-
lar to Table 3, but for discus experiments with varying data
set sizes.
ITD
20/page
Small 1.24
Medium 1.42
Large 1.50
40/page
Small 1.18
Medium 1.30
Large 1.45
100/page
Small 0.55
Medium 1.15
Large 1.46
Indiv. View
Small 0.91
Medium 1.03
Large 1.25
carrying out memory access or disk I/O. As a result,
when estimating energy reduction this has to be taken
into account, see below. In case of RUBBoS and RU-
BiS, this trend is not always visible. Possibly, this
is because the time spent by the essential instructions
is quite small, due to small transfers of data, so that
these do not weigh up to the time spent by the non-
essential instructions.
Table 4 displays the instruction time delay for dis-
cus experiments with varying data set sizes. For all
cases, the time delay increases as the data set size in-
creases. Or, as non-essential instructions are elimi-
nated the essential instructions responsible for fetch-
ing the data from memory will take more time to ex-
ecute. The memory wall becomes more exposed as
overhead is removed. Recall from Table 1 that the
number of overhead instructions increases with the
data set size, however, the instruction time delay in-
creases as well and this will counteract the increase in
overhead.
When we consider the majority of the essential in-
structions to be carrying out memory access or disk
I/O, we have to consider the cost of such data accesses
in our conservative estimates of impact on energy us-
age. We use the component peak powers and ac-
tual peak power, which is 60% of the advertised peak
power, of a typical server described by Fan, Weber,
and Barroso (2007). In the very worst case, essential
instructions are the most expensive in energy usage
and non-essential the cheapest, the removal of over-
head would then only remove the cheap instructions.
If we take the typical machine’s actual peak power
usage of just the CPU and memory for the essential
instructions and the idle power usage (estimated at
45% of actual peak power) for the CPU and mem-
ory for the non-essential instructions, we obtain a ra-
tio of approximately 69.6W : 31.3W or a factor 2.22.
Let dP be this factor 2.22, dT be the average time
per essential instruction versus the average time per
non-essential instruction (or time delay), reported in
Table 4, and R be the ratio of non-essential versus es-
sential instructions, reported in Table 1. We can then
use the formula
1 −
dT × dP
R + 1
× 100%
to get a worst-case estimate of the energy sav-
ing. Completing this formula for dP = 2.22,dT =
1.45,R = 45.45 gives an estimated energy saving of
93.1%. A little more realistic, we can estimate the en-
ergy saving considering the entire machine by taking
the idle power usage of the entire machine for non-
essential instructions and a peak energy usage of 90%
of actual peak power usage of the entire machine for
the essential instructions. This results in a dP of 2.0.
When we complete the formula with this dP, we get
a slightly higher energy saving estimate of 93.8%.
Our expected energy saving is based on the obser-
vation that essential instructions are more expensive
than non-essential instructions, because essential in-
structions are more frequently instructions that access
data in memory and disk I/O. Benchmarks with typ-
ical servers show that power usage of such servers is
typically between 60% and 80% of actual peak power
(Fan et al., 2007). If we consider essential instructions
to use 80% of actual peak power and non-essential in-
structions to use 60%, we obtain a dP of 1.33. With
the same parameters for dT and R, we estimate an
energy saving of 95.8%.
We can compare the obtained numbers with the
estimated energy saving if we do not make a distinc-
tion in energy used per instruction for essential and
non-essential instructions. This is reflected in the fol-
lowing formula:
1 −
dT
R + 1
× 100%
Completing for dT = 1.45, R = 45.45 results in an es-
timated energy reduction of 96.9%. This is higher
than the expected saving, because we do not consider
essential instructions to be more expensive.
Table 5 lists the estimated energy savings for the
various discus experiments. We note that the energy
savings increase along with an increase in data set
size. Even though the instruction time delay is in-
creasing with the size of the data sets, we still observe
an increase in energy saving. We conclude that the
increase in overhead instructions superfluously coun-
teracts the instruction time delay. This is due to the
significant size of the overhead ratios. Consider for
example discus Index 20/page; where the number of
QuantifyingEnergyUsageinDataCentersthroughInstruction-countOverhead
195

Table 5: Estimated Energy Saving using the expected dP =
1.33, dT obtained from Table 4 and R from Table 1
Estimated
Energy Saving
20/page
Small 89.6%
Medium 92.2%
Large 95.3%
40/page
Small 93.4%
Medium 94.5%
Large 95.8%
100/page
Small 98.4%
Medium 96.1%
Large 96.0%
Indiv. View
Small 78.7%
Medium 80.9%
Large 91.5%
Table 6: Estimated Energy Saving using the expected dP =
1.33, dT obtained from Table 3. Values for R not shown
due to space constraints.
Estimated
Energy Saving
RUBBoS, BrowseStByCat. 78.2%
RUBBoS, ViewComments. 95.0%
RUBBoS, ViewStory. 94.6%
RUBBoS, StoriesOfTheDay. 92.3%
RUBiS, SearchItByCat. 77.6%
RUBiS, ViewBidHistory 90.6%
RUBiS, ViewItem-qty-0 91.7%
RUBiS, ViewItem-qty-5 94.1%
RUBiS, ViewUserInfo 94.3%
overhead instructions doubles for each expansion in
data set size (Table 1), the instruction time delay only
increases with a factor 1.05 to 1.15 (Table 4). Results
obtained using the same formulas for the RUBBoS
and RUBiS experiments are shown in Table 6.
In conclusion, the estimated lower bound on en-
ergy saving we have found in the experiments per-
formed with discus amounts 71% for the Individual
View experiment with the small data set. This result
correlates well with the page generation times dis-
played in Figure 1, where approximately 3/4 of the
page generation time is eliminated when the overhead
is removed. Similar results are found in the results of
the RUBBoS and RUBiS benchmarks, with a lower
bound of 77.6%. We believe this is significant, es-
pecially when considering that the CPU and memory
consume almost half of the energy used by the entire
server.
6 RELATED WORK
Research has been done into the performance char-
acteristics of collaborative Web and Web 2.0 applica-
tions that emerged in the last decade. Stewart, Lev-
enti, and Shen (2008) examined a collaborative Web
application, where most content is generated by the
application’s users, and show that there is a funda-
mental difference between collaborative applications
and real-world benchmarks. Nagpurkar et al. (2008)
compareWeb 2.0 workloads to traditional workloads.
Due to the use of JavaScript and AJAX at the receiv-
ing end, many more small requests for data are made.
The research shows that Web 2.0 applications have
more “data-centric behavior” that results in higher
HTTP request rates and more data cache misses. The
quantification we presented in this paper does not at-
tempt to characterize workloads, instead it presents a
low-level quantification of where time is spent in pro-
gram codes executing web applications.
Altman, Arnold, Fink, and Mitchell (2010) in-
troduced a tool, WAIT, to look for bottlenecks in
enterprise-class, multi-tier deployments of Web appli-
cations. Their tool does not look for hot spots in an
application’s profile, but rather analyzes the causes of
idle time. It is argued that idle time in multi-tier sys-
tems indicates program code blocking on an operation
to be completed.
For our quantification we have used the HipHop
for PHP project (HipHip for PHP Project, n.d.) to
translate PHP source code to native executables. Sim-
ilarly, Phalanger compiles PHP source code to the Mi-
crosoft Intermediate Language (MSIL), which is the
bytecode used by the .NET platform. The effect of
PHP performance on web applications has thus been
noted in the past and we believe the existence of these
projects is an indication that PHP overhead is a valid
concern for large PHP code bases.
We have argued that development frameworks for
web applications bring about overhead by, for exam-
ple, the generality of such frameworks and the ab-
stract data access interface. Xu, Arnold, Mitchell,
Rountev, and Sevitsky (2009) argue that large-scale
Java applications using layers of third-party frame-
works suffer from excessive inefficiencies that can no
longer be optimized by (JIT) compilers. A main cause
of such inefficiencies is the creation of and copying
of data between many temporary objects necessary
to perform simple method calls. One reason why
this problem is not easily targeted is the absence of
clear hotspots. Xu et al. (2009) introduce a technique
called “copy profiling” that can generate copy graphs
during program execution to expose areas of common
causes of what the authors refer to as “bloat”.
SMARTGREENS2013-2ndInternationalConferenceonSmartGridsandGreenITSystems
196

One of the goals of the DBMS overhead elimina-
tion is to move both the query loop as well as the re-
sult set processing code into the same address space,
so that they can be optimized together as we have
done to estimate the DBMS API overhead. Some
approaches to optimize both the database codes and
the applications codes do already exist, for example,
the work on holistic transformations for web applica-
tions proposed by Manjhi, Garrod, Maggs, Mowry,
and Tomasic (2009) and Garrod, Manjhi, Maggs,
Mowry, and Tomasic (2008). These papers argue that
tracking the relationship between application data and
database data is a tool that might yield advancements.
Note that by eliminated the DBMS overhead we do
exploit this relationship, but rather by eliminating
the relationship by integrating application and DBMS
codes than by tracking this relationship. A similar
approach for holistic transformations for database ap-
plications written in Java is described by Chavan, Gu-
ravannavar, Ramachandra, and Sudarshan (2011).
7 CONCLUSIONS
In this paper we described and quantified several
sources of overhead in three web applications. This
quantification indicates that there is a tremendous po-
tential for optimization of web applications. Of the
total number of instructions executed to generate the
web pages in the investigated applications, close to
90% of the instructions can be eliminated, these are
non-essential instructions. Removal of non-essential
instructions has an approximately linear relationship
with the decrease in page generation time. This re-
sults in faster response times as well as significantly
reduced energy usage. We have seen a lower bound
on energy savings of approximately 70% for all ex-
periments performed in this study.
Considering the simplicity of the RUBBoS and
RUBiS code bases, we believe that the estimates
shown for these applications are a lower bound on
the performance that can be gained. Still, the results
are impressive. The more complex discus applica-
tion shows that performance increases between one
and two orders of magnitude are a possibility, solely
by reducing the number of non-essential instructions
that are executed.
For many web applications intensive optimization
of the code is not performed. At a first glance, it
appears more cost effective to deploy another set of
servers than to have expensive engineers optimize the
code. The frequent use of development frameworks
contributes to this. Note, that we have explicitly de-
fined our objective to optimize this kind of applica-
tions that is in widespread use, instead of focusing on
the already heavily optimized code bases of for exam-
ple Google and Facebook.
In the introduction we described that energy usage
of data centers is increasing quickly and is becoming
a larger problem on a month-to-month basis. Asso-
ciated with rising energy usage are rising electricity
bills for the operation of data centers. This is caused
not only by the increase in computing power, but also
by the increase in cooling capacity.
At this moment, no serious attention is paid to de-
creasing electricity usage by turning to software op-
timization. Instead, the focus is on making computer
hardware more energy efficient and to decrease the
server installed base by virtualization. We argue that
focusing solely on hardware issues is not enough to
keep the costs of data center operations under control
in the near future. Therefore, it is important that as
many non-essential MIPS as possible are eliminated
from the software code bases running in data centers.
To accomplish this, a quantification of where the non-
essential MIPS are located is a prerequisite. This pa-
per provides one such quantification.
REFERENCES
Altman, E., Arnold, M., Fink, S., & Mitchell, N. (2010).
Performance analysis of idle programs. In Proceed-
ings of the acm international conference on object ori-
ented programming systems languages and applica-
tions (pp. 739–753). New York, NY, USA: ACM.
Computer Economics, Inc. (2006, April). Best Prac-
tices and Benchmarks in the Data Center. http://
www.computereconomics.com/article.cfm?id=1116.
HipHip for PHP Project. (n.d.). HipHop for PHP. Re-
trieved July 2012, from https://github.com/facebook/
hiphop-php/wiki/
MySQL Project. (n.d.). libmysqld, the Embed-
ded MySQL Server Library. Retrieved July
2012, from http://dev.mysql.com/doc/refman/5.6/en/
libmysqld.html
ObjectWeb Consortium. (n.d.-a). JMOB - RUBBoS Bench-
mark. Retrieved July 2012, from http://jmob.ow2.org/
rubbos.html
ObjectWeb Consortium. (n.d.-b). RUBiS - Home Page. Re-
trieved July 2012, from http://rubis.ow2.org/
Chavan, M., Guravannavar, R., Ramachandra, K., & Sudar-
shan, S. (2011). DBridge: A program rewrite tool
for set-oriented query execution. Data Engineering,
International Conference on, 0, 1284-1287.
Fan, X., Weber, W.-D., & Barroso, L. A. (2007, June).
Power provisioning for a warehouse-sized computer.
SIGARCH Comput. Archit. News, 35, 13–23.
Garrod, C., Manjhi, A., Maggs, B. M., Mowry, T. C., &
Tomasic, A. (2008, October). Holistic Application
Analysis for Update-Independence. In Proceedings
QuantifyingEnergyUsageinDataCentersthroughInstruction-countOverhead
197

of the Second IEEE Workshop on Hot Topics in Web
Systems and Technologies (HotWeb).
Jonathan G. Koomey. (2011, Aug). Growth In Data Center
Electricity Use 2005 To 2010.
Manjhi, A., Garrod, C., Maggs, B. M., Mowry, T. C., &
Tomasic, A. (2009). Holistic Query Transformations
for Dynamic Web Applications. In Proceedings of
the 2009 IEEE International Conference on Data En-
gineering (pp. 1175–1178). Washington, DC, USA:
IEEE Computer Society.
Nagpurkar, P., Horn, W., Gopalakrishnan, U., Dubey, N.,
Jann, J., & Pattnaik, P. (2008). Workload characteri-
zation of selected JEE-based Web 2.0 applications. In
IISWC (p. 109-118).
Stewart, C., Leventi, M., & Shen, K. (2008). Empirical
examination of a collaborative web application. In
IISWC (p. 90-96).
U.S. Environmental Protection Agency. (2007, Aug). Re-
port to Congress on Server and Data Center Energy
Efficiency.
Xu, G., Arnold, M., Mitchell, N., Rountev, A., & Sevitsky,
G. (2009). Go with the flow: profiling copies to find
runtime bloat. In Proceedings of the 2009 ACM SIG-
PLAN conference on Programming language design
and implementation (pp. 419–430). New York, NY,
USA: ACM.
SMARTGREENS2013-2ndInternationalConferenceonSmartGridsandGreenITSystems
198
