
Precise VM Placement Algorithm Supported by Data Analytic Service
Dapeng Dong and John Herbert
Mobile and Internet Systems Laboratory, Department of Computer Science, University College Cork, Cork, Ireland
Keywords:
Cloud Computing, VM Placement, Forecast, Decision Support.
Abstract:
The popularity and commercial use of cloud computing has prompted an increased concern among cloud
service providers for both energy efficiency and quality of service. One of the key techniques used for the
efficient use of cloud server resources is virtual machine placement. This work introduces a precise VM
placement algorithm for power conservation and SLA violation prevention. The mathematical model of the
algorithm is supported by a sophisticated data analytic system implemented as a service. The precision of
the algorithm is achieved by allowing each individual VM to build, on demand, its own data model over
an appropriate time horizon. Thus the data model can reflect the characteristics of resource usage of the
VM accurately. The algorithm can communicate synchronously or asynchronously with the data analytic
service which is deployed as a cloud-based solution. In the experiments, several advanced data modelling
and use forecasting techniques were evaluated. Results from simulation-based experiments show that the
VM placement algorithm (supported by the data analytic service) can effectively reduce power consumption,
the number of VM migrations, and prevent SLA violation; it also compares favourably with other heuristic
algorithms.
1 INTRODUCTION
Cloud computing has gained hugely in popularity in
recent years. As the utility computing paradigm re-
quires massively server deployment, one of the main
concerns for a cloud service provider is the opera-
tional cost, especially the cost of power consumption.
Research indicates that servers in many organizations
typically run at less than 30% of their full capacity
(Barroso and Holzle, 2007) (Sargeant, 2010). Thus it
is possible to reduce power consumption of the hard-
ware by means of allocating more Virtual Machines
(VMs) to less hosts. VM placement is one of the
key techniques used for this purpose, and is exten-
sively studied. The basic principle of VM placement
is to allocate as many VMs on a physical server as
possible, while satisfying various constraints speci-
fied as part of the system requirements. Previous
work (prompted by business strategy or user pref-
erence) has focused on improving VM performance
and availability(Jayasinghe et al., 2011), scalability
(Jiang et al., 2012) (Biran et al., 2012) (Meng et al.,
2010), energy conservation (Verma et al., 2008), SLA
(Service Level Agreement) violation prevention (Be-
loglazov and Buyya, 2012), VM live migration cost
(Clark et al., 2005) (Liu et al., 2011), or a combina-
tion (Goudarzi et al., 2012) (Xu and Fortes, 2010). In
this work, both power conservation and SLA violation
prevention are considered.
The commercial use of cloud computing continues
to expand. An SLA is one of the main ways to deal
legally with QoS guarantees, and, as such, is of con-
cern to both consumers and service providers. Theo-
retically, QoS (Quality of Service) can be guaranteed
through appropriate resource provisioning via predic-
tion. Due to the dynamic and heterogeneous nature of
cloud services, predictions are often inaccurate. An
improved prediction accuracy is achieved in this work
by allowing each individual VM to build (on demand)
its own data model over an appropriate time horizon.
Thus the data model can reflect the characteristics of
resource usage of the individual VM accurately. The
mathematical modelling of the algorithm is supported
by a sophisticated data analytic system implemented
as a service. More specifically, the R open source data
analytic framework (R, 2012) is employed as deci-
sion support and a modelling engine. The R Decision
Support System (rDSS) is designed and deployed as
a cloud-based solution, providing services to the VM
placement algorithm.
The rDSS system architecture along with its use
in a simulation environment are described in later
sections. The system is used to evaluate the pro-
posed precise VM placement algorithm. The ex-
463
Dong D. and Herbert J..
Precise VM Placement Algorithm Supported by Data Analytic Service.
DOI: 10.5220/0004371904630468
In Proceedings of the 3rd International Conference on Cloud Computing and Services Science (CLOSER-2013), pages 463-468
ISBN: 978-989-8565-52-5
Copyright
c
2013 SCITEPRESS (Science and Technology Publications, Lda.)

perimental results show that our forecast-based ap-
proach, supported by the data analytic service, saves
0.03 ∼ 1.14kW /h in power consumption with up to
70% fewer VM migrations and a low rate of SLA vio-
lation (0.05% on average) over a six hour period when
compared to a non-forecast based power aware best fit
decreasing algorithm.
2 RELATED WORK
VM placement falls into the field of multi-objective
optimization, and it is often formulated as a Bin Pack-
ing or a Constraint Programming problem. Chen
et al. (Chen et al., 2011) proposed an Effective
Sizing guided VM placement algorithm. The pro-
posed Effective Sizings were calculated by comput-
ing least workload correlations with other VMs on
the target host. As VM consolidation is often an NP-
complete task, many researchers employ heuristic al-
gorithms in order to provide optimal solutions in a
timely fashion. A Power Aware Best Fit Decreasing
(PABFD) heuristic was proposed in the study of Be-
loglazov et al.(Beloglazov and Buyya, 2012). More
advanced heuristic algorithms were also employed by
researchers. such as Genetic Algorithms (GAs) as
used by Xu and Fortes (Xu and Fortes, 2010). Al-
though GAs may provide better solutions than simple
heuristic algorithms, but it’s not able to provide opti-
mal solutions in a timely fashion.
Recent research found that network communica-
tion consumes a considerable portion of energy in
cloud data centres (Meng et al., 2010)(Biran et al.,
2012). This is not surprising if one considers mov-
ing a number of VMs with memory footprint rang-
ing from a few hundred MB to tens of GB. Us-
ing VM migration as a technique for VM consolida-
tion can therefore cause both network performance
and VM performance to degrade significantly (Liu
et al., 2011)(Clark et al., 2005). Meng et al. (Meng
et al., 2010) present a traffic-aware algorithm for
VM placement. The authors formulate VM place-
ment as a Quadratic Assignment Problem and make
their solution aware of network topologies and net-
work traffic patterns. Cloud service providers rely
on forecasting for resource provisioning. Beloglazov
at el.(Beloglazov and Buyya, 2012) illustrate some
simple statistical and curve fitting techniques in their
study. More advanced techniques have also been cho-
sen by other researchers. In the study by Kusic at el.
(Kusic et al., 2008), the authors used a trained Kalman
filter to produce estimates of the number of workload
requests and to forecast the future state of the system.
Storage
1. Log history
2. Data address
& method
4. Forecast results
5. Consolidation
process
Cloud
Servers
rDSS
R
R
R
R
Controller
VM
Cloud Simulator
VM
VM
VM
VM
i. Embedded data and methods
3. Read data
ii. Forecast results
Figure 1: rDSS system architecture.
3 SYSTEM ARCHITECTURE
The rDSS system is a cloud-based solution. Resource
utilization information from each VM and host is
logged to a centralised cloud location (Figure 1). The
data collection process can be done by a hypervisor
or third party software. Data analytic servers that em-
ploy the R framework as an engine, are pre-packaged
Linux images that can run on VMs. The number
of data analytic servers can be scaled up on demand
since it’s cloud-based. A group of host machines are
controlled by a Controller. The Controller has three
responsibilities. Firstly, it segments historical data to
a specified length for each VM or host; this segmented
data will be used for building forecast models. Sec-
ondly, the Controller passes the address of data and
the specific modelling algorithm to the rDSS. Infor-
mation is sent programmatically by calling program
functions which have embedded R language clauses.
Communication can also be done asynchronously via
queues. In this case, information will be sent/received
as messages through queues. The asynchronous com-
munication approach is particularly useful when the
data set is large. The returned results can also be
received synchronously or asynchronously. Finally,
based on the forecast model and prediction results re-
turned from rDSS, the Controller carries out a consol-
idation process.
4 PROBLEM FORMULATION
Given a set H of hosts, a set V of virtual machines in
the cloud data centre and power consumption models
for each host, the objective is to decide how to rear-
range V on H such that the total power consumption
in the data centre is minimized, and the SLA violation
rate is kept as low as possible. All v ∈ V requirements
r
i
, must be satisfied by the targeting host; all v ∈ V
predicted CPU requirements {ˆr
i(t+n)
} must be satis-
CLOSER2013-3rdInternationalConferenceonCloudComputingandServicesScience
464

fied by the target host in order to minimize SLA vi-
olations; each h has a resource capacity limit C. The
total power consumption is the sum of power p
i j
con-
sumed by CPUs of each VM i on host j, plus a fixed
power f
j
consumed by the other components of host
j. Let h
j
= 1 represent choosing host j to be switched
on, and 0 otherwise. Also, let v
i j
= 1 represent the
assignment of VM i to host j, and 0 otherwise. The
mathematical model is outlined as follows:
min
∑
i∈V
∑
j∈H
p
i j
v
i j
+
∑
j∈H
f
j
h
j
s.t.
∑
i∈V
r
i
v
i j
6 Ch
j
∀ j ∈ H
∑
i∈V
{ˆr
i(t+n)
}v
i j
6 Ch
j
∀ j ∈ H
∑
j∈H
v
i j
= 1 ∀i ∈ V
v
i j
6 h
j
∀i ∈ V, j ∈ H
v
i j
, h
j
∈ {0,1} ∀i ∈ V, j ∈ H
One of the main causes of SLA violation is that
the requested resources (from VMs) can not be sat-
isfied by the resource providers (hosts). SLA viola-
tion minimization is done in two parts. In the first
part, forecast models are built for each VM based on
a certain length of historical data. The forecast model
is then used to predict the future CPU requirements
for each VM. The SLA is controlled as follows. Let
the matrix A ∈ R
+m∗n
denote the total m VMs in the
cloud; a list is associated with each VM which con-
tains n step-ahead forecast values, the number of steps
is adjusted according to the consolidation process fre-
quency; ˆr
i(t+n)
denotes the predicted CPU require-
ment for VM i at time t + n. For all VMs that have
been placed and/or going to be placed on host j con-
struct a matrix A
0
, A
0
j
⊆ A, i 6 m.
A
0
j
=
ˆr
0(t+1)
ˆr
0(t+2)
·· · ˆr
0(t+n)
.
.
.
.
.
.
.
.
.
.
.
.
ˆr
i(t+1)
ˆr
i(t+2)
·· · ˆr
i(t+n)
Such that
SLA(A
0
j
) |= {α
i
∑
k=0
ˆr
k(t+n)
6 Ch
j
, ∀n} (1)
Forecasting often contains errors. The second part of
SLA protection is to reserve a certain amount of re-
sources on each host to tolerate forecast errors and ac-
commodate sudden bursts in CPU requests indicated
by α in condition 1. The resource reservation strategy
is outlined as follows. If a host has less resources to
offer than the required buffers, it will be seen as over
utilized, then one or more VMs will be selected to mi-
grate to other host(s). The result of VM(s) migrating
to the target host(s) must not violate the conditions
1. VM migration results in VM performance degra-
dation, extra load on the network burden, and energy
cost (Liu et al., 2011)(Clark et al., 2005). The conclu-
sion of (Beloglazov and Buyya, 2012) is that smaller
VM migration time produces better results; and (Liu
et al., 2011) asserts that VM live migration time is
mainly determined by memory size, memory dirtying
rate, and network bandwidth. Based on these con-
clusions, the principle of smallest memory size first
is used in the selection of VMs for migration. For
simplicity, it is assumed that the memory dirtying rate
and network bandwidth are constants. In this work,
we reserve resources on each host statically.
As the proposed VM placement algorithm relies
heavily on the forecast results, an accurate forecast
model is at its foundation. As VMs are continu-
ously running in the cloud, the CPU utilization of
each VM at the sampling times generates a time se-
ries. It should be noted that due to the heterogeneity
of workloads, the time series of VMs often exhibit
different properties, and we need an adaptive way of
building forecast models without prior knowledge of
the types of workloads. Employing the powerful R
framework as decision support system, allows us to
produce forecasts based on advanced data modelling
techniques.
A prerequisite for the proposed algorithm is of
establishing connections between VMs and rDSS
servers. Once the connections are established, VMs
remain connected during their lifetime and the algo-
rithm maintains a map of VMs to connections. The
map is used as an input to the algorithm. Every
VM join/leave event will correspond to a map re-
freshment action. The VM placement process fol-
lows the same principle as the PABFD algorithm (Be-
loglazov and Buyya, 2012). The differences are that
any successful placement needs to satisfy both hard-
ware requirements (such as memory and storage) and
SLA requirements; over utilized hosts are determined
by examining the condition SLA(A
0
host
). Given the
power consumption model of each host, the reason for
choosing PABFD is that it allows VMs to be placed
on more power efficient hosts in a heterogeneous en-
vironment.
5 EVALUATION
The simulated environment is IaaS (Infrastructure as
a Service). It consists of 80 HP ProLiant ML110
G4, G5 hosts, randomly selected to build a heteroge-
neous cloud environment. Power consumption mod-
els of hosts were collected from (Spe, 2008). Mem-
PreciseVMPlacementAlgorithmSupportedbyDataAnalyticService
465
2.61
2.6
2.5
2.66
2.63
2.49
0.0
0.5
1.0
1.5
2.0
2.5
3.0
ARIMA ETS IID PABFD RW STS
Power (kW/h)
(a)
14.9
14.87
14.97
15.25
15.21
14.81
0.0
2.5
5.0
7.5
10.0
12.5
15.0
ARIMAETS IID PABFD RW STS
Power (kW/h)
(d)
0.12
0.17
0.21
0.23
0.11
0.09
0.00
0.05
0.10
0.15
0.20
0.25
0.30
ARIMAETS IID PABFD RW STS
SLA Overall (%)
(b)
1.82
1.97
1.95
2.31
2.89
2.09
0.0
0.5
1.0
1.5
2.0
2.5
3.0
ARIMA ETS IID PABFD RW STS
SLA Overall (%)
(e)
226
287
172
444
1139
408
0
250
500
750
1000
1250
ARIMAETS IID PABFD RW STS
Num of Migration
(c)
794
854
555
1032
2459
1023
0
500
1000
1500
2000
2500
ARIMAETS IID PABFD RW STS
Num of Migration
(f)
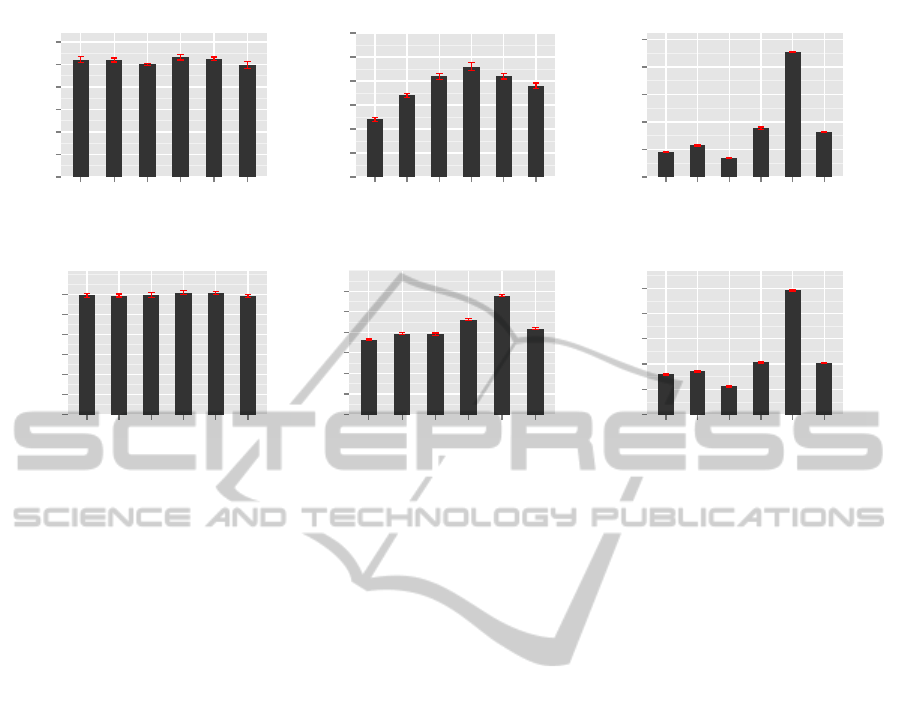
Figure 2: Experiment results from real-world server workloads and random workloads.
ory assignment for VMs are uniformly distributed in
the range 256MB ∼ 1GB. A set of mixed, real-world
server workloads were collected from (Beloglazov
and Buyya, 2012). They were given to each VM
during simulation. We use three sets of experiments
to evaluate the One-step ahead Forecast-based Power
Aware Best Fit Decreasing(F1PABFD) algorithm. All
sets of experiments use a configuration of one hun-
dred VMs and eighty hosts. The experiments sim-
ulated a cloud environment continuously operational
for six hours, with the consolidation frequency set to
five minutes.
Forecast models were built for each VM based on
two hours of historical data. We also compared our al-
gorithm with the PABFD (Local Regression and Min-
imum Migration Time) heuristics approaches (Bel-
oglazov and Buyya, 2012). Figure 2(a)(b) and (c)
show results from the first set of experiment. A set
of mixed, real-world server workloads were given to
each VM during simulation. The workloads are di-
rectly mapped to the CPU utilization of each VM.
They reflect 10.74% CPU utilization of each VM
on average. Figure 2(a),(b),(c) show comparison of
the total power consumption, number of VM migra-
tions, and overall SLA violation for each of the al-
gorithms respectively. It can be observed that our
F1PABFD algorithm is able to save 0.03 ∼ 0.17 elec-
tricity unit (kW/h) over the six hours operation com-
pared to PABFD. Among the algorithms, F1PABFD-
IDD produced the lowest power consumption. How-
ever, our forecast-based algorithm has a significantly
reduced number of VM migrations - up to 39% of that
achieved by F1PABFD-IDD. Based on accurate fore-
casting, our algorithm effectively prevented SLA vio-
lations by reducing overall SLA violation to the best
result of 0.12%, compared with 0.23% given by non-
forecast PABFD.
In the second set of experiments, we evaluated
the robustness of our algorithms. We performed ex-
actly the same experiments but with random work-
loads. The generated random workloads reflect ap-
proximately 53.2% CPU utilization of each VM on
average. In Figure 2(d), the power consumption
trends are similar to that produced in Figure 2(a). Be-
cause of the obvious reason that the workloads were
heavier, the power consumption is higher. With ran-
dom and heavier workloads, our algorithms start sav-
ing more energy – 0.03 ∼ 0.44 kW/h energy saving
for six hours operation compared with Figure 2(a).
We further prove this in the third set of experiments.
In Figure 2(f), we still observe a significant drop in
the number of VM migrations. In Figure 2(e) we
see a significant increase of SLA violations. There
are three possible reasons. 1) It’s caused by ran-
domness, because the randomness has a general neg-
ative effect on our forecast-based algorithm; 2) It’s
caused by the increased average CPU utilization on
each VM; 3) or both. The third set of experiments
aims to answer this question. For these more detailed
experiments, F1PABFD-IID, -STS, and -ARIMA al-
gorithms were selected for further evaluation, elimi-
nating F1PABFD-RW due to having the highest num-
ber of VM migration and F1PABFD-ETS due to hav-
ing lowest performance (Figure 4).
In the third set of experiments, we evaluated how
the weight of workloads effect our algorithms. We
generated eight sets of workloads artificially based on
the real-world server workloads used in the first ex-
CLOSER2013-3rdInternationalConferenceonCloudComputingandServicesScience
466
●
●
●
●
●
●
●
●
●
●
●
●
●
●
●
●
●
●
●
●
●
●
●
●
●
●
●
5
10
15
20
25
200
400
600
0.00
0.05
0.10
0.15
0.20
Power (kW/h)
Num of Migration
Overall SLA (%)
10 20 30 40 50 60 70 80 90
Average CPU utilization (%)
Algorithm
●
ARIMA
IID
NONE
STS
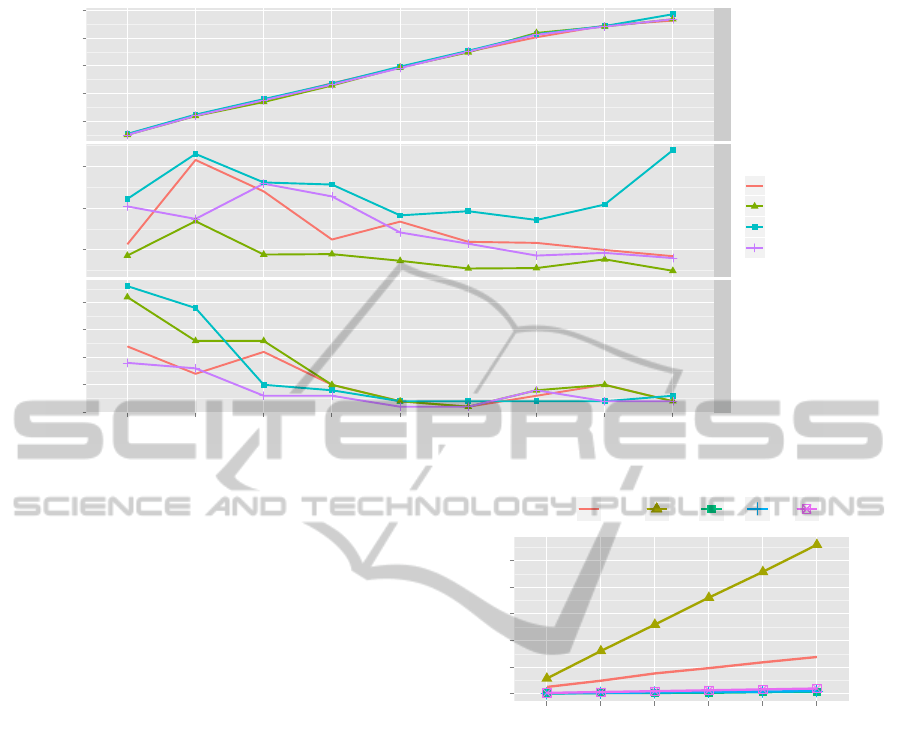
Figure 3: Experiment results from real-world workloads.
periment. To preserve the characteristics of the origi-
nal workloads as much as possible, such as trends and
periodicity, etc, we added a constant to each workload
value; and gradually increased the weight of the aver-
age workloads from 10.74% (original) up to 90%. In
Figure 3, we calculated that all F1PABFD-based al-
gorithms consume 0.03 ∼ 1.14kW/h less power than
the non-forecast PABFD. A significant power drop is
observed at the average weight of workloads of 90%.
The reason is as follows. When the average workload
(average CPU utilization of each VM) is reaching full
capacity, the changes in the CPU utilization curves
become more smooth. Our forecast results become
more accurate; VM placement decisions based on the
forecast results can be more accurate, and fewer active
hosts are required. Consequently power consumption
is reduced. The more accurate forecasting also re-
sults in lower SLA violations. This can be observed
in the end portion of Figure 3. Another observation
is that SLA violation becomes higher when average
workloads become lower. This is because when CPU
utilization of each VM is lower, more VMs will be as-
signed to a host. When a host becomes more compact,
it increases uncertainty of resource requirements. An
improvement can be made by dynamically reserving
more resources on each host according to the level
of the average workloads. This is planned for future
implementation. We also noticed that SLA violation
didn’t increase with the increasing weight of work-
loads. Therefore, we concluded that the observed sig-
nificant increase in SLA violation in Figure 2 (e) was
caused by the randomness of the workload. Overall,
our F1PABFD algorithm performs much better than
●
●
●
●
●
●
0
10
20
30
40
50
25 50 75 100 125 150
Number of VMs
Seconds
Algorithm
●●●●●
ARIMA ETS IID RW STS
Figure 4: Algorithm performance.
the original PABFD, and especially in reducing the
number of VM migrations. In the middle facet of Fig-
ure 3, we observe that F1PABFD-IID, -STS, -ARIMA
algorithms can reduce the number of VM migra-
tions by 3/1.5/1.5 times on average respectively, com-
pared with PABFD. Among them, F1PABFD-STS, -
ARIMA performed consistently well; F1PABFD-IID
was best at reducing VM migrations. Considering that
F1PABFD-ARIMA is much slower (Figure 4) than -
STS and -IID, F1PABFD-STS and -IID are recom-
mended. Depending on the status of the network for
the cloud, F1PABFD-IID may be preferred over -STS.
Therefore, there is an opportunity for researching dy-
namic algorithm switching based on network status.
6 CONCLUSIONS
This paper has described a forecast-based VM place-
ment algorithm with power aware best fit decreasing
PreciseVMPlacementAlgorithmSupportedbyDataAnalyticService
467

heuristic algorithms for cloud server consolidation.
Our main concerns are power consumption and SLA
violation. We designed and deployed an architecture
using cloud-based R servers as the decision support
system. Forecast models were built for each VM, and
predictions made as to their future CPU resource re-
quirements. The simulation-based experiments anal-
ysed the proposed algorithms with respect to their
consistency, robustness, and performance. The re-
sults demonstrate that the proposed approach, com-
pared with other heuristics, can significantly reduce
power consumption, the number of VM migrations,
and number of SLA violations. The analytical model
has not taken load-balancing into consideration, and
this will be addressed in future work.
ACKNOWLEDGEMENTS
This work is supported by the Telecommunications
Graduate Initiative (TGI) program which is funded by
the Higher Education Authority under the Programme
for Research in Third-Level Institutions (PTRLI) Cy-
cle 5 and co-founded under the European Regional
Development Fund (ERDF).
REFERENCES
(2000 - 2012). R porject. http://www.r-project.org.
(2008). Spec. http://www.test.org/doe/.
Barroso, L. and Holzle, U. (2007). The case for energy-
proportional computing. Computer, 40(12):33 –37.
Beloglazov, A. and Buyya, R. (2012). Optimal online de-
terministic algorithms and adaptive heuristics for en-
ergy and performance efficient dynamic consolidation
of virtual machines in cloud data centers. Concur-
rency and Computation: Practice and Experience,
24(13):1397–1420.
Biran, O., Corradi, A., Fanelli, M., Foschini, L., Nus, A.,
Raz, D., and Silvera, E. (2012). A stable network-
aware vm placement for cloud systems. In Proceed-
ings of the 2012 12th IEEE/ACM International Sym-
posium on Cluster, Cloud and Grid Computing (ccgrid
2012), pages 498 –506.
Chen, M., Zhang, H., Su, Y.-Y., Wang, X., Jiang, G., and
Yoshihira, K. (2011). Effective vm sizing in virtual-
ized data centers. In Integrated Network Management
(IM), 2011 IFIP/IEEE International Symposium on,
pages 594 –601.
Clark, C., Fraser, K., Hand, S., Hansen, J. G., Jul, E.,
Limpach, C., Pratt, I., and Warfield, A. (2005). Live
migration of virtual machines. In Proceedings of the
2nd conference on Symposium on Networked Systems
Design & Implementation - Volume 2, NSDI’05, pages
273–286.
Goudarzi, H., Ghasemazar, M., and Pedram, M. (2012).
Sla-based optimization of power and migration cost
in cloud computing. In Cluster, Cloud and Grid Com-
puting (CCGrid), 2012 12th IEEE/ACM International
Symposium on, pages 172 –179.
Jayasinghe, D., Pu, C., Eilam, T., Steinder, M., Whally,
I., and Snible, E. (2011). Improving performance
and availability of services hosted on iaas clouds with
structural constraint-aware virtual machine place-
ment. In Services Computing (SCC), 2011 IEEE In-
ternational Conference on, pages 72 –79.
Jiang, J., Lan, T., Ha, S., Chen, M., and Chiang, M. (2012).
Joint vm placement and routing for data center traffic
engineering. In INFOCOM, 2012 Proceedings IEEE,
pages 2876 –2880.
Kusic, D., Kephart, J., Hanson, J., Kandasamy, N., and
Jiang, G. (2008). Power and performance man-
agement of virtualized computing environments via
lookahead control. In Autonomic Computing, 2008.
ICAC ’08. International Conference, pages 3 –12.
Liu, H., Xu, C.-Z., Jin, H., Gong, J., and Liao, X. (2011).
Performance and energy modeling for live migration
of virtual machines. In Proceedings of the 20th inter-
national symposium on High performance distributed
computing, HPDC ’11, pages 171–182. ACM.
Meng, X., Pappas, V., and Zhang, L. (2010). Improving the
scalability of data center networks with traffic-aware
virtual machine placement. In INFOCOM, 2010 Pro-
ceedings IEEE, pages 1 –9.
Sargeant, P. (2010). Data centre transformation: How ma-
ture is your it? Gartner. Inc.
Verma, A., Ahuja, P., and Neogi, A. (2008). pmapper:
power and migration cost aware application place-
ment in virtualized systems. In Proceedings of the
9th ACM/IFIP/USENIX International Conference on
Middleware, Middleware ’08, pages 243–264.
Xu, J. and Fortes, J. (2010). Multi-objective virtual machine
placement in virtualized data center environments. In
Green Computing and Communications (GreenCom),
2010 IEEE/ACM Int’l Conference on Int’l Conference
on Cyber, Physical and Social Computing (CPSCom),
pages 179 –188.
CLOSER2013-3rdInternationalConferenceonCloudComputingandServicesScience
468
