
Improving Tag Suggestion for Places using Digital Map Data
Martin Garbe
Department of Computer Science, University of Rostock, Albert-Einstein-Str. 22, Rostock, Germany
Keywords:
Data Mining, Activity, Classification, Geographical Data, Tag Suggestion.
Abstract:
Today, tagging photos and website bookmarks is widely used. Geographical data is an additional type of
resource which can be tagged. Locations representing geographic information can be tagged depending on
activities done there. In this paper we present an explorative study to answer the question whether geographical
map data can be used to describe similarities between places. When map data can be used to identify similar
places services like tag suggestion could be improved. For the study very detailed crowd-sourced map data
was used. In a period of four month places were manually tagged with activities done. A measurement for
finding places which are similar in the sense of tagging is also presented. To evaluate our idea, we trained
three machine learning classifiers (Decision Tree, Support Vector Machine, Naive Bayes). With a precision of
73% and a recall of 65% Decision Tree performed best. Our results indicate that crowd-based map data can
assist in tagging geographical resources and can improve tag suggestion services.
1 INTRODUCTION
To simplify retrieval of information resources needs
to be structured. Besides static hierarchies keywords
and tags can be used. This tagging process dynami-
cally structures data. It is implemented by many ap-
plications, e.g. website bookmarking
1
, photo man-
agement
2
and scholarly reference management
3
.
Our work concentrates on tagging spatial data,
particularly places. The idea is to facilitate tag sug-
gestion for places. Our main application example is
personal life logging. Here the user records his move-
ment over a longer period of time. Visited places can
be tagged in a ways similar to photos. We concen-
trate on tags for activities done at locations. Our work
is not restricted to personal life logging because once
tags found for locations information can be used for
all geo-annotated resources, like photos, videos and
texts.
With an explorative study we investigate the ques-
tion whether tag suggestion for places is possible es-
pecially using map data. To define similarities be-
tween places geographic data is needed. Our general
question can be translated into the question whether
there is a similarity measure for places.
To find similar places we extract features from
1
www.del.icio.us
2
www.flikr.com
3
www.citeulike.com
map data. Afterwards we use machine learning to find
structures in places tagged equally. When a structure
for equal tags can be found, a machine learning clas-
sifier will be able to separate places of different types
successfully. In this case we can estimate that tag sug-
gestion for places is possible using map data.
This paper is organized in the following way. Sec-
tion 2 summarizes existing work in the field of tag
suggestion and tagging of place with semantic mean-
ing. Section 3 states more precisely which activities
and places we are interested in. Data source and a
similarity measure is presented in Section 4. Clas-
sification and evaluation approach is also explained
in this section. An analysis of the collected tagged
places is given in Section 5. Steps for data prepa-
ration, classification results and a discussion is pre-
sented in Section 6. Finally in Section 7 we draw
conclusions and give an outlook.
2 RELATED WORK
This work can be categorized between two main re-
search topics. On the one hand the aim is to tag re-
sources and suggest tags which is a research topic in
the web information retrieval area. But here mainly
web resources are analyzed and no map data. On the
other hand in our study activities are classified which
is a topic in activity recognition.
453
Garbe M..
Improving Tag Suggestion for Places using Digital Map Data.
DOI: 10.5220/0004372104530458
In Proceedings of the 9th International Conference on Web Information Systems and Technologies (WEBIST-2013), pages 453-458
ISBN: 978-989-8565-54-9
Copyright
c
2013 SCITEPRESS (Science and Technology Publications, Lda.)

2.1 Tag Suggestion
Research work having similar goals as we have is (Lin
et al., 2010). There users annotate places in a social
network scenario. The check-in behavior is used to
describe places and their similarities. Places can be
annotated by users. Many places are annotated but
there are also many places with tags missing. For
these places tags could be suggested. The work dif-
fers from ours in the way that we use map features
extracted from a geographical database. Lin et al. ex-
tract only temporal features, like maximum number of
check-ins by a single visitor. Another research work
(Moxley et al., 2008) developed the SpiritTagger sys-
tem. This tool suggests tags for photos while con-
sidering geographical aspects. They mined tags from
Flikr and created a database of images, extracted fea-
tures and geographic locations. Photos are filtered by
geographic location. Only tags from similar photos
nearby are suggested. In this work tags are suggested
but no map data is used. They only respect geograph-
ical nearness.
A research area near to our activity is activity
recognition (AR). In the field of AR activities are rec-
ognized and predicted. These activities can much dif-
fer in scale of time and space. Depending on the sit-
uation information can be presented in a proper way
and more selective. Detecting moving or transporta-
tion type is done by (Ermes et al., 2008; Zheng et al.,
2008; Zheng et al., 2010). These activities are of
large geographical scale. We concentrate on activ-
ities in a smaller geographical area, building scale.
Very similar to our work the authors of (Liao et al.,
2005) want to label locations automatically. Using
supervised learning a model is created with can la-
bel locations as ”AtHome”, ”AtWork”, ”Shopping”,
”DiningOut”, ”Visiting” and ”Others”. They also use
some geographic evidence, e.g. is a restaurant in a
certain range. The work differs to ours in the way that
we are not restricted to a preset of tags.
2.2 Sematics of Place Tags
Different types of tags can be extracted when analyz-
ing tagging behavior of users without any restriction
which tags to use. The question how to tag places was
examined in (Rattenbury and Naaman, 2009). The au-
thors answer the question which type of tags can de-
scribe semantics of places. As a result of the work
tag distribution has to concentrate on the geographi-
cal small region to represent a place tag. We will use
this definition later one to classify tags in our study.
Another work with location-based social networking
services is (Lin et al., 2010). Tags used for location
sharing were classified as semantic or geographic in-
formation. The geographic tags are of different scale,
e.g. floor or city, and have different sub-classes. Some
of these can also be found in our study. Our works
differs in that we also collected activity tags.
3 DEFINITIONS
Semantics of ”places” can differ in many ways. The
term can be used to describe for example a city, a
country or a house. In the following we substantiate
the term ”place” to make clear what kind of resources
were tagged in the study. Similarly the term ”activity”
can have several meanings. For a better understand-
ing of activity tags later used we also clarify the term
”activity”.
3.1 Definition of Geographic Places
The term ”place” can be used in many different ways.
There is no common definition. We will motivate our
definition from the application perspective.
Aim of life logging is to document life. Visited
places can be tagged with activity descriptions. Places
can have different geographical scales. For example
Lin et al. (Lin et al., 2010) analyzed users tagging be-
havior for places. They classified tags into categories
”floor/room”, ”house/building”, ”street/intersection”,
”region/neighborhood”, ”city” and ”state”. Users re-
gard all these categories as places.
We concentrate on scale ”house/building” for sev-
eral reasons. We use map data which has most in-
formation of level ”house/building” and larger scale.
When looking for floor plans many malls and public
buildings offer such a plan but often only in a for-
mat usable for humans and not for automatic analy-
sis. Thus, we do not incorporate this information in
our study. Furthermore, in our scenario places are
not of scale ”city” or ”state” because the study took
place in only one city. Scales ”street/intersection” and
”region/neighborhood” do not have clear boundaries
which can be described to users.
3.2 Definition of Activities
When choosing activity tags for places a substanti-
ation is necessary. Which activities and therefore
which tags should be used? In our study we focused
on activity tags and place tags. Activities can be done
in different time and spatial scale. What we are not
interested in are activities of transportation mode, like
driving or walking (Liao et al., 2007). Our activities
are limited to geographical building size dimensions.
WEBIST2013-9thInternationalConferenceonWebInformationSystemsandTechnologies
454

state
city
region/neighborhood
street/intersection
house/building
floor/room
seconds minutes hours days
dining
shopping
cycle to work
washing hands
indoor sports
marathon
spatial distribution
temporal
distribution
working in office
Figure 1: Space-time diagram for activity classification
with examples. We are interested in activity lying inside
solid area.
Figure 1 shows the category of activities we are
interested in. In the figure a categorization of tempo-
ral and spatial distribution is made. We are interested
in activities which lie within the solid area. These
activities last from some minutes, e.g. shopping, to
several hours, e.g. working. Also the spatial distribu-
tion is limited. This is directly linked to our definition
of places. Activities like ”cycle to work” are not in
our focus because they do not take place in a build-
ing scale location. To explain which activities should
be tagged scenario of life logging is used. When users
do many activities in one place they have to choose for
themselves how to tag this. One possibility is to tag
this place with the most important activity. Another
way is to tag all activities done there. The preferred
habit of tagging depends on the user.
The tags in the study were explicitly not restricted
on a preset of activities. This decision was also mo-
tivated by the scenario of tagging every day life and
findings of (Lin et al., 2010). They discovered that
every user has its own way of tagging, its own way of
abstraction level and its own way of how to remem-
ber places. Our question was: What is a user tagging
when there are no restrictions?
4 SIMILARITY OF PLACES
4.1 Spatial Data Source
To compute similarity between places a detailed ge-
ographical data source is needed. Such data can be
found in ”point of interest” (POI) databases, e.g. Yel-
low Pages
4
or Google Places
5
. Points of interest are
locations which are of any interest. Popular exam-
ples are restaurants or gas stations. In general these
databases save detailed information about object in-
teresting for people. For example a restaurant object
can have additional information about opening hours
4
www.yellowpages.com
5
www.google.com/places/
School
x
Restaurant
School
x
P2
x
Shop
x
Restaurant
x
Shop
x
P1
a)
b)
Figure 2: Distance calculated between objects. Figure a)
shows that distance from place P1 to School border. In b)
P2 has distance 0 for School because it lies within.
and wheelchair accessibility. Representing locations
geographical is done by a latitude, longitude tuple.
Boundaries of POI object are not known.
Our approach is to use hybrid maps. These maps
contain information about POIs and additionally ge-
ographical information like building outlines. One
examples of this category is OpenStreetMap (OSM).
The database of OSM enables POIs to be represented
by centroid and also as geographical polygon. One
effect of such a grassroot approach is that details on
the map vary much depending on the region. In large
cities many people contribute and thus create very de-
tailed map information whereas in less populated ar-
eas only a few information is available.
4.2 Similarity Measure
Similarity of places needs to be calculated for later tag
suggestion. With machine learning, classifiers try to
find similarities between places. A place is described
by its surrounding area. Figure 2 describes two exam-
ples. The description includes a list of nearby objects
and their distance to the current place. In Figure 2
places P1 and P2 can be described with their distances
to the objects (Shop, Restaurant, School). In Figure 2
a) the distance from P1 to School is the shortest path
between polygon and point. In 2 b) the distance be-
tween P2 and School is 0. Possible distance vectors
for P1 and P2 are:
Shop
Restaurant
School
P1 =
10
13
11
P2 =
15
35
0
Working with polygons has advantages when working
with large buildings and large areas in general, e.g.
shopping mall or zoo. As distance measure we use
euclidean distance. All geographical objects within a
radius of 100 meters where considered to characterize
a place.
4.3 Classification & Evaluation
The data we are working with are tagged places. Tag
suggestion can be evaluated when user tag resources
ImprovingTagSuggestionforPlacesusingDigitalMapData
455

and the system suggests new tags. Afterwards the
number of suggested tags and the number of accepted
tags is compared. An ideal tag suggestion algorithm
suggests tags which are all accepted by the user. Deal-
ing with classifiers these tags are true positives (TP).
Tags not accepted by users are false positives (FP).
Tags not suggested but manually added by users are
called false negatives (FN). Tags of category true neg-
atives (TN) are not suggested and not assigned.
For every tag one classifier is trained. In gen-
eral there is no best classifier. It always depends on
the data. We learned three different classifiers (De-
cision Tree, Naive Bayes, Support Vector Machine),
and compared their performance. We used Linear-
ForwardSelection algorithm (Gutlein et al., 2009) for
feature selection.
5 DATASET
For our study moving data had to be collected, places
extracted and annotated. In a four month period one
person collected movement data using an external
GPS receiver (Columbus V900). At the end of each
day the user had to extract places from movement data
and annotate these. The user had to tag with life log-
ging scenario in mind. Our aim was to analyze which
tags for activities were done at which locations. We
made no further restrictions on deciding which places
to extract. This lack of conceptual clarity was in-
tended. We wanted to know which type of places
and activities the user would choose and what level
of granularity makes sense for the user. At the end of
the study a dataset of 90 different tags and 157 places
were created.
Evaluating tagged places it was interesting to see
that the user tagged some places with place descrip-
tions or meanings but not with the actual activity he
did. One prominent example is the tag home. At this
location the user decided not to describe activities for
this location but generalizing these with a place name.
Another finding was that activity tags often occurred
in addition to place description tags. For example
shopping as activity tag and bakery as place descrip-
tion or supermarket.
A plot showing tags and their usage can be found
in Figure 3. The graphic shows how often tags were
used. The x and y-axes are in logarithmic scale.
The data shows a typical power-law distribution seen
in many other applications (Capocci and Caldarelli,
2008) using tags.
1 10 100
1
10
100
1000
Tag index (log scale)
Tag frequency (log scale)
Figure 3: Tag frequency: power-law distribution.
6 EVALUATION
In the following we present steps to prepare classifi-
cation followed by results of classification task and a
discussion.
6.1 Preparation
Before classification data needs to be prepared. We
need to train classifiers using training sets and test
the created models using testing sets. For this 10-fold
cross-validation was used.
We build one classifier for each tag. Tags only
used at one place, e.g. home, cannot be learned by our
classifiers. Learning these tags would result in an un-
balanced dataset with one home place and 156 other
places. Many classifiers have problems with unbal-
anced data (Chawla, 2010). To solve this oversam-
pling or undersampling can be used. Oversampling
items which were tagged only less would result in du-
plicated items and therefore results in over-fitting. We
used undersampling (Chawla et al., 2002). The disad-
vantage is that potentially useful items are ignored.
But this is a small disadvantage compared to disad-
vantages of oversampling.
6.2 Classification
If a tag is used many times for the same location we
count it only once because over-fitting would influ-
ence our classification results. Preparing classifica-
tion process Feature Selection was done. This reduces
the amount of all features (233) to the relevant ones.
Overall 157 tags were used. Only six of them oc-
curred in more than six different places. These can
be used for classification as explained in Section 6.1.
Classifiers were trained and evaluated for each tag.
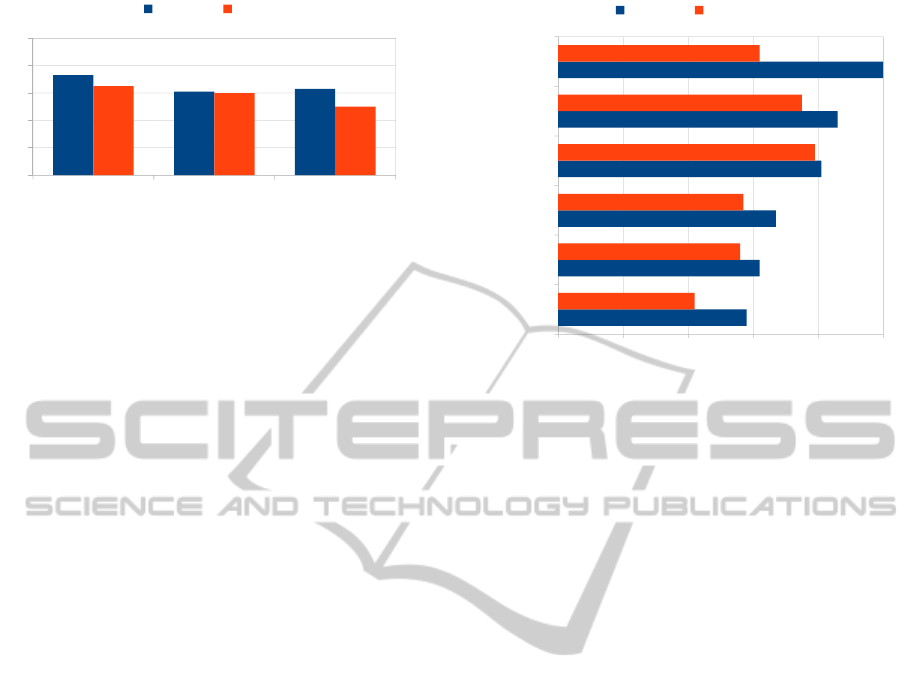
In Figure 4 precision and recall of different classi-
fiers are presented. In average the Decision Tree (DT)
classifier performs best with precision of 0.73 and re-
call of 0.65. The second best classifier Naive Bayes
WEBIST2013-9thInternationalConferenceonWebInformationSystemsandTechnologies
456
Decision Tree
Naive Bayes
Support Vector Machine
0
0.2
0.4
0.6
0.8
1
Precision Recall
Figure 4: Performance of different classifiers.
(NB) suggested tags with a precision of 0.61 in aver-
age and a recall of 0.60. Finally Support Vector Ma-
chine (SVM) performs slightly worse with a precision
of 0.63 and recall of 0.50. For further details we con-
centrate on DT because this classifier performed best.
For classification and evaluation WEKA data mining
software was used.
In Figure 5 precision and recall values of the six
classified tags are presented. These tags could be
classified best. Precision represents how exact the
suggested tags were. In the ideal case precision is
1 which means that all the regarding tags were sug-
gested for places where it was used by the user. The
value 0 means it was not suggested or it was sug-
gested on places where the user did not used it. High
recall values express that most of the users tagged
places were also tagged using the learned classifier. If
the classifier suggests too little places for a tag recall
value will be low. As Figure 5 shows some tags could
be suggested very good. This suggests that map fea-
tures can assist in tagging. Features used to classify
these tags can be learned by classifiers. A structure
in geographic data could be found in similar tagged
places.
6.3 Discussion
In the four month period 90 different tags were used
to annotate activities in places. Not only activity tags
were used but also tags describing places. Place tags
were used to substantiate activities and in situations
where a short activity tag was not usable, e.g. home.
Only a small part of it, were used in more than six dif-
ferent places. Models learned for each tag can classify
half of the tags better than 50% regarding precision
and recall. What does it mean for the scenario of tag-
ging places in personal life logs? Our results indicate
that detailed map data can assist in creating tag sug-
gestions and therefore help tagging places in personal
life logs. It also shows that activities done in many
locations can be recognized and used for automatic
tagging. Tag suggestion for places is not restricted to
life log scenario. It can also be used in applications
eating
meet friends
bakery
shopping
playing
working
0 0.2 0.4 0.6 0.8 1
Precision Recall
Figure 5: Precision and recall of classified tags using Deci-
sion Tree.
when resources have an geographic position associ-
ated. For geo-referenced images tags could also be
created.
Regarding life logging scenario we only evaluated
tags used in different places. Methods to suggest tags
for locations often visited but only in one location was
not focused in this work. Research on those tags and
activities, e.g. home, is already done by others, e.g.
(Liao et al., 2005). Here algorithms taking time into
consideration are more successful.
One shortcoming of our work is that only one per-
son took part in the study. Therefore this work is an
explorative study. It is planned to repeat the analysis
with a wider range of people.
7 CONCLUSIONS & OUTLOOK
Tags can be used to organize resources, like images
and bookmarks. A tag suggestion mechanism can
assist in the process and ensure the use of the same
words for same facts. Geographical locations can be
tagged with activities done there.
We studied tagging behavior of one person in a pe-
riod of four month in a life logging scenario. The used
tags can be classified as tags describing activities and
tags describing places. On the one hand place tags
were used because they implied activities and on the
other hand to refine activity descriptions. To evaluate
the possibility of tag suggestion we created different
classifiers for each tag. Decision Tree produced the
best results with an average precision of 73% and re-
call of 65%. These results suggest that detailed map
data, like OpenStreetMap, should be considered when
creating tag suggestions for geographical resources.
This can also be used for geographical annotated im-
ImprovingTagSuggestionforPlacesusingDigitalMapData
457

ages and texts.
We plan to repeat the study with more people in
different regions. The influence of detailed map data
depending on the region has to be evaluated. We also
plan to incorporate suggestions for activities which
were only done in one place using time-dependent
models.
REFERENCES
Capocci, A. and Caldarelli, G. (2008). Folksonomies
and clustering in the collaborative system citeulike.
Journal of Physics A: Mathematical and Theoretical,
41(22):224016.
Chawla, N. V. (2010). Data mining for imbalanced datasets:
An overview. In Data Mining and Knowledge Discov-
ery Handbook, pages 875–886.
Chawla, N. V., Bowyer, K. W., Hall, L. O., and Kegelmeyer,
W. P. (2002). Smote: Synthetic minority over-
sampling technique. Journal of Artificial Intelligence
Research, 16:321–357.
Ermes, M., Parkka, J., Mantyjarvi, J., and Korhonen, I.
(2008). Detection of daily activities and sports with
wearable sensors in controlled and uncontrolled con-
ditions. Information Technology in Biomedicine, IEEE
Transactions on, 12(1):20 –26.
Gutlein, M., Frank, E., Hall, M., and Karwath, A. (2009).
Large-scale attribute selection using wrappers. In
CIDM, pages 332–339.
Liao, L., Fox, D., and Kautz, H. (2005). Location-based ac-
tivity recognition using relational markov networks.
In Proceedings of the 19th international joint confer-
ence on Artificial intelligence, IJCAI’05, pages 773–
778, San Francisco, CA, USA. Morgan Kaufmann
Publishers Inc.
Liao, L., Patterson, D. J., Fox, D., and Kautz, H. (2007).
Learning and inferring transportation routines. Artif.
Intell., 171:311–331.
Lin, J., Xiang, G., Hong, J. I., and Sadeh, N. (2010). Mod-
eling people’s place naming preferences in location
sharing. In Proceedings of the 12th ACM international
conference on Ubiquitous computing, Ubicomp ’10,
pages 75–84, New York, NY, USA. ACM.
Moxley, E., Kleban, J., and Manjunath, B. S. (2008). Spirit-
tagger: a geo-aware tag suggestion tool mined from
flickr. In MIR ’08: Proceeding of the 1st ACM in-
ternational conference on Multimedia information re-
trieval, pages 24–30, New York, NY, USA. ACM.
Rattenbury, T. and Naaman, M. (2009). Methods for ex-
tracting place semantics from flickr tags. ACM Trans.
Web, 3(1):1–30.
Zheng, Y., Chen, Y., Li, Q., Xie, X., and Ma, W.-Y.
(2010). Understanding transportation modes based
on gps data for web applications. ACM Trans. Web,
4(1):1–36.
Zheng, Y., Liu, L., Wang, L., and Xie, X. (2008). Learning
transportation mode from raw gps data for geographic
applications on the web. In Proceeding of the 17th
international conference on World Wide Web, WWW
’08, pages 247–256, New York, NY, USA. ACM.
WEBIST2013-9thInternationalConferenceonWebInformationSystemsandTechnologies
458
