
A Visual Notation for the Integrated Representation of OWL Ontologies
Stefan Negru
1
and Steffen Lohmann
2
1
Faculty of Computer Science, Alexandru Ioan Cuza University, General Berthelot 16, 700483 Iasi, Romania
2
Institute for Visualization and Interactive Systems (VIS), Universit¨atsstraße 38, 70569 Stuttgart, Germany
Keywords:
Ontology Visualization, Visual Notation, OWL, Semantic Web, Knowledge Visualization, Ontologies.
Abstract:
The paper presents a visual notation for the Web Ontology Language (OWL) providing an integrated view
on the classes and individuals of ontologies. The classes are displayed as circles, with the size of each circle
representing its connectivity in the ontology. The individuals are represented as sections in the circles so that
it is immediately clear from the visualization how many individuals the classes contain. The notation can
be used to visualize the property relations of either the classes (conceptual layer) or of selected individuals
(integrated layer), while certain elements are always shown for a better understanding. It requires only a small
number of graphical elements and the resulting visualizations are comparatively compact. Yet, the notation is
comprehensive, as it defines graphical representations for all OWL elements that can be reasonably visualized.
The applicability of the notation is illustrated by the example of the Friend of a Friend (FOAF) ontology.
1 INTRODUCTION
The Web of Data has attracted large interest for both
data publishers and consumers in the last years. Sev-
eral organizations have begun publishing their data in
RDF (Resource Description Framework)
1
and link-
ing it with other data, leading to a significant growth
in RDF triples available on the Web of Data (Bizer
et al., 2009). As (Dadzie and Rowe, 2011) point out
“making sense of such data presents a huge challenge
to the research community”. User-centered visualiza-
tions are considered essential to help people under-
standing the data.
Ontologies play a key role in this context. An on-
tology is defined as “a set of knowledge terms, includ-
ing the vocabulary, the semantic interconnections and
some simple rules of inference and logic, for some
particular topic” (Hendler, 2001). The primary pur-
pose of an ontology is to classify things in terms of
semantics for a specific domain. Ontologies provide
the backbone for publishing RDF data in a semanti-
cally meaningful way. Especially the Web Ontology
Language (OWL)
2
is widely used to define the con-
ceptual schema, the classes, individuals, and the re-
lationships between them. However, OWL is mainly
designed for use by applications in order to support
interoperable data exchange, machine processing, and
1
http://www.w3.org/RDF/
2
http://www.w3.org/2004/OWL/
reasoning. Even though it provides great means to de-
scribe and integrate information on the Web, its text-
based representation is difficult to understand for av-
erage users.
While the World Wide Web Consortium (W3C)
3
provides a notation for the visualization of RDF
graphs
4
, it does not provide a notation for OWL.
Since any OWL ontology can be represented as RDF
graph, it can also be visualized using the RDF no-
tation. However, as every single RDF statement is
separately visualized, this can result in very large vi-
sualizations with plenty of nodes and edges. Such
RDF visualizations of OWL ontologies are not only
hard to read but they also fail to adequately reflect the
OWL semantics, as the OWL constructs are split up
into multiple RDF triples.
Therefore, research has addressed the issue of
providing visualizations for OWL ontologies. How-
ever, most of the existing approaches representclasses
and individuals in a mutually exclusive manner, with-
out providing an integrated view. Moreover, differ-
ent graphical representations are used to depict the
classes, individuals, properties, and their relation-
ships. An integrated view on ontologies that uses a
uniform graphical representation can therefore be re-
garded as crucial for a better understanding of ontolo-
gies and linked data.
3
http://www.w3.org
4
http://www.w3.org/RDF/Validator/
308
Negru S. and Lohmann S..
A Visual Notation for the Integrated Representation of OWL Ontologies.
DOI: 10.5220/0004373003080315
In Proceedings of the 9th International Conference on Web Information Systems and Technologies (WEBIST-2013), pages 308-315
ISBN: 978-989-8565-54-9
Copyright
c
2013 SCITEPRESS (Science and Technology Publications, Lda.)

In order to fill this gap, this paper presents a vi-
sual notation for OWL ontologies that represents both
classes and individuals in a comprehensive yet com-
pact manner. A central goal is to provide both expert
and non-expert users with an easy-to-understand no-
tation optimized for OWL ontologies. The key idea
of the approach is to offer an integrated view on on-
tologies, where classes are represented as differently
sized circles that are shown along with the individuals
they contain.
In the following, we first summarize related work
in Section 2. In Section 3, we present the developed
visual notation for OWL ontologies. In Section 4, we
illustrate the applicability of the notation by the exam-
ple of the Friend of a Friend (FOAF) ontology. The
paper ends with a conclusion and an outlook on future
work in Section 5.
2 RELATED WORK
Several approaches for the visual representation of
ontologies and linked data have been presented in the
last years (Guo and Chan, 2011; Dadzie and Rowe,
2011; Katifori et al., 2007; Geroimenko and Chen,
2006). Most of them are based on a two-dimensional
plane, though some propose to use 3D representa-
tions. Little surprising, most users “seem to dislike
chaotic and too cluttered overviews” but “tend to pre-
fer visualizations that offer the possibility of an or-
derly and clear browsing of the presented informa-
tion” (Katifori et al., 2007). Finding a good balance
between comprehensiveness and ease-of-use is one of
the key challenges. Therefore, many works show ei-
ther only a part of the ontology or end up with very
complex representations.
A number of visualization approaches have been
implemented as plugins for ontology editors like
Prot´eg´e
5
. Some of them (e.g. OWLViz
6
) simply visu-
alize the class hierarchies of ontologies, while others
(e.g. OntoGraf
7
), allow for more comprehensivevisu-
alizations that include a representation of individuals
and different property relations. Yet, no clear distinc-
tion between property types or between classes and
individuals is made in the graphical representation of
OntoGraf. The notation rather relies on colors and
abstract symbols to indicate different node and link
types.
A more complete OWL visualization is provided
by GrOWL (Krivovet al., 2007), a graphical editor for
5
http://protege.stanford.edu
6
http://protegewiki.stanford.edu/wiki/OWLViz
7
http://protegewiki.stanford.edu/wiki/OntoGraf
OWL ontologies. It has been particularly designed for
the sublanguage OWL DL and the semantics of De-
scription Logic (DL), for instance, by offering sepa-
rate visualizations for the TBox, ABox, and RBox of
an ontology (Rudolph, 2011). However, the graphical
representation quickly becomes complex and large in
size, as every individual is defined in a separate node.
Work has also been done in the direction of
representing ontologies as UML class diagrams
8
,
mostly by defining mappings between elements from
OWL and UML (Cranefield, 2001). The Object
Management Group (OMG) formally specified such
mappings in the Ontology Definition Metamodel
(ODM)
9
. One implementation in this context is OWL-
GrEd (Barzdins et al., 2010), a graphical OWL ed-
itor that uses UML elements for the representation
of ontologies. A disadvantage of these approaches is
again their limited visual scalability, especially when
it comes to the representation of a large number of
individuals.
Other approaches focus on more specific visual-
ization tasks. For instance, the RelFinder (Heim et al.,
2010) visualizes relationships between individuals in
ontologies and makes these relationships interactively
explorable. It nicely depicts a limited set of instance
data and helps to discover commonalities, but it does
not provide a global picture of the ontology.
OntoTrix (Bach et al., 2011) presents a hybrid net-
work visualization technique that uses both node-link
diagrams and adjacency matrices to represent parts
of the ontology. Though an interesting combination
of visualization techniques, it relies on the users’ ca-
pabilities to correctly interpret the matrix representa-
tions and the used color-coding, which can be prob-
lematic at least for average users.
Finally, there are also visualization approaches
that represent the classes and individuals in ontolo-
gies as differently sized circles. One such work is
CropCircles (Wang and Parsia, 2006), which visu-
alizes the OWL class hierarchy using nested circles.
The size of the circles is proportional to the position
of the classes in the hierarchy. OOBIAN Insight
10
also makes use of nested circles to visualize ontology-
based data. Like in GrOWL, the visualization quickly
becomes complex and large in size, making it hard
to read. Another example of visualizing ontologies
with nested circles is the DOPE Browser presented in
(Stuckenschmidt et al., 2004), where individuals are
grouped into circle-shaped class representations and
linked together to form a cluster map.
The review of related work showed that most ex-
8
http://www.uml.org
9
http://www.omg.org/spec/ODM/
10
http://dbpedia.oobian.com
AVisualNotationfortheIntegratedRepresentationofOWLOntologies
309

isting approaches focus on the terminological part of
ontologies (i.e. the classes and their relationships),
while little emphasis is placed on the individuals be-
longing to the classes (i.e. the actual data). Further-
more, many of the proposed visualizations do not pro-
vide an explicit description of the visual notation, i.e.
a specification that clearly defines the semantics of the
graphical elements.
In order to overcome these limitations, we devel-
oped a visual representation that allows for an inte-
grated view on the TBox and ABox of ontologies.
Furthermore, all mappings between the graphical rep-
resentations of our notation and OWL elements are
clearly specified.
3 VISUAL NOTATION FOR
ONTOLOGIES
For a better understanding of our visual notation, we
need to relate to ontologies both in terms of Descrip-
tion Logic (DL) (Baader et al., 2003; Rudolph, 2011)
and the Web Ontology Language (OWL): In OWL,
there are classes, properties, and individuals; simi-
larly, in DL we have concepts (classes), roles (prop-
erties), and individuals. In order to clearly separate
concepts from individuals, we adopt the classical DL
distinction of TBox and ABox. In contrast to GrOWL
(Krivov et al., 2007), we do not have a separate RBox
view but included it in the TBox. Together, TBox
and ABox form the knowledge base that can be de-
scribed by one or more OWL ontologies. We can thus
distinguish between three layers that may be visual-
ized: The first two layers follow the TBox and ABox
distinction, while their combination – the integrated
layer – represents the complete ontology:
1. Conceptual Layer – Represents the classes,
properties, and their relationships;
2. Instance Layer – Represents the individuals and
their relationships;
3. Integrated Layer – Represents the classes popu-
lated with individuals.
3.1 Representation of OWL Elements
We developed graphical representations for a large
part of the elements defined by OWL. For some OWL
elements, we do not provide a graphical representa-
tion, as we either do not think they can be reasonably
visualized or consider a text-based presentation of the
corresponding information more appropriate. Fur-
thermore, we distinguish between primary elements
Class Label
3 instances
+ 2 inferred
instances
Figure 1: Individuals are visualized as sections of a circle.
that should be visualized as they are key to the un-
derstanding of the ontology, and additional elements
that should only be included in the visualization if
needed. In Table 1, we present the primary OWL el-
ements along with their graphical representations and
short descriptions. The graphical representations of
some additional OWL elements that may also be vi-
sualized are listed in Table 2. Note that some of the
elements are from the RDF Schema (RDFS) vocabu-
lary
11
– they are included in the notation, as they are
reused in OWL.
Elements from the ontology header, such
as owl:imports, owl:BackwardCompatibleWith,
owl:incompatibleWith, owl:priorVersion, and
owl:versionInfo, are best represented as text
in an infobox that complements the visual-
ization (as in the later described example of
Figure 2). Elements such as owl:onProperty,
owl:Ontology, owl:AllDifferent, owl:differentFrom,
owl:hasValue, owl:distinctMembers, owl:Restriction,
owl:AnnotationProperty, owl:OntologyProperty,
owl:allValuesFrom, owl:someValuesFrom, and
owl:DataRange (rdfs:datatype in OWL 2) are also
not visually represented, since they serve as con-
tainers for other elements or define constraints for
populating the ontology. They are important for
editing the ontology or for checking its validity but
they can be omitted in the visualization.
Individuals are displayed inside the classes they
are instances of. Each individual makes up one sec-
tion of the circle that represents the class (see Fig-
ure 1). Apart from individuals defined by rdf:type, the
class may include individuals that are defined by an
enumeration or alike (e.g. owl:oneOf). Superclasses
contain the individuals of their subclasses, but these
individuals are shown in gray to avoid confusion and
misinterpretation.
The connectivity of the classes with regard to the
domain described by the ontology is indicated by the
size of the circles. Thissize is determined by the num-
ber of incoming and outgoing property relations (the
more relations, the larger the circle). The owl:Thing
class has a fixed size for the reason that it does usu-
ally not carry important domain information, as we
will discuss in the next section.
11
http://www.w3.org/TR/rdf-schema/
WEBIST2013-9thInternationalConferenceonWebInformationSystemsandTechnologies
310
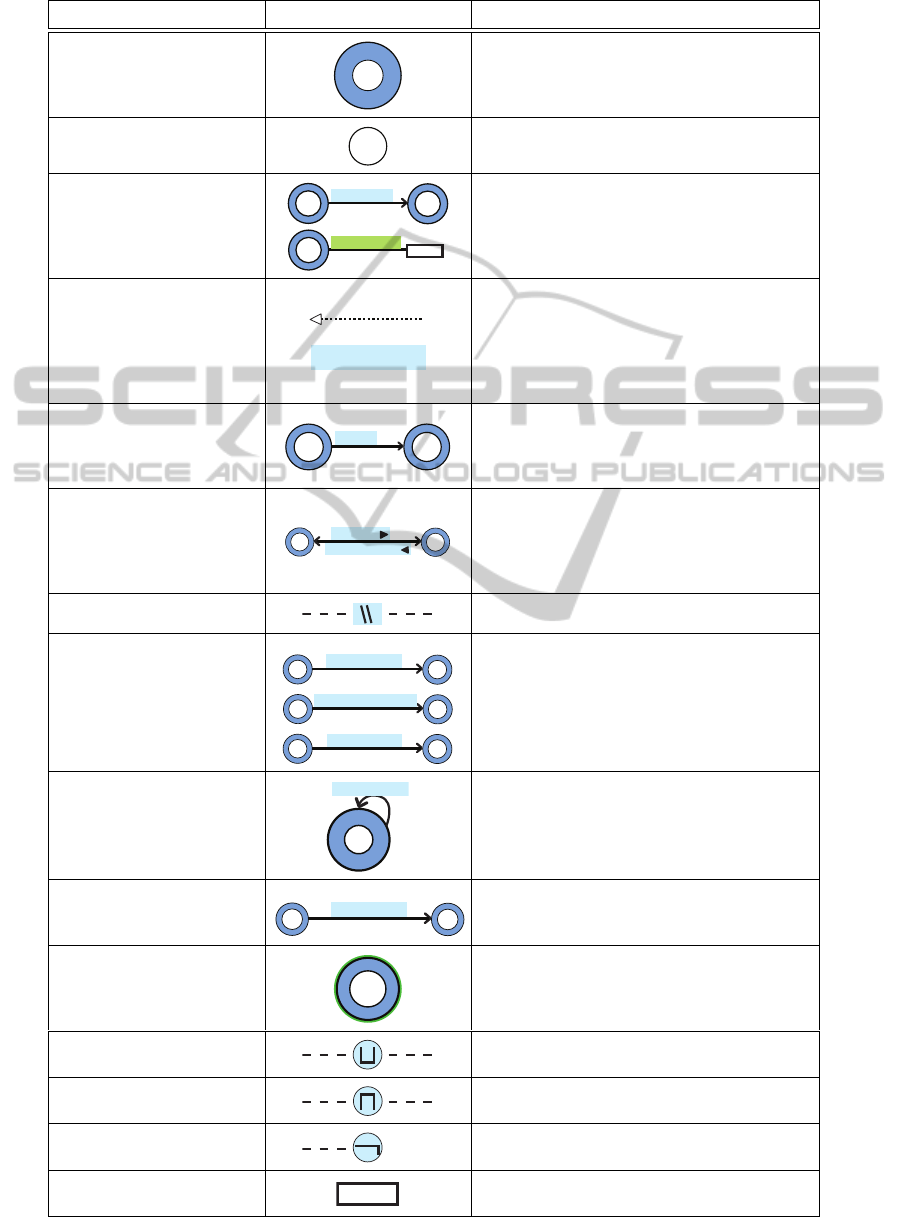
Table 1: Graphical representations of primary OWL elements.
Element Graphical representation Description
owl:Class
Class Label
Circle with round label (rdfs:label) in the mid-
dle. Classes from imported ontologies are dis-
played entirely in gray (incl. the label back-
ground).
owl:Thing
Thing
Simple circle with label Thing.
owl:ObjectProperty,
owl:DatatypeProperty
Domain
Range
Object Property
Range
Domain
Datatype Property
Line or arc annotated with the label of the prop-
erty. The label’s background color indicates the
type of the property (object or datatype prop-
erty).
rdfs:subClassOf,
rdfs:subPropertyOf
Property [Subproperty]
or
Dotted line/arc with an unfilled arrow head at
the end pointing to the superclass or superprop-
erty. Subproperties having the same domain and
range as their superproperties can alternatively
be listed in square brackets within the label of
the superproperty.
rdfs:domain,
rdfs:range
Domain
Range
Property
Arrow starting at the domain and pointing to the
range. Datatype properties do not need an ar-
row, as they are always directed to the literal or
data value.
owl:inverseOf
Property
Inverse Property
Domain
Range
Line/arc with arrow heads at both ends and an-
notated with the label of the property and its in-
verse counterpart. Filled arrow heads at the end
of the labels indicate the direction of the prop-
erties (i.e. their range).
owl:disjointWith
Dashed line/arc with \\ symbol as label.
owl:FunctionalProperty,
owl:InverseFunctionalProperty,
owl:TransitiveProperty
Domain
Range
Functional Property
F
Domain
Range
Inverse Functional Property
InvF
Domain
Range
Transitive Property
T
Object property representation with an F for
functional properties, InvF for inverse func-
tional properties, and T for transitive properties
on top of the property label.
owl:SymmetricProperty
Class Label
Symmetric Property
Object property representation with identical
domain and range, i.e. start and end point of
the arrow is the same class.
owl:cardinality,
owl:minCardinality,
owl:maxCardinality
Domain
Range
Cardinality Property
min:1
max:1
Exact, minimal, and/or maximal cardinality
constraints are written above the property label.
owl:equivalentClass
Class Label,
Equivalent Class
Label
Colored ring around a class. The labels of
all equivalent classes are shown as comma-
separated list in the label, each colored in the
same font as the corresponding ring.
owl:unionOf Dashed line/arc with ⊔ symbol as label.
owl:intersectionOf Dashed line/arc with ⊓ symbol as label.
owl:ComplementOf Dashed line/arc with ¬ symbol as label.
Literals, data types and
data values
Literal
Rectangle containing the literal or data value.
AVisualNotationfortheIntegratedRepresentationofOWLOntologies
311
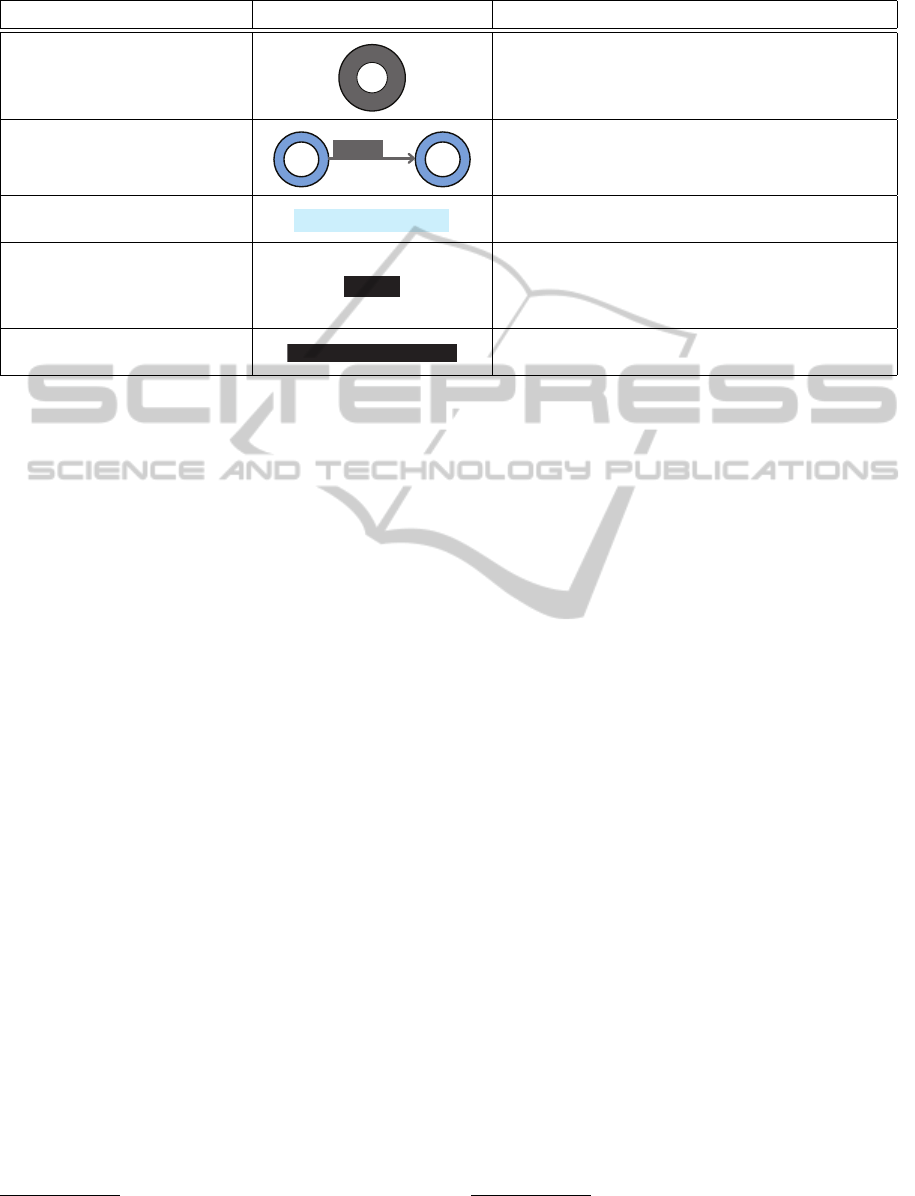
Table 2: Graphical representations of additional OWL elements.
Element Graphical representation Description
owl:DeprecatedClass
Class Label
Class representation colored in dark gray (with white
label background).
owl:DeprecatedProperty
Domain
Range
Property
Object/datatype property representation colored in
dark gray.
owl:equivalentProperty
{Property1, Property2}
Labels of equivalent properties are listed in curly
brackets.
rdfs:comment,
rdfs:seeAlso,
rdfs:isDefinedBy
rdfs:label of individuals
Label
Inverted literal representation (i.e. black rectangle
with white font).
owl:sameAs
individual1 sameAs individual2
Inverted literal representation listing the labels of the
individuals connected with the keyword ‘sameAs’.
3.2 Specific Issues
While we developed the visual notation, we came
across some issues that we would like to address
in the following. One of these issues concerns the
owl:Thing and owl:Nothing elements. According to
the OWL specification
12
, all classes are subclasses
of owl:Thing, while owl:Nothing is the subclass of
all classes. Many visualization approaches do not
represent these two elements (Katifori et al., 2007;
Guo and Chan, 2011). This is understandable if we
consider that owl:Nothing is an empty class and that
owl:Thing is usually not relevant for a particular do-
main but serves mainly as root class in the ontology.
However, at some point we might want to include the
owl:Thing class in the visualization to facilitate un-
derstanding of the ontology (e.g. to indicate that a
property does not have a specific domain or range).
In these cases, we recommend to use multiple repre-
sentations of owl:Thing in order to not give it an im-
portance in the visualization that it does not deserve.
For the basic set operations owl:intersectionOf,
owl:unionOf, and owl:ComplementOf, we reuse the
corresponding DL symbols (⊓, ⊔, and ¬), since they
are well-known to expert users. Because all three
OWL elements define new(anonymous) classes to de-
scribe the union, intersection, or complement of other
classes, we represented them as circles. If the domain
or range of a property links to one of these elements,
the line or arc of that property is directly connected to
the corresponding circle representation.
Another issue is the question of what happens if
certain classes, properties, or individuals do not have
an rdfs:label. In these cases, we recommend to dis-
12
http://www.w3.org/TR/owl-ref/
play a part of the URI as label (e.g. the characters
that follow the last slash or number sign). Related
to that, the URIs of classes, properties, or individuals
can generally be represented with the graphical repre-
sentation used for rdfs:comment (see Table 2).
We also took into account that color-blindness
does not have a strong effect on the readability of the
visual representation. In particular, key information is
never purely encoded by color. For instance, though
different colors are used for object and datatype prop-
erties, this information is also clear without color-
coding, as object properties always link pone individ-
ual with another, while datatype properties link indi-
viduals with data values.
Finally, it should be noted that the notation does
not make a distinction between the three OWL sub-
languages OWL Lite, OWL DL, and OWL Full, as
this is not relevant for the visual representation. It is
also compliant with OWL 2
13
and all its profiles.
3.3 Advantages
An advantage that is immediately visible from Table 1
is the small number of graphical elements needed to
represent a relatively large number of OWL elements.
Basically, we used only four types of symbols in dif-
ferent variations for the notation:
• classes = circles (size indicates the connectivity of
a class);
• individuals = sections in the circles;
• properties = lines/arcs (with different arrow
heads, line types, etc.);
13
http://www.w3.org/TR/owl2-overview/
WEBIST2013-9thInternationalConferenceonWebInformationSystemsandTechnologies
312

• literals, data types and values = rectangles.
Maybe the biggest advantage of the notation is the
integrated view that allowsto represent individuals in-
side the classes they are instances of.
4 USE CASE
We applied our visual notation to the well-known
Friend of a Friend (FOAF)
14
ontology to give an il-
lustration on how it can be used. Although FOAF
consists of a relatively small number of classes and
properties, it nicely showcases most of the graphical
representations of our notation.
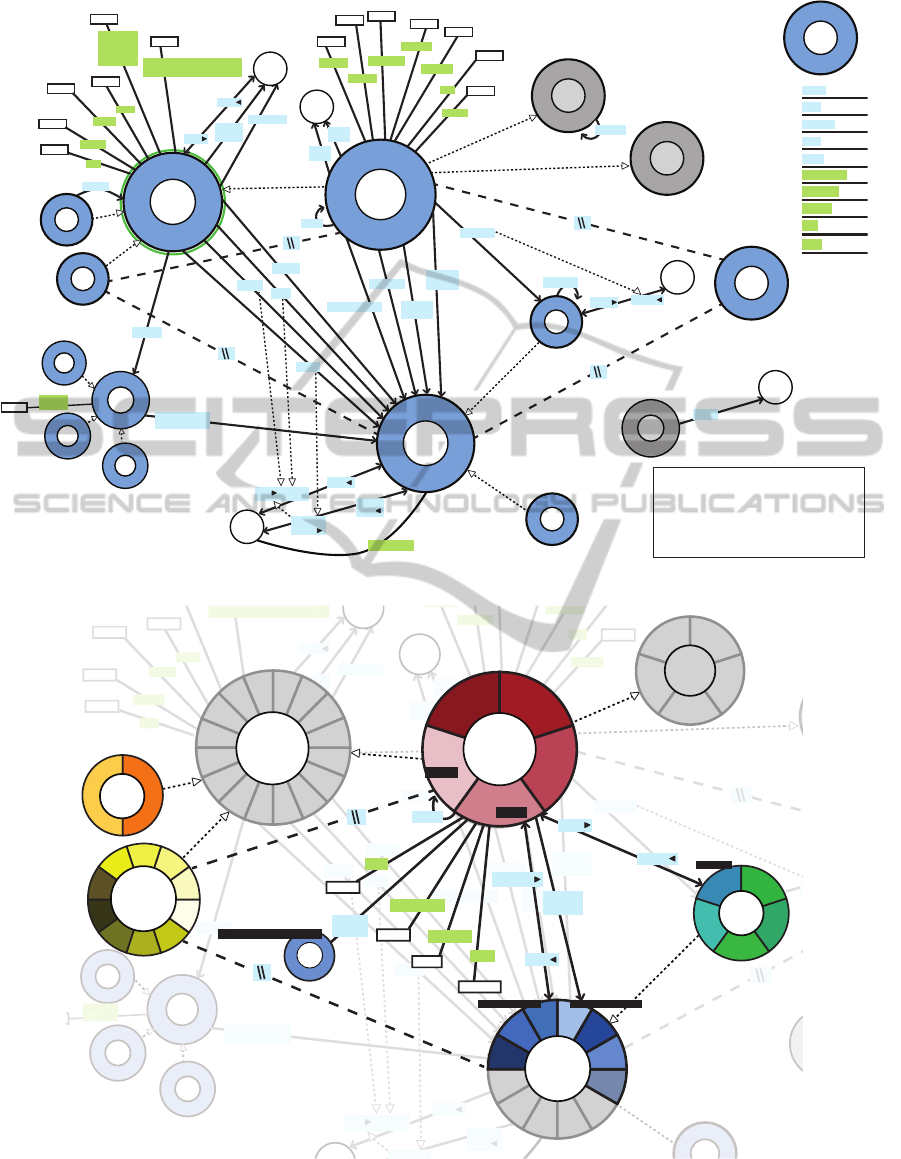
4.1 Conceptual Layer
Figure 2 depicts the visual representation of the con-
ceptual layer of the FOAF ontology, i.e. it shows the
classes and subclasses along with their property rela-
tions. The circles of the classes Person, Agent, and
Document have the largest size, since these classes
have most property relations. As mentioned in the
previous section, we do not consider owl:Thing to be
of large interest in ontology visualizations. However,
we represented it using the multiplication technique
mentioned above, since some FOAF properties either
explicitly define it as domain or range or do only de-
fine one of these two.
As the classes Spatial Thing
15
, Person
16
(from
the PIM ontology) and Concept
17
are imported from
other ontologies, they are displayed in gray (see de-
scription of the class notation in Table 1). The colored
ring around the circle representing the class Agent re-
sults from the fact that it is equivalent to the class
Agent
18
from the Dublin Core vocabulary. Its name
is added to the label of the circle and displayed in
the same color as the ring (in this case green). The
subproperty relations directing to page are explicitly
shown because the domain and range axioms of the
subproperties weblog, tipjar, openid, and is primary
topic of differ from those of page. If this was not
the case they could have been represented in the short
form that we also used for the subproperty relation of
homepage in Figure 2 and that is mentioned in Ta-
ble 1.
The class Label Property and the properties
phone, focus, funded by, logo, theme, DNA checksum,
14
http://xmlns.com/foaf/spec/ (version 0.98)
15
http://www.w3.org/2003/01/geo/wgs84 pos
16
http://www.w3.org/2000/10/swap/pim/contact
17
http://www.w3.org/2009/08/skos-reference/skos
18
http://purl.org/dc/terms/Agent
Given name, nickname, title, and name have no re-
lationships with the rest of the classes or properties.
Hence, they are listed separately in the top right of
Figure 2. Information from the header of the FOAF
ontology is shown in the infobox at the bottom right.
4.2 Integrated Layer
We also created a visual representation of the inte-
grated layer of the FOAF ontology using our nota-
tion and some sample data. This sample data con-
sists of 28 individuals that are distributed on the
FOAF classes as follows: 5 × Person, 7 × Docu-
ment, 5 × Image, 2 × Group, and 9 × Organiza-
tion. Though all these individuals are represented
as sections in the circles, the properties of only one
selected individual are shown (namely, “Jane Doe”).
The FOAF profile of that individual in RDF/XML
syntax is as follows:
<rdf:RDF
xmlns:rdf="http://www.w3.org/1999/02/
22-rdf-syntax-ns#"
xmlns:foaf="http://xmlns.com/foaf/0.1/">
<foaf:Person rdf:ID="janedoe">
<foaf:name>
jane doe
</foaf:name>
<foaf:title>
Mrs.
</foaf:title>
<foaf:givenname>
jane
</foaf:givenname>
<foaf:family_name>
doe
</foaf:family_name>
<foaf:nick>
jane
</foaf:nick>
<foaf:mbox rdf:resource=
"mailto:janedoe@example.com"/>
<foaf:homepage rdf:resource=
"www.example.com/janedoe"/>
<foaf:depiction rdf:resource
="janedoe.jpg"/>
<foaf:workplaceHomepage rdf:resource
="www.work.com/janedoe"/>
<foaf:knows>
<foaf:Person>
<foaf:name>
john doe
</foaf:name>
<foaf:mbox rdf:resource
="mailto:johndoe@xample.com"/>
</foaf:Person>
</foaf:knows>
</foaf:Person>
</rdf:RDF>
AVisualNotationfortheIntegratedRepresentationofOWLOntologies
313
Agent, Agent
Document
Label
Property
Online
Account
Project
Spatial
Thing
Person
Group
Organiza-
tion
Imagine
Personal
Prole
Document
Online Chat
Account
Online
E-commerce
Account
Online
Gaming
Account
Person
depiction
image
focus
funded by
logo
phone
publications
schoolHomepage
theme
thumbnail
work info
homepage
Thing
Thing
Thing
Thing
Literal
Literal
Literal
Literal
Literal
Literal
Literal
Literal
Literal
family_name
Literal
Title: Friend of a Friend (FOAF) vocabulary
About: http://xmlns.com/foaf/0.1/
Description: The Friend of a Friend (FOAF) RDF
vocabulary, described using W3C RDF Schema and
the Web Ontology Language.
F
F
F
workplage
homepage
account
service homepage
account
interest
member
past
project
current
project
personal
mailbox
topic_interest
is primary
topic of
primary
topic
page [hompage]
topic
depicts
made
maker
knows
based near
myerBriggs
rstName
plan
surname
age
birthday
gender
status
Concept
Thing
focus
openid
Given Name
nickname
title
DNA checksum
geekcode
Literal
Literal
lastName
sha1sum (hex)
account
name
name
InvF
InvF
InvF
InvF
F
InvF
weblog
tipjar
InvF
Literal
sha1sum of a
personal
mailbox URI
name
Literal
AIM chat ID, ICQ chat ID, MSN chat ID,
Yahoo chat ID, jabber ID, skypeID
Figure 2: Visual representation of the conceptual layer of the FOAF Ontology (version 0.98).
Online
Account
Person
Personal
Prole
Document
Online Chat
Account
Online
E-commerce
Account
Online
Gaming
Account
depiction
image
publications
schoolHomepage
work info
homepage
Thing
Thing
Literal
Literal
Literal
Literal
Literal
F
F
F
workplage
homepage
account
service homepage
account
interest
past
project
current
project
personal
mailbox
topic_interest
is primary
primary
topic
page
[hompage]
topic
depicts
made
maker
myerBriggs
plan
surname
age
birthday
gender
status
openid
geekcode
account
name
InvF
F
weblog
tipjar
InvF
Yahoo chat ID, jabber ID, skypeID
Jane Doe
Jane
Doe
mailto:janedoe@example.com
Thing
1 instance
Mrs.
title
workplage
homepage
Spatial
Thing
Person
5 instances
knows
janedoe
johndoe
Group
2 instances
Organization
9 instances
Agent
16 inferred
instances
Image
5 instances
janedoe.jpg
Document
7 instances
+ 5 inferred
instances
www.example.com/janedoe
www.work.com/janedoe
homepage
InvF
topic
depicts
depiction
personal
mailbox
InvF
name
givenname
family_name
5 inferred
instances
Figure 3: Visual representation of the integrated layer of the FOAF Ontology (with sample data).
Figure 3 shows the integrated view for that indi-
vidual. We can observe how ‘Jane Doe’ is linked in
the ontology by following her relations with other in-
dividuals and with associated data. The general topol-
WEBIST2013-9thInternationalConferenceonWebInformationSystemsandTechnologies
314

ogy of the graph visualization and the positions of the
classes are roughly the same as in the conceptuallayer
presented in Figure 2. Also, the subclass and dis-
joint relations between the classes are still displayed.
However, classes without individuals have been faded
out, as the integrated layer focuses on the classes that
contain individuals. The number of individuals each
class contains is also shown in the integrated layer.
The notation distinguishes between individuals that
are inferred from subclasses and individuals that are
instances of the class itself. Inferred individuals are
presented in a light gray while the other individuals
have random colors.
5 CONCLUSIONS
In this paper, we presented a visual notation for OWL
ontologies. The notation provides a comprehensive
yet compact representation of the ontology that re-
quires only a relatively small number of graphical el-
ements. In contrast to most existing approaches, it
explicitly defines a graphical representation for each
OWL element that can be reasonable visualized. Fur-
thermore, it offers an integrated view on ontologies
that shows classes (circles) along with their individ-
uals (sections in the circles) and property relations
(connecting lines and arrows). We illustrated the ap-
plicability of the visual notation on the example of the
FOAF ontology.
The specification of the notation is published un-
der a persistent URL on the web
19
so that it can easily
be found and used by others to visualize OWL on-
tologies. Furthermore, we plan to develop a tool that
implements the notation and adds interactive features
to it, allowing for a more detailed exploration of the
classes, individuals, and relationships in ontologies.
ACKNOWLEDGEMENTS
This work was partially supported by the European
Social Fund in Romania, under the responsibility of
the Managing Authority for the Sectorial Operational
Program for Human Resources Development 2007-
2013 [grant POSDRU/107/1.5/S/78342].
REFERENCES
Baader, F., Calvanese, D., McGuinness, D. L., Nardi, D.,
and Patel-Schneider, P. F., editors (2003). The De-
19
http://purl.org/vowl/
scription Logic Handbook: Theory, Implementation,
and Applications. Cambridge University Press.
Bach, B., Pietriga, E., Liccardi, I., and Legostaev, G.
(2011). OntoTrix: a hybrid visualization for populated
ontologies. In Proceedings of the 20th International
Conference on World Wide Web (Companion Volume),
WWW ’11, pages 177–180. ACM.
Barzdins, J., Barzdins, G., Cerans, K., Liepins, R., and
Sprogis, A. (2010). OWLGrEd: a uml style graph-
ical notation and editor for OWL 2. In Proceedings
of the 7th International Workshop on OWL: Experi-
ences and Directions, OWLED ’10. CEUR-WS.org,
vol. 614.
Bizer, C., Heath, T., and Berners-Lee, T. (2009). Linked
data - the story so far. International Journal on Se-
mantic Web and Information Systems, 5(3):1–22.
Cranefield, S. (2001). UML and the semantic web. In Pro-
ceedings of 1st The first Semantic Web Working Sym-
posium, SWWS ’01, pages 113–130. IOS press.
Dadzie, A.-S. and Rowe, M. (2011). Approaches to visual-
izing linked data: A survey. Semantic Web, 2(2):89–
124.
Geroimenko, V. and Chen, C. (2006). Visualizing the Se-
mantic Web: Xml-Based Internet and Information Vi-
sualization. Second Edition. Springer.
Guo, S. S. and Chan, C. W. (2011). A comparison and anal-
ysis of some ontology visualization tools. In Proceed-
ings of the 23rd International Conference on Software
Engineering & Knowledge Engineering, SEKE ’11,
pages 357–362. Knowledge Systems Institute Gradu-
ate School.
Heim, P., Lohmann, S., and Stegemann, T. (2010). Inter-
active relationship discovery via the semantic web. In
Proceedings of the 7th Extended Semantic Web Con-
ference, ESWC ’10, pages 303–317. Springer.
Hendler, J. (2001). Agents and the semantic web. IEEE
Intelligent Systems, 16(2):30–37.
Katifori, A., Halatsis, C., Lepouras, G., Vassilakis, C.,
and Giannopoulou, E. (2007). Ontology visualization
methods a survey. ACM Computer Surveys, 39(4).
Krivov, S., Williams, R., and Villa, F. (2007). GrOWL: A
tool for visualization and editing of owl ontologies.
Web Semantic, 5(2):54–57.
Rudolph, S. (2011). Foundations of description logics. In
Reasoning Web. Semantic Technologies for the Web of
Data, pages 76–136. Springer.
Stuckenschmidt, H., van Harmelen, F., de Waard, A., Scerri,
T., Bhogal, R., van Buel, J., Crowlesmith, I., Fluit,
C., Kampman, A., Broekstra, J., and van Mulligen, E.
(2004). Exploring large document repositories with
RDF technology: The DOPE project. IEEE Intelligent
Systems, 19(3):34–40.
Wang, T. D. and Parsia, B. (2006). Cropcircles: topology
sensitive visualization of owl class hierarchies. In Pro-
ceedings of the 5th international conference on The
Semantic Web, ISWC’06, pages 695–708. Springer.
AVisualNotationfortheIntegratedRepresentationofOWLOntologies
315
