
Monitoring of SCA-based Applications in the Cloud
Mohamed Mohamed, Djamel Bela¨ıd and Samir Tata
Institut MINES-TELECOM, TELECOM SudParis, UMR CNRS Samovar, Evry, France
Keywords:
Cloud Computing, Monitoring, Component Model, Scalability, Service Containers, SCA.
Abstract:
Cloud computing is a recent paradigm in information technology enabling an economic model for virtual
resources provisioning. Monitoring remains an important task to efficiently manage the Cloud, but it is still
a challenge to find a monitoring solution that reconciles the scalability, the memory consumption, and the
efficiency. In this paper, we propose an extension for Service Component Architecture to allow the description
of monitoring needs, and a framework that adds monitoring facilities to components and encapsulates them
in a scalable micro-container that could be deployed in the cloud. Unlike the existing initiatives in the state
of the art, our SCA-extension allows the architect to describe monitoring needs between components and our
framework allows the transformation from the extended SCA description to a standard SCA that could be
handled by any SCA runtime. This makes the task of developers and architects easier letting them focusing
on the business of their components instead of the non functional property of monitoring. Moreover, our
framework uses a scalable micro-container for components’ deployment in the Cloud to be in line with the
scalability of this environment. The evaluation that we performed proves the efficiency and the flexibility of
our approach of monitoring applications in the Cloud.
1 INTRODUCTION
Over the last years, there has been an enormous shift
in Information Technologies (IT) to Cloud Comput-
ing. Cloud Computing is a recent paradigm enabling
an economic model for virtual resources provision-
ing. It refers to a model for enabling ubiquitous, con-
venient, on demand network access to a shared pool
of configurable computing resources (e.g., networks,
servers, storage, applications and services) that can
be rapidly provisioned and released with minimal ef-
fort or service provider interaction (NIST, 2011). In
this paradigm, there are basically three layers of ser-
vices known as ”IaaS” for Infrastructure as a Service,
”PaaS” for Platform as a Service and ”SaaS” for Soft-
ware as a Service.
As it is, the Cloud is well adapted to host Service-
based applications that follow Service Oriented Ar-
chitecture (SOA). SOA is a collection of services
which communicate with each other. Such type of
applications can be described using Service Compo-
nent Architecture (SCA) as a composite description
that contains a detailed description for different com-
ponents of the application and links between them.
All the elements in a composite must be described as
one of the standard artefacts of the SCA meta-model.
A well described composite can be transmitted to a
SCA runtime (e.g. TUSCANY (Laws et al., 2011),
Newton(Dunne, 2008)) that instantiates the different
components and links them as described in the com-
posite, these aspects among others will be detailed in
section 2. In this paper we will focus in monitoring
Component-based applications in the Cloud which re-
mains a critical issue and should be done at the gran-
ularity of a component to keep its good QoS.
Monitoring process consists of informing the in-
terested part (user or application component) about
the changes of the monitored system properties or
notifying it on a regular way or whenever a change
has occurred. When applied on a Service Compo-
nent Architecture in a Cloud environment, monitor-
ing becomes a complicated problem that has to face
many challenges: first, the description of the need
to consume monitoring information must be explic-
itly described in different granularities independently
of the type of the components (i.e., Network, Com-
pute, Storage, Software, etc.). Moreover, the nature
of monitored components and the way their status
should be retrieved depends on the component being
monitored which renders this task complicated. Fi-
nally, any monitoring solution must respect the scala-
bility of the Cloud.
In this paper, we propose a framework that en-
ables monitoring SCA-based applications in cloud
47
Mohamed M., Belaïd D. and Tata S..
Monitoring of SCA-based Applications in the Cloud.
DOI: 10.5220/0004376500470057
In Proceedings of the 3rd International Conference on Cloud Computing and Services Science (CLOSER-2013), pages 47-57
ISBN: 978-989-8565-52-5
Copyright
c
2013 SCITEPRESS (Science and Technology Publications, Lda.)

environments and our contributions are: an exten-
sion for SCA meta-model to enable the description
of a component’s need to monitor properties of other
components (subsection 3.1), a list of transformations
that render a component monitorable even if it was
designed without monitoring facilities showing how
our frameworktransforms the extended-SCA descrip-
tion to a standard one (subsection 3.2), the integra-
tion of our monitoring solution with a scalable micro-
container to respect the scalability of the cloud (sub-
section 3.3), and the implementation details and the
primer experimentation that prove the efficiency of
our approach (section 4).
Many attempts to provide monitoring applications
in the Cloud exist in the state of the art detailed in sec-
tion 5, but as we will explain, almost all the proposed
solutions give tooling solutions to monitor Cloud ap-
plications behaviour. Furthermore, there is no ap-
proach that expects to monitor components that were
not designed with monitoring facilities. In addition,
almost all of the existing monitoring solutions either
do not take care of scalability issue, or do not include
an efficient solution to that problem. In our work, we
propose a granular description of monitoring require-
ments, we are independent of the components types,
we alleviate the developer task who can finally focus
just in the business of his components and leave the
non functional properties of monitoring to our frame-
work and finally we respect the scalability constraint
by the use of the technique of micro-containers.
2 BACKGROUND
In this section, we will present the background of our
work, in which we aim at adding the description of
monitoring facilities to Service Component Architec-
ture (SCA) (Open SOA Collaboration, 2008). We will
start by defining SCA and its basic elements, then, we
will define monitoring and its different models and
related aspects.
2.1 Service Component Architecture
OASIS describes SCA (Open SOA Collaboration,
2008) as a programming model for building applica-
tions and solutions based on a Service Oriented Ar-
chitecture (SOA). One basic artifact of SCA is the
component, which is the unit of construction for SCA.
” A component consists of a configured instance of a
piece of code providing business functions. It offers
its functions through service-oriented interfaces and
may require functions offered by other components
through service-oriented interfaces as well. SCA
components can be implemented in Java, C++, and
COBOL or as BPEL processes. Independent of what-
ever technology is used, every component relies on a
common set of abstractions including services, refer-
ences, properties and bindings ” (Open SOA Collabo-
ration, 2008). A service describes what a component
provides, i.e. its external interface. A reference spec-
ifies what a component needs from the other compo-
nents or applications of the outside world. Services
and references are matched and connected using wires
or bindings. A component also defines one or more
properties (Open SOA Collaboration, 2008).
As defined by Szyperski (Szyperski, 2002) ”A
software component is a unit of decomposition with
contractually specified interfaces and explicit context
dependencies only”. Thus, a component not only ex-
poses its services but it also specifies its dependen-
cies. Most of the existing component models (Becker
et al., 2004) (Bruneton et al., 2006) (OSGI, 1999)
(Open SOA Collaboration, 2008) allow specification
of their dependencies for business services external
to the component. However, they do not allow spec-
ification of their dependency for external properties.
The ability to specify dependency for external prop-
erties has two important implications. First, it re-
sults in specification at relatively fine granularity thus
helping the architects and designers in fine tuning the
component’s requirements. Second, this fine tuning
helps in elaborating the contract between two compo-
nents because the properties can be enriched with ad-
ditional attributes that constrain the nature of the con-
tract through appropriate policies. In a component-
based application, monitoring must be defined at the
granularity of a component to get a global view of the
application.
In the next subsection, we introduce monitoring and
its different aspects.
2.2 Monitoring
Monitoring consists of informing interested parts of
the status of a property or a service. In our work, we
consider two models of monitoring: monitoring by
polling or by subscription. Polling is the simpler way
of monitoring, as it allows the observer to request the
current state of a property whenever there is a need.
The interested component can generally interact with
a specific interface that provides a getter of the needed
property. Monitoring by subscription model is based
on a publish/subscribe system which is defined as a
set of nodes divided into publishers and subscribers.
Subscribers express their interests by subscribing for
specific notifications independently of the publish-
ers. Publishers produce notifications that are asyn-
CLOSER2013-3rdInternationalConferenceonCloudComputingandServicesScience
48
chronously sent to subscribers whose subscriptions
match these notifications (Baldoni et al., 2004). Sub-
scription allows an observing component to be noti-
fied about changes of monitored properties using one
of the following modes: 1) The subscription on in-
terval: it implies that the publisher (producer) broad-
casts the state of its properties periodically to the sub-
scribers (consumers); 2) The subscription on change:
it implies that the publisher has to notify the sub-
scribers whenever its properties changed. The mon-
itoring by subscription on change mode contains var-
ious types of monitoring: (i) Property Changed Mon-
itoring (PCM): the monitored component has to send
notifications to all subscribers whenever a monitored
property is changed, (ii) Method Call Monitoring
(MCM): the monitored componentsends notifications
wheneverone of the service’s methods is invoked, and
(iii) Execution Time Monitoring (ETM): the moni-
tored component notifies the subscribers about the ex-
ecution time whenever a service invocation occurred.
Our objective is to add monitoring aspects to SCA
description and to use this latter to monitor deployed
applications in the cloud.
3 OUR APPROACH
To overtake the explained problems, we propose an
extension to SCA meta-model to add monitoring ca-
pabilities to components.
3.1 Extended SCA Meta-model
Since the existing SCA meta-model does not support
the explicit description of Required Properties of a
component, we decided to extend this meta-model
by adding some artifacts allowing the description of
monitoring capabilities for component-based appli-
cations. These new artifacts allow a component to
express its need to monitor properties of other com-
ponents with a specific monitoring model (i.e. by
polling or by subscription) and with needed aspects
related to monitoring. The newly added artifacts are
the following:
• RequiredProperty: used to describe the need of a
component to monitor one or more properties of
another component;
• MonitoringByPolling: used to say that the re-
quired property is monitored using the monitoring
by polling model;
• MonitoringBySubscription: used to say that the
required property is monitored using the monitor-
ing by subscription model.
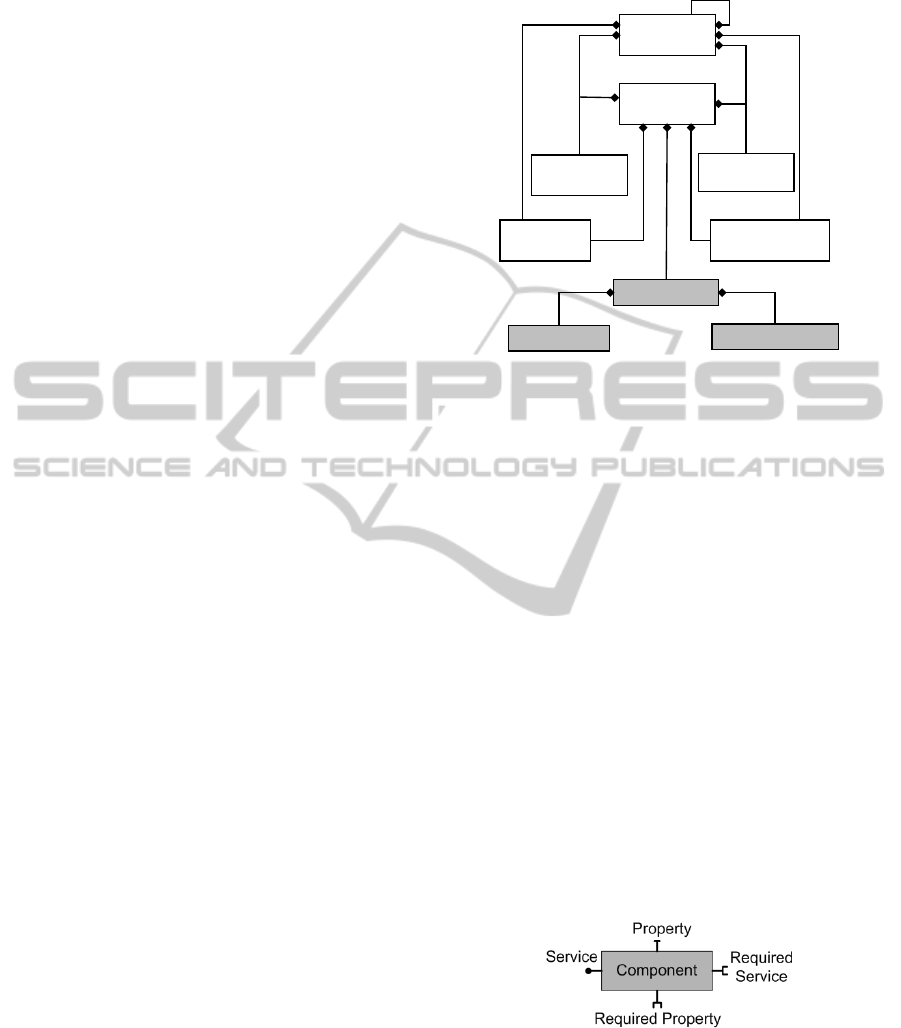
The extended SCA meta-model is shown in Figure 1.
Component
Composite
Property
Implementation
ReferenceService
RequiredProperty
MonitoringByPolling
MonitoringBySubscription
Figure 1: Extended SCA with monitoring artifacts.
Some attributes related to monitoring may be de-
clared for these artifacts like Start time of the sub-
scription, Duration of the subscription, Notification
mode (on change or on interval) and, Notification In-
terval if the Notification mode is on interval. The de-
scription of an application can be done with the help
of an Architecture Description Language (ADL). In-
stead of inventing a new ADL, we prefer to use one
of the existing description languages. In this regard,
SCA provides a rich ADL that details most of the as-
pects that we are looking for.
Figure 2 shows the main characteristics of the ex-
tended component. It provides a service through an
interface and may require a service from other com-
ponents through a reference. The component may ex-
pose properties through which it can be configured.
In addition, it can specify its dependency on certain
property. This required property, which appears at the
bottom of the component, will be satisfied if we can
link this component with another component that of-
fers the requested property, thus, solving the depen-
dency.
Figure 2: Component model describing required properties.
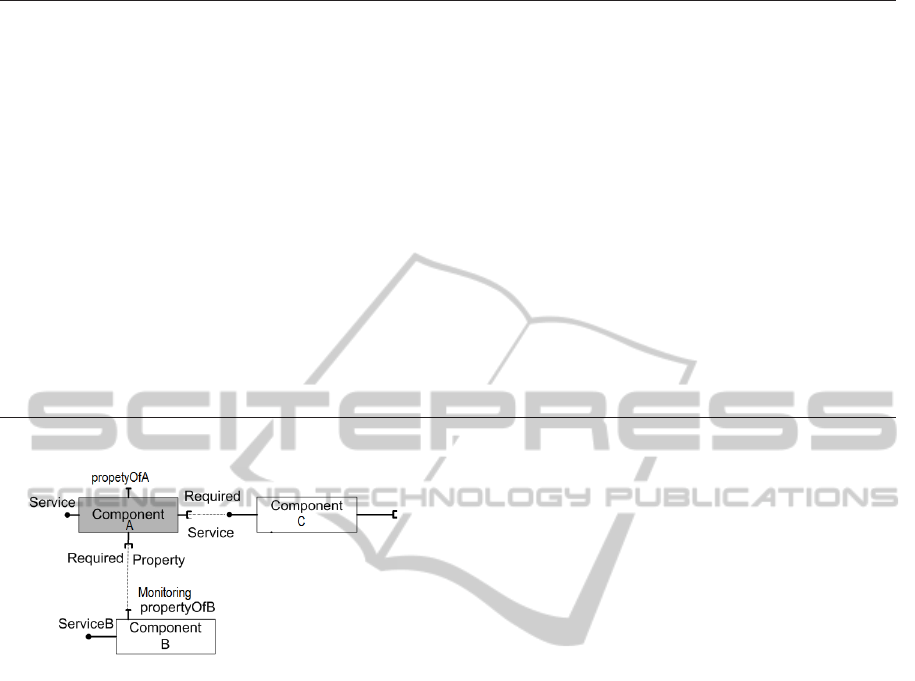
Components can be combined together in a com-
posite as an assembly of components to build com-
plex applications as shown in Figure 3. A component
(A) can specify its need to monitor properties of an-
other component (B) and use the service offered by
the component (C).
MonitoringofSCA-basedApplicationsintheCloud
49
1<composite name="LoadBalancerNetworkSensorComposite">
2 <service name="locateDestination" promote="LoadBalancer/locateDestination"/>
3 <component name="LoadBalancer" resource="Software.LoadBalancer">
4 <service name="locateDestination" >
5 <interface.java interface="example.locateDestinationInterface"/>
6 </service>
7 ........
8 <requiredProperty resource="NetworkSensor.networkConsumption" remotable="true" monitoring=
9 "BySubscription" notificationMode="ON_CHANGE">
10 <property name="networkConsumption"/></requiredProperty>
11 ....
12 </component>
13 <component name="NetworkSensor" resource="Software.NetworkSensor">
14 <property name="networkConsumption">
<service name="scanNetworkService" ><interface.java
15 interface="example.scanNetworkServiceInterface"/></service>
16 ........
17 </component>
18</composite>
Figure 4: Description of the LoadBalancer Application using our extended SCA ADL.
Figure 3: Component-based Application.
To explain our SCA extension, we take the ex-
ample of a classic Load Balancer application. A
Load Balancer is a componentthat deviates costumers
queries to dedicated servers. This component may re-
quire to monitor the network consumption which is a
property provided by a Network Sensor component.
Using the extended meta-model of SCA, we can
describe the described assembly application using our
extended SCA ADL as shown in Figure 4.
The extended SCA allows components to specify
their needs to monitor other components’ properties.
However, these components can be designed without
monitoring capabilities and cannot provide the status
of their properties. To avoid this problem, our frame-
work provides a list of transformations to apply to
components to render them monitorable.
In the next subsections, we introduce the main fea-
tures of the monitoring mechanisms and their trans-
formation processes.
3.1.1 GenericProxy Service
We have defined a general purpose interface Gener-
icProxy that provides four generic methods. These
methods are described in Figure 5. Each implemen-
tation of this interface is associated with a component
for which the first method getProperties() returns the
list of the properties of the component, the getProper-
tyValue() returns the value of a property, the setProp-
ertyValue() changes the value of a property and the
invoke() method invokes a given method on the asso-
ciated component and returns the result.
public interface GenericProxy {
Property[] getProperties();
Object getPropertyValue(String propertyName);
void setPropertyValue(String propertyName,
Object propertyValue);
Object invoke(String methodName,
Object[] params);}
Figure 5: Description of the GenericProxy interface.
The transformations that render a component
monitorableuse a GenericProxy Component provided
by our framework. It implements the GenericProxy
Interface and the (proxy) services of that component.
The byte-code of this implementation is generated dy-
namically by our framework.
3.2 Monitoring Transformations
Monitoring process consists in informing the inter-
ested component about the changes of required prop-
erties or notifying it on a regular way or for each
variation. In (Mohamed et al., 2012) we have pre-
sented an approach for adding monitoring capabili-
ties to components in the cloud in which we have
considered two types of monitoring: monitoring by
polling and monitoring by subscription. To complete
CLOSER2013-3rdInternationalConferenceonCloudComputingandServicesScience
50
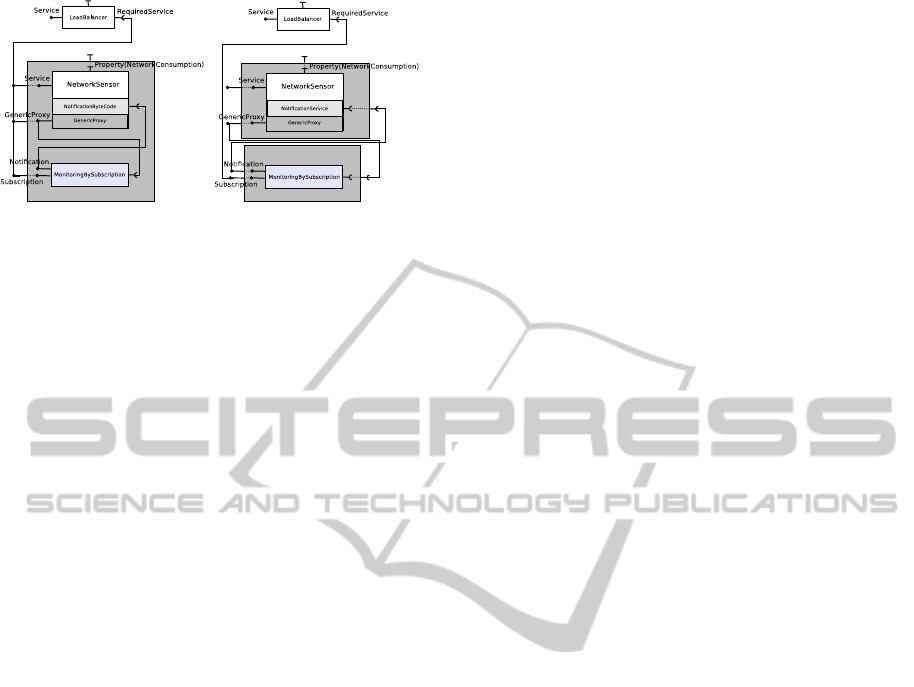
(a) Multi-channel monitoring (b) One channel monitoring
Figure 6: Transformation for monitoring by subscription
with notification mode on change.
the monitoring of any component from only the name
and type of a property, the interested componentoften
uses an appropriate interface that provides the method
getPropertyValue(propertyName) to request the cur-
rent state of a property.
If the component does not define its properties as
monitorable, we need to transform it to make them
to be monitorable, this can be done dynamically by
our framework by adding to the byte code of the com-
ponent an implementation of the predefined Gener-
icProxy interface defined above and the needed byte
code to send notifications (PCM, MCM or TEM).
The component can be then monitored by polling us-
ing the getPropertyValue() method provided by the
newly added implementation. Our framework adds
also a predefined component named MonitoringBy-
Subscription which plays the role of a channel. This
component accepts clients subscriptions, receives no-
tifications sent by the modified component and dis-
patches them to the interested subscribers. If the de-
ployment scenario is one channel monitoring (Fig-
ure 6(b)), all the newly generated composites will use
one shared composite containing the channel (Moni-
toringBySubscription). During the transformation for
a multi channel monitoring scenario (Figure 6(a), our
framework makes sure that in one composite we find
a unique shared channel for all its components.
When the notification mode is on change for
a required property of the monitored component
(Figure6), the MonitoringBySubscription component
offers a (callback) service of notification Notification
to the modified component (NetworkSensor) so that it
can be notified of the changes of a required property
and in turn inform all the subscribers (e.g. LoadBal-
ancer) of this change.
3.2.1 Transformation Example
Going back to the Load Balancer example that we
described in paragraph 3.1, we would like to trans-
form the Network Sensor, that it was designed with-
out monitoring facilities, to render it monitorable by
subscription on change.
After applying the needed transformations on the
Network sensor component to render it monitorable
by subscription on change, we get a new composite
offering the NetworkSensor services and new moni-
toring services. The Figure 6 describes the assembly
after the transformations.
The newly created composite is described in the
Figure 7. As shown in the figure, the transformation
mechanisms transform the extended ADL description
of the composite to a standard ADL description that
could be instantiated using any SCA runtime.
At this stage, we did not resolve yet the scalability
issue related to the Cloud. To tackle this issue we
use a framework based on scalable micro-containers
technique. The next section describes this framework
that we use to deploy components in the Cloud.
3.3 Deployment within a Scalable
Micro-container
In (Yangui et al., 2011), we introduced a new scal-
able and platform independent micro-container that
enables components’deployment and execution in the
Cloud. In this paper, we want to add monitoring ca-
pabilities to this micro-container.
For optimality and performance constraints, fea-
tures of the micro-container are as minimal as pos-
sible. After studying the features provided by the
container architectures of Axis2 (Perera et al., 2006),
Tomcat 6 (Foundation, 2011) and WSCRA (Dhe-
siaseelan and Ragunathan, 2004), we drew up a
list of basic features that should satisfy our micro-
container which directly reflects the different mod-
ules that make up its architecture. These basic mod-
ules ensure the minimal functionalities of our micro-
container which are: 1) enabling the communication
with clients, 2) query marshalling and demarshalling
and 3) hosting a component and its context.
We thought of designing a deployment framework
able to generate this micro-container. This framework
should contain not only processing modules to ensure
minimal micro-containers generation process (Parser,
Compiler, etc.) but also a set of generic elements for
the submission and treatment of non-functional fea-
tures to be included in the micro-container (HTTP,
RMI or another generic communication, service ad-
ministration tools, service billing, etc.).
To add monitoring capabilities to the micro-
container, we use the component model that we pre-
sented in paragraph 3.1 to represent components.
Since some components can be designed without
monitoring capabilities, we integrated the transforma-
MonitoringofSCA-basedApplicationsintheCloud
51

1<composite name="NetworkSensorComposite">
2 <service name="scanNetworkService" promote="NetworkSensor/scanNetworkService" />
3 <service name="GenericProxy"promote="NetworkSensor/GenericProxy" />
4 <service name="PCSubscriptionService" promote="MonitoringBySubscription/PCSubscriptionService" />
5 <reference name="notification" promote="NetworkSensor/notification"/>
6 <component name="NetworkSensor" resource="Software.NetworkSensor">
7 <service name="scanNetworkService">
8 <interface.java interface="example.scanNetworkServiceInterface"/>
9 </service>
10 <implementation class="example.impl.ModifiedNetworkSensorImpl"/>
11 <service name="GenericProxy">
12 <interface.java interface="GenericProxy"/>
13 </service>
14 <implementation class="impl.GenericProxy"/>
15 <reference name="notification" target="OneChannelComposite/NotificationService"/>
16 </component>
17</composite>
18<composite name="OneChannelComposite">
19 <service name="NotificationService" promote="MonitoringBySubscription/NotificationService"/>
20 <service name="PCSubscriptionService" promote="MonitoringBySubscription/PCSubscriptionService"/>
21 <reference name="GenericProxy" promote "MonitoringBySubscription/GenericProxy" />
22 <component name="MonitoringBySubscription">
23 <service name="PCSubscriptionService">
24 <interface.java interface="PCSubscriptionServiceInterface" callback="NotificationServiceInterface"/>
25 </service>
26 <implementation class="impl.MonitoringBySubscription"/>
27 <service name="NotificationService">
28 <interface.java interface="NotificationServiceInterface"/>
29 </service>
30 <implementation class="impl.Notification"/>
31 <reference name="GenericProxy" target="NetworkSensorComposite/GenericProxy"/>
32 </component>orca
33</composite>
Figure 7: Description of the NetworkSensor after its transformation (one channel scenario) using SCA ADL.
tions presented in subsection 3.2 to render these com-
ponents monitorable. And in order to integrate these
transformations in our framework, we added the mon-
itoring module to the deployment framework. This
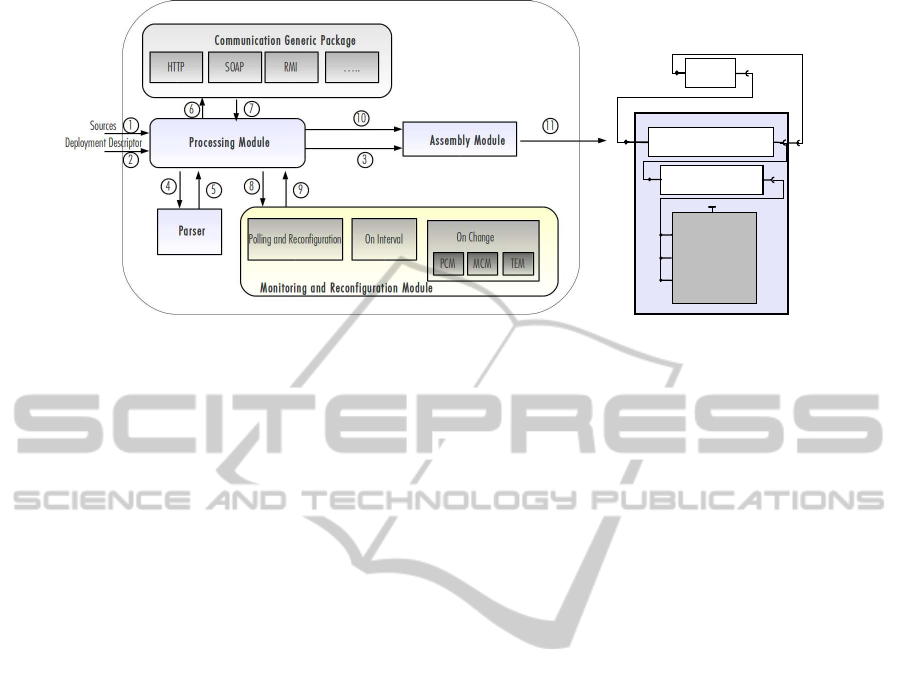
latter contains several modules shown in Figure 8 and
are as follows:
• Processing Module: orchestrates all the steps to
generate a micro-container;
• Parser: extracts data from composite description;
• Communication Generic Package: contains dif-
ferent packages implementing communication
protocols;
• Monitoring Module: supports different monitor-
ing models;
• Assembly Module: generates a micro-container
with monitoring capabilities.
To generate a micro-container with a composite
hosted in, one must provide the needed implemen-
tations and the composite descriptor which describes
how to assemble and deploy the micro-container into
a Cloud environment (Figure 8 Actions 1 and 2). The
processing module sends directly this descriptor to
the assembly module before analyzing the implemen-
tation and generating the corresponding description
(Figure 8 Action 3). Then, the generated compos-
ite description is transmitted to the Parser which no-
tifies the processing module by componets’ binding
types and monitoring aspects (Figure 8 Actions 4 and
5). The processing module instantiates the commu-
nication packages implementing the described bind-
ings available at the Communication Generic Package
(Figure 8 Actions 6 and 7) and uses the chosen moni-
toring module to apply the needed transformations on
the composite (Figure 8 Actions 8 and 9). Finally, it
sends the new resulting implementation to the assem-
bly module (Figure 8 action 10) whose responsibility
is to generate the new micro-container enhanced with
monitoring capabilities (Figure 8 Action 11).
As shown in Figure 8, the Monitoring module
supports monitoring by polling and monitoring by
subscription with its two modes: on interval and on
CLOSER2013-3rdInternationalConferenceonCloudComputingandServicesScience
52
(a) Deployment Framework.
Communication Module
Processing Module
Service
Property
Client
Composite
Service
Subscription
GenericProxyService
(b) Generated micro-container.
Figure 8: Extension of the Micro-container architecture with monitoring.
change. Monitoring on change mode includes Prop-
erty Changed Monitoring, Method Call Monitoring
and Time Execution Monitoring.
The generated micro-container (Figure 8(b)) is re-
sponsible of managing its communication with the
clients, holding its service and processing all incom-
ing or outgoing messages. Moreover, it is important
to notice that the client can interact with the micro-
container either to invoke the contained service, or to
request monitoring information. It can also send sub-
scription requests to receive notifications on change
or on interval.
To provethe efficiencyof our approach, in the next
section, we describe the implementation of our scal-
able micro-container enhanced with monitoring.
4 IMPLEMENTATION AND
EXPERIMENTATION
In order to test our work we implemented the previ-
ously described framework and we performed a list of
experimentations. In this section, we describe the im-
plementation aspects and chain up by presenting the
experiments results.
4.1 Implementation
The implementation process took place in 5 phases.
We have first developed a minimal Java deployment
framework, which allows developers to deploy a Java
component on a hard-coded micro-container before
deploying both of them in the Cloud. After that, we
developed the processing module for generating and
deploying an optimal and minimal micro-container.
All generation steps were then carried out exclusively
by this module before implementing gradually any
other module. The purpose of the distribution of
workload across multiple modules enhances the per-
formance of the platform and facilitates updates and
future changes. We have also developed Java clients
which send requests and subscriptions to the micro-
containers and display results and notifications re-
turned by the deployed component.
To alleviate as much as possible the generated
micro-container for performance reasons and scala-
bility constraints, we had to refine the generation pro-
cess. For this purpose, we defined a generic commu-
nication package in the deployment platform to iden-
tify and contain all the communication protocols that
can support a component (e.g. HTTP, RMI, etc.).
The generation process is based primarily on Bind-
ings components and monitoring aspects detected by
the parser and secondly on the activation of corre-
sponding communication modules from the generic
communication package and the needed transforma-
tion to add monitoring facilities. The interactions be-
tween these platform modules are orchestrated by the
processing module.
The last phase was implementing a prototype of
the monitoring framework as services that offer the
transformation mechanisms to the applications. The
byte-code of a GenericProxy component is generated
dynamically. For this required byte-code level ma-
nipulation we used the Java reflection API and the
open source software JAVA programming ASSISTant
(Javassist) library (Chiba, 2010). The Java reflection
API provides classes and interfaces for obtaining re-
flective information about classes and objects (Java 2
Platform API Specification, 2010). Reflection allows
programmatic access to information about the fields,
methods and constructors of loaded classes, and the
use of reflected fields, methods, and constructors to
MonitoringofSCA-basedApplicationsintheCloud
53
operate on their underlying counterparts on objects.
Javassist is a class library for editing Java byte-codes;
it enables Java programs to define a new class and
to modify a class file when the Java Virtual Machine
(JVM) loads it.
The next subsection presents some experiments of
our micro-container enhanced with monitoring capa-
bilities, related to memory consumption and notifica-
tions’ latency time.
4.2 Experimentation
In our work, we propose a platform able to deploy
components in the Cloud on top of scalable micro-
containers, with the capability of transforming com-
ponents to be monitorable even if they were not de-
signed with monitoring facilities. The proposed mon-
itoring system is flexible in the way of choosing the
best deployment scenario to meet the deployer re-
quirements. As far as we know, almost all of the ex-
isting monitoring solutions use one channel to deliver
monitoring information, but in our approach we ex-
hibit the possibility of using a channel at the granular-
ity of a component. In our experiments, we compare
the results obtained using one channel for all publish-
ers and using one channel per publisher. For our ex-
periments, we have considered two criteria:
• Memory consumption: Memory size consumed
by the micro-container with or without monitor-
ing facilities.
• Notification Latency Time: The elapsed time be-
tween the occurrence of the event and the notifi-
cation reception from all subscribers.
To perform these tests we used the NCF (Network and
Cloud Federation) experimental platform deployed at
Telecom SudParis France. The NCF experimental
platform aims at merging networks and Cloud con-
cepts, technologies and architectures into one com-
mon system. NCF users can acquire virtual resources
to deploy and validate their own solutions and ar-
chitectures. The hardware component of the net-
work is in constant evolution and has for information:
380 Cores Intel Xeon Nehalem, 1.17 TB RAM and
100 TB as shared storage. Two Cloud managers al-
low managing this infrastructure and virtual resources
i.e. OpenNebula (OpenNebula, 2012) and OpenStack
(Openstack, 2012). In our case, we used OpenNeb-
ula which is a virtual infrastructure engine that pro-
vides the needed functionality to deploy and manage
virtual machines (VMs) on a pool of distributed phys-
ical resources. To create a VM, we can use one of the
three predefined templates offered by OpenNebula i.e.
SMALL, MEDIUM and LARGE, or we can specify
a new template. During our experiments, we used our
specific template with the following characteristics: 4
cores (2.66 GHZ each core) and 4 Gigabytes of RAM.
To perform our tests, we defined two scenarios that
reflect the objectives that we want to highlight in our
experiments. The details of these experiments are as
follows:
• Compare micro-container memory consumption
before and after adding monitoring facilities to es-
timate the overhead of the monitoring module on
the micro-container consumption.
• Compare notification latency time in the micro-
container using monitoring system with one chan-
nel or monitoring system with multi-channels (i.e.
one channel per micro-container).
In the different series of tests, we deployed dif-
ferent numbers of services on top of the micro-
container. The used service in these experiments is
a service that has a changing property. Whenever this
property changes the service sends a notification to
its channel (MonitoringBySubscription component)
which pushes this notification to all the subscribers.
In the first series we deployed services on micro-
containers without monitoring capabilities and we
took memory consumption measurements for each
number. Then, we deployed the same number of ser-
vices on top of the micro-container enhanced with the
monitoring module.
The purpose of this experimentwas to estimate the
overhead of the monitoring module on the memory
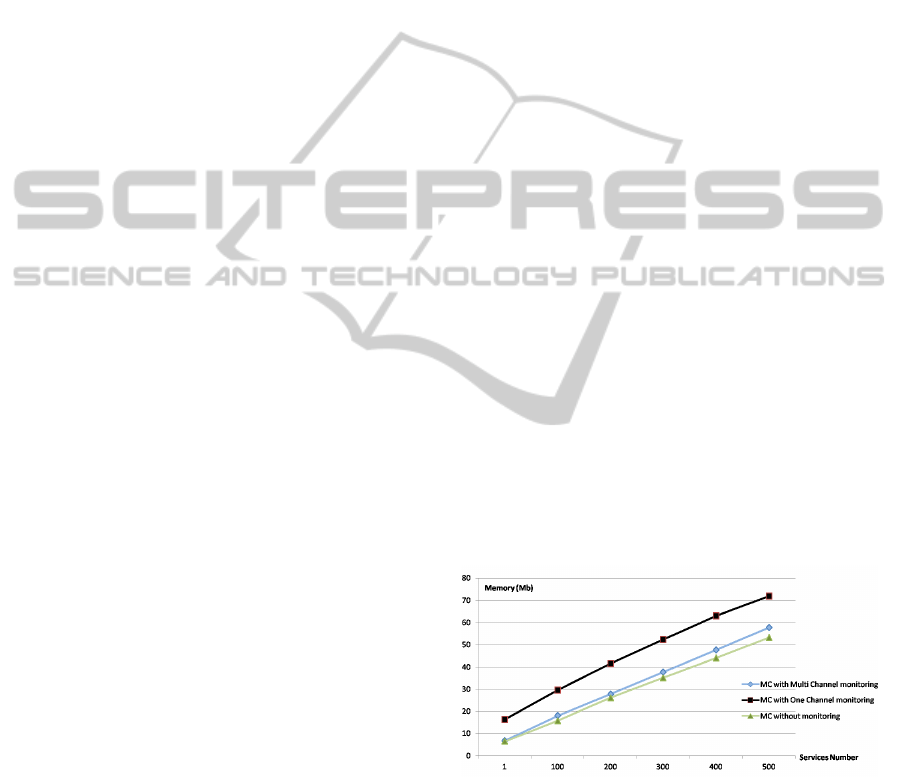
consumption of the micro-container. Figure 9 shows
the different values stored during these series includ-
ing the JVM size.
Figure 9: Memory consumption using micro-containers
(MC).
These experiments show that the overhead of the
monitoring module on the memory consumption of
the micro-container is fair. In fact, the memory con-
sumption is linear, increasing with the number of de-
ployed services. The results show that the overhead of
the memory consumption using one channel is more
important than the overhead using multi-channel sce-
nario. That can be explained by the fact of adding an
CLOSER2013-3rdInternationalConferenceonCloudComputingandServicesScience
54
extra JVM containing the channel and that adds the
extra memory consumption noticed in the Figure 9.
In the second series of tests, we aimed to com-
pare the notification latency time using the micro-
container enhanced with monitoring mechanisms in
the two cases: using one channel and multi chan-
nel monitoring. Each series, we fixed the number of
deployed services and we changed the frequency of
events occurrence. After storing these measurements,
we calculate the average latency time for each series.
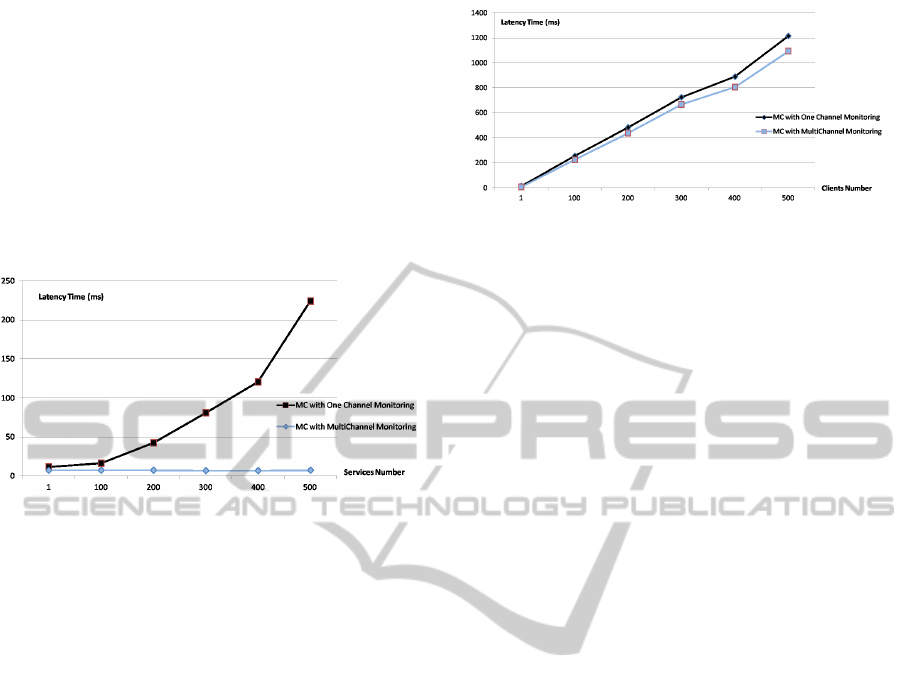
The stored values are shown in the Figure 10.
Figure 10: Notification latency time with one client using
One Channel monitoring and Multi Channel monitoring.
The Figure 10 shows the evolution of notifica-
tion latency time during the experimentation. Specifi-
cally, these values represent the needed time from the
event’s raise till the reception of the notification by
all subscribers. When the number of events becomes
important, the channel is exposed to a big number of
notifications, since all notifications are targeting the
same channel. This latter should forward each notifi-
cation to the list of the interested subscribers. When
using a multi-channel system, every micro-container
contains its own channel. Consequently, it is asked
to manage just its own notifications. It will deal with
a less number of notifications and subscribers. That
explains the results shown in the Figure 10 where the
notifications’ latency time is almost the same using
the multi-channel monitoring system and it is increas-
ing proportionally with the number of services when
we use micro-containers with one channel monitoring
system.
The third series of experiments aimed at compar-
ing notification latency time using one channel moni-
toring and multi-channel monitoring with a changing
number of clients. For all the tests we used one ser-
vice as a publisher and one channel. Each time, we
considered a fixed number of clients and we changed
the frequency of events occurrence. The stored val-
ues shown in Figure 11 presents the needed time for a
notification to reach all the subscribers.
The Figure 11 shows that the values obtained us-
ing one channel monitoring are a little higher then
Figure 11: Notification latency time with Multi Clients us-
ing One Channel monitoring and Multi Channel monitor-
ing.
those obtained using multi-channel monitoring. This
difference is explained by the needed time for a notifi-
cation to reach the channel when we use one channel
monitoring, this value is relatively small when we use
multi channel monitoring because the publisher and
the channel are located in the same machine.
The next section exposes some approaches that
tackled monitoring in cloud environments and ends
with comparing these approaches against our ap-
proach.
5 RELATED WORK
In the literature, there are many attempts to pro-
vide monitoring applications in the Cloud and in dis-
tributed systems. In this section, we present some
proposed approaches in the monitoring area. We
conclude by explaining the limitations of these ap-
proaches.
Nagios (Nagios, 2010) is an open-source core sys-
tem for network monitoring. It allows monitoring IT
infrastructure to ensure that systems, applications and
services are functioning properly. Monitoring can be
applied on private or public services (private services
are services and attributes of a server and public ser-
vices are those available across network). To monitor
any target, Nagios uses a list of plug-in that would be
executed to poll the target status. Plug-ins acts as an
abstraction layer between the monitoring daemon and
the monitored targets. It enables remote command ex-
ecution to know the status of the monitored target.
There are several plug-ins for different protocols as
SNMP, NRPE or SSH. Monitoring using Nagios can
result in high load on the monitoring server if applied
on a large number of targets.
Ganglia (Massie et al., 2004) is an open-source
monitoring system for high-performance computing
systems. It is based on a hierarchical design targeted
at federations of clusters. It uses a multi-cast-based
listen/publish protocol within a cluster. Within each
MonitoringofSCA-basedApplicationsintheCloud
55

cluster, Ganglia uses heart beats messages on a well
known multi-cast address as the basis of a member-
ship protocol. Membership is maintained by using
the reception of a heartbeat as a sign that a node is
available. Each node monitors its local resources and
sends multi-cast packets containing monitoring data
on a well known multi-cast address. All nodes listen
for monitoring packets on the agreed multi-cast ad-
dress to collect and maintain monitoring data for all
other nodes (Massie et al., 2004). Each cluster can be
represented with one node, since all the nodes con-
tain a complete copy of the cluster monitoring data.
Aggregation of monitoring data is done by polling
child nodes at periodic intervals. Monitoring data is
exported using a TCP connection to the node being
polled followed by a read operation of its monitoring
data. Ganglia Monitoring is implemented by a mon-
itoring daemon, which is organized as a collection of
threads, each assigned a specific task:
• Collect and publish thread: collects local node in-
formation and publishes it on a well known multi-
cast channel. It sends periodic heartbeats.
• Listening threads: listen on the multi-cast channel
for monitoring data from other nodes and updates
monitoring data storage.
• XML export threads: accept and process client re-
quests for monitoring data.
Ganglia Monitoring system assumes the presence of
a native multi-cast capability, an assumption which
does not hold for the Internet in general.
The mOSAIC framework (Rak et al., 2011) of-
fers a Monitoring/Warning system that monitors ap-
plications’ components and cloud resources. From
authors’ point of view, this system should realize the
following tasks: monitor cloud resources, monitor ap-
plications’ components and discover warning condi-
tions. The proposed framework contains four basic
elements:
1. Monitoring event buses that collects monitoring
events from the resources,
2. Connectors related to the event buses to enable the
interception of monitoring events by the suitable
components,
3. Connectors receiving the events from applications
to the event buses, and
4. Monitoring/Warning component.
Only one archiver collects monitoring information
from different collectors and stores the messages in
a storage system, and one component called the ob-
server accesses the storage filled by the archiver and
generates events in order to distribute selected infor-
mation to all the interested components.
H. Huang et al. (Huang and Wang, 2010) pro-
posed an approach to monitor resources in the cloud
using a hybrid model combining the push and the pull
models. In these models, there are three basic compo-
nents, the Producer, the Consumer and the Directory
services. In the Push model, whenever the producer
detects a change in a resource’s status, it sends infor-
mation to the consumer. Otherwise, in the Pull model,
it’s the consumer who asks the producer periodically
about the resource’s status. It is obvious that these
two models have advantages and weakness. The au-
thors propose a hybrid model that can switch to the
best suited model according to the user requirements.
The user can define his tolerance to the status inaccu-
racy between the producer and the consumer. Using
this value, an algorithm can switch between pull and
push models. This approach does not use the concept
of channel. Thus, the producer is in charge of sub-
scriptions and sending notifications for all interested
subscribers.
Almost all of these monitoring approaches do not
offer a granular description of monitoring require-
ments. They do not tackle the case where compo-
nents are not designed to be monitored. Moreover,
in the stated works, the monitoring systems do not
address scalability issues. In contrast, in our ap-
proach, we provide a model to describe the monitor-
ing requirements with a tunable granularity. We also
provided needed mechanisms to render components
monitorable even if they were not designed with mon-
itoring facilities. Finally, we proposed to use a scal-
able micro-container enhanced with monitoring facil-
ities to reconcile monitoring and scalability issues.
Our approach adds more deployment flexibility en-
abling one channel monitoring (i.e., one channel for
all monitored components) and multi-channel moni-
toring (i.e., one channel per monitored component).
6 CONCLUSIONS AND FUTURE
WORK
Monitoring remains an important task to efficiently
manage the cloud, but is still a challenge to find a
monitoring solution to reconcile the granular descrip-
tion for monitoring requirements, the efficiency of the
monitoring solution and its scalability. In this paper,
we provided an extension for Service Component Ar-
chitecture to allow components to describe their need
to monitor other components properties with a tunable
granularity. Moreover, we proposed a framework that
provides the needed mechanisms to apply transforma-
tions on components to render them monitorable even
if they were not designed with monitoring capabili-
CLOSER2013-3rdInternationalConferenceonCloudComputingandServicesScience
56

ties. Then, we proposed a platform that encapsulates
the transformed components on top of scalable micro-
containers and deploys them in the Cloud. Finally, to
show the efficiency of our framework, we described
its implementation and we performed different exper-
imentations.
In our future work, we aim at using monitoring in-
formation to apply adaptations or reconfigurations on
components during the runtime. We aim also to ren-
der monitoring transformations feasible even at run-
time and not only at deployment time as it is the case
currently. So if the monitoring service is not in use,
we can turn it off to decrease the energy consump-
tion for example. To this end, we will challenge the
fact that we have to apply a live transformation of the
component and to dynamically adapt its links with the
outside during the runtime. And finally, we want to
experiment this work at different levels in the Cloud
(i.e. Networking, Hardware and Software levels).
ACKNOWLEDGEMENTS
The work presented in this paper was partially
funded by the French FUI CompatibeOne, the French
FSN OpenPaaS and the European ITEA Easi-Clouds
projects.
REFERENCES
Baldoni, R., Beraldi, R., Piergiovanni, S., and Virgillito,
A. (2004). Measuring notification loss in pub-
lish/subscribe communication systems. In IEEE Pa-
cific Rim International Symposium on Dependable
Computing.
Becker, C., Handte, M., Schiele, G., and Rothermel, K.
(2004). PCOM - A Component System for Perva-
sive Computing. In IEEE International Conference
on Pervasive Computing and Communications, PER-
COM ’04.
Bruneton, E., Coupaye, T., Leclercq, M., Qu´ema, V., and
Stefani, J.-B. (2006). The FRACTAL component
model and its support in Java: Experiences with Auto-
adaptive and Reconfigurable Systems. Software Prac-
tice and Experience, 36.
Chiba, S. (2010). JAVA programming Assistant. http://
www.csg.is.titech.ac.jp/∼chiba/javassist.
Dhesiaseelan, A. and Ragunathan, A. (2004). Web services
container reference architecture (WSCRA). In IEEE
International Conference on Web Services.
Dunne, R. (2008). Introduction to the Newton Project Dis-
tributed OSGi & SCA .
Foundation, A. S. (2011). Apache Tomcat Architecture.
ENI.
Huang, H. and Wang, L. (2010). P&P: A Combined Push-
Pull Model for Resource Monitoring in Cloud Com-
puting Environment. In IEEE International Confer-
ence on Cloud Computing.
Java 2 Platform API Specification (2010). http://
download-llnw.oracle.com/javase/1.4.2/docs/api/java/
lang/reflect/package-summary.html.
Laws, S., Combellack, M., Mahbod, H., and Nash, S.
(2011). Tuscany SCA in Action.
Massie, M. L., Chun, B. N., and Culler, D. E. (2004). The
ganglia distributed monitoring system: design, im-
plementation, and experience. Parallel Computing,
30(7).
Mohamed, M., Bela¨ıd, D., and Tata, S. (2012). How to
Provide Monitoring Facilities to Services When They
Are Deployed in the Cloud? In CLOSER.
Nagios (2010). Nagios Documentation. http://
www.nagios.org/documentation.
NIST (2011). Final Version of NIST Cloud Comput-
ing Definition Published. http://www.nist.gov/itl/csd/
cloud-102511.cfm.
Open SOA Collaboration (2008). Service Component Ar-
chitecture (SCA): SCA Assembly Model v1.00 speci-
fications. http://www.osoa.org/.
OpenNebula (2012). OpenNebula. http://opennebula.org.
Openstack (2012). Openstack. http://www.openstack.org.
OSGI (1999). Open Services Gateway Initiative. http://
www.osgi.org.
Perera, S., Herath, C., Ekanayake, J., Chinthaka, E., Ran-
abahu, A., Jayasinghe, D., Weerawarana, S., and
Daniels, G. (2006). Axis2, Middleware for Next Gen-
eration Web Services. In International Conference on
Web Services, ICWS ’06. .
Rak, M., Venticinque, S., Mahr, T., Echevarria, G., and Es-
nal, G. (2011). Cloud Application Monitoring: The
mOSAIC Approach. In IEEE International Confer-
ence on Cloud Computing Technology and Science.
Szyperski, C. (2002). Component Software: Beyond
Object-Oriented Programming. Addison-Wesley/
ACM Press, 2nd edition.
Yangui, S., Mohamed, M., Tata, S., and Moalla, S. (2011).
Scalable Service Containers. In IEEE International
Conference on Cloud Computing Technology and Sci-
ence.
MonitoringofSCA-basedApplicationsintheCloud
57
