
Exploiting Capacity Planning of Cloud Providers to Limit
SLA Violations
Nadia Ranaldo and Eugenio Zimeo
Department of Engineering, University of Sannio, Benevento, 82100, Italy
Keywords: Cloud Computing, Service Level Agreement, Automatic Negotiation, Quality of Service, Resource
Management, Capacity Planning.
Abstract: Automatic negotiation of Service Level Agreements (SLAs) is a promising way to stipulate contracts in the
Cloud market, where the high dynamicity of customers' requirements and providers' resources availability
make it very difficult to statically define Quality of Service (QoS) level and pricing. To achieve high
satisfaction levels for both parties, the negotiation decisions about stipulation conditions (or rejection) of
contracts should be guided both by an overall strategic business policy and by dynamic information. In this
paper, we propose to exploit capacity planning to support bilateral negotiation processes with the aim of
optimizing the overall utility for service providers, by avoiding contracts that could incur in SLAs
violations, keeping, at the same time, competitive service prices. In particular, the proposed technique
exploits a heuristic algorithm to automatically evaluate a non-additive utility function and the acceptable
region, taking into account QoS, resources availability, costs and penalties. The technique is compared with
static approaches by using some simulations.
1 INTRODUCTION
In the Cloud context, legal contracts between
customers and services providers are typically
defined by means of Service Level Agreements
(SLAs) (Wu and Buyya, 2012). They allow to
formally describe the offered functions, the QoS
levels the provider promises to meet and the parties’
responsibilities. Platform as Service (PaaS)
providers (e.g. Google App Engine and Force.com),
often offer a pool of differentiated services with pre-
fixed prices related to the complexity of the
deployed applications, measured through metrics
such as the number of applications and database
objects. For these services, SLAs are currently used
to define the granted service availability (uptime)
level and a credit-based penalty system in case of
violation. However, they do not offer, yet, the
possibility to define fine-grained and custom SLAs
that take into account specific performance
parameters and related service pricing. To this aim,
automatic negotiation of SLAs is standing out as a
viable approach to stipulate contracts on a dialogue
basis between the negotiation actors (providers and
customers). It allows to resolve conflicts deriving by
different and continuously changing goals, policies
and preferences of customers and providers
(Czajkowski et al., 2005).
A negotiation process is distinguished in
unilateral, if an actor (typically the provider) makes
a SLA proposal and the other actor can only decide
to accept or reject it, and bilateral, if both the actors
have an active role in proposing SLAs. The main
features of an automatic negotiation process are: the
negotiation protocol, which formalizes the rules for
message exchange among the negotiation actors, the
SLA proposal, made of a SLA template, representing
the fixed part of all the proposals exchanged among
the actors during the negotiation process, and a set
of values for the negotiable (variable) parameters,
and the negotiation strategy, that is the reasoning
model adopted by each actor to guide negotiation
decisions and actions.
Bilateral negotiation strategies driven by time-
based decision functions (Raiffa, 1982), widespread
because of their simplicity and effectiveness, adopt a
decision model made of a utility function,
representing the satisfaction level received by a SLA
proposal, and a region of acceptable offers (called
acceptable region), containing the proposals with a
utility value included between the reservation and
the maximum value. The agreement is reached in the
184
Ranaldo N. and Zimeo E..
Exploiting Capacity Planning of Cloud Providers to Limit SLA Violations.
DOI: 10.5220/0004377001840195
In Proceedings of the 3rd International Conference on Cloud Computing and Services Science (CLOSER-2013), pages 184-195
ISBN: 978-989-8565-52-5
Copyright
c
2013 SCITEPRESS (Science and Technology Publications, Lda.)

region mutually acceptable by both the actors, called
negotiation space. Time-based decision functions
allow to make time-dependent concessions with
respect to an initial utility value (e.g. the maximum
one) with the aim to reach an agreement within the
maximum negotiation time. In particular, when a
proposal is received, the related utility value and
belonging to the acceptable region are computed.
On the basis of such evaluations, and of elapsed
time, the strategy decides on the acceptance or
rejection of the proposal, the counter-proposal
generation or negotiation termination. In literature,
typically, the decision models are represented by
multi- and independent-attribute utility functions,
instantiated by a set of statically and manually
defined parameters. On the other hand, in a realistic
Cloud market, negotiable parameters, such as price
and QoS levels, can not be considered independent
for utility definition. In fact, the service price
depends on resources cost, that, in its turn, depends
on the agreed QoS terms. Moreover, we argue that
the utility definition, in order to lead to proper
decisions about the stipulation or rejection of
contracts, should be guided by an overall strategic
business policy and dynamic information about the
negotiation context, such as the market trend, the
effective customers' requirements and providers'
capacity availability. As an example, a provider
could accept (refuse) an offer with low price during
a high (low) competitive market phase.
Analogously, an offer with the same QoS level and
price could be accepted or refused on the basis of
different service usage conditions (e.g. the
forecasted daily load peak).
In this work, we focus on bilateral SLA
negotiation of PaaS services for hosting Web
applications. Cloud is becoming a widespread
solution for hosting Web applications, especially
when they are used by a growing number of users.
We define a utility model non-additive with respect
to negotiation parameters, that represents the overall
provider economic profit deriving by a new contract,
net of resources’ costs and penalty for QoS
guarantees violations and eventual variation in
profits of already signed SLAs. We take into account
the penalty payment both as direct and indirect (due
to reputation level degradation) profit losses. We
propose a dynamic evaluation of the utility model
based on a capacity planning technique that suggests
the best profitable resources allocation plan by
avoiding (or reducing) violations of QoS guarantees.
The following section introduces related work.
Section 3 describes the SLA model for the PaaS
service and the capacity model. Section 4 and 5
presents respectively the proposed utility model and
an evaluation technique based on capacity planning.
Section 6 shows the benefit of the proposed
technique with respect to the static approach by
using some simulations. Finally, Section 7 describes
conclusion and future work.
2 RELATED WORK
Many negotiation strategies adopting time-based
decision functions (Faratinet al., 1998) are based on
a multi-attribute additive utility function, assuming
that the negotiable parameters are independent of
each other. Moreover, the utility functions and
related acceptable regions are defined statically and
require human intervention (Li et al., 2006), (Chhetri
et al., 2006), (Zulkernine and Martin, 2011), limiting
the applicability of such approaches in highly
dynamic environments, such as Cloud.
Macias and Guitart (2010) propose the adoption
of non-additive multi-objective utility functions for
satisfying both business and performance goals in
unilateral negotiation of Cloud services for Grid.
The utility function takes into account various
objectives (economic revenue maximization and
reputation, priority to tasks or services executed in
off-peak hours). When a provider receives a
proposal, the utility function is maximized, taking
into account economic factors and resources
availability information, to propose an offer to the
customer. In a similar way, we propose a non-
additive utility function and a maximization problem
to define the utility function and the acceptable
region for a bilateral negotiation processes.
Spillner and Schill (2009) propose the semi-
automatic adjustment of SLA templates, published
by providers in an advertisement service registry and
adopted as starting point of negotiation processes. It
is based on a performance prediction model, that
exploits both run-time and historical monitoring
data, to define the sustainable QoS level before
reaching the resource limit and eventually incurring
in SLA terms’ violations. Whilst in this approach the
adjustment of SLA templates has to be performed
manually by providers' operators, we define a
capacity-planning driven negotiation to fulfil a
business policy automatically.
Capacity planning of IT infrastructures, both for
optimized short-term resource management and
long-term investment plans, can be employed by
service providers to manage SLAs and promised
QoS levels in the most profitable way (Allspaw,
2008). The problem of a self-adaptive capacity
ExploitingCapacityPlanningofCloudProviderstoLimitSLAViolations
185

planning for optimizing SLA economic profits for
Internet Services was investigated considering a set
of signed SLAs. Some approaches leverage the
queuing theory to solve an optimization resource
allocation problem under constraints on the service
rate. In particular, Almeida et al. (2006) take into
account the profit with respect to the penalty and
Abrahao et al. (2006) the reward in case a surge
workload is supported. As in our proposal, resource
virtualization for performance isolation and dynamic
resource allocation (Graupner et al., 2003) is
exploited in both the solutions. Liu, Squillante and
Wolf (2001) analyze the resource allocation problem
to maximize the profit for a Web server farm
attained in the hosting of e-commerce sites subject
to different classes of QoS requirements, related, in
particular, to the delays experienced by customers.
The optimal or near-optimal solution to this problem
is based on methods derived from probability theory,
queuing theory and combinatorial optimization.
3 PAAS SERVICE NEGOTIATION
3.1 SLA Model
In the following, the analysis is referred to a PaaS
service for Web application hosting, called Virtual
Web Platform (VWP) service. A VWP service offers
a virtual platform used to host a Web application. It
is composed of multiple components, deployed on
the provider resources according to a multi-tier
architecture. The SLA model, to formally define the
contract aspects which the customer and the provider
come to an agreement on, is structured in four
sections: (1) service description, (2) QoS target, (3)
measurement and (4) penalty/reward system.
The service description defines the application
components, the contract validity period, denoted as
D, the price, denoted as P, based on an “una-tantum”
payment model, and the service usage conditions
under which the provider is responsible for the QoS
terms. Service usage conditions are defined through
the workload plan expected for the Web application
in different moments of a business day, modelling
the typical fluctuations of Web application-
generated traffic (Chase and Anderson, 2001). It is
given by W={w
1
,...,w
K
}, where w
k
, k:1,...,K
represents the number of incoming requests received
and completed in the k-th time slot of a day.
The QoS target section defines the QoS
guarantee terms. It states that the response time has
to not overcome a maximum value, denoted as T,
and the service availability has to not decrease under
a prefixed percentage value called MinAvail.
The measurement section defines the
measurement process adopted for monitoring QoS
targets. The maximum response time T is influenced
by various delay components, some of them are not
under the provider responsibility (such as data
transfer delay outside the data center performed on
public networks used without contract regulation).
For this reason, we define T as the time interval
beginning from the HTTP request receipt on the
provider infrastructure to the HTTP response
completion and transfer beginning. Moreover, since
the response time depends on the processing time of
the specific invoked Web component, in order to
obtain comparable measures, we introduce a
customized Web component, called Benchmarking
Web Component (BWC), defined by the customer to
characterize the Web application in terms of typical
operations load. Finally, we define as measurement
sample the average of a set of single measurements
retrieved during a small interval time, called
monitoring time unit. This approach avoids to detect,
as QoS violation, isolated performance degradations
during transitory situations, typical of adaptation
actions on resource allocation.
The penalty/reward system section defines the
monetary penalty the provider has to pay when the
QoS targets are not satisfied, and the monetary
bonus the customer has to pay when an
additional/not mandatory condition or QoS term is
reached by the provider.
We consider a penalty directly proportional to
contract price, QoS violation degree and duration. In
particular, it is expressed as the summation of
penalty amounts derived from each monitoring time
unit. Indicated with Pen
dkj
, d=1,…,D, k=1,…,K,
j=1,…,J the penalty in the j-th monitoring time unit
of the k-th time slot of the d-th contract day, the total
penalty, Pen, is expressed as
.
(1)
depends on the difference between the
measured response time and T, denoted as
∆
, and
on the price related to a monitoring time unit,
denoted as p, as follows:
0∆
0
∆
∆
0∆
∆
∆
∆
α0,
.
(2)
Moreover, the penalty system specifies that, in case
CLOSER2013-3rdInternationalConferenceonCloudComputingandServicesScience
186

the service is available in a number of monitoring
time units less than the percentage MinAvail, the
customer has the right to recede from the contract
and to receive a refund. We state that a service is
available in a monitoring time unit when the
difference between the related measurement sample
and T is less than a maximum value permitted,
indicated with ∆
.
Summarizing, an SLA signed by a provider,
denoted as SLA
i
, i=1,…,N, is represented by the
following parameters:
,
,
,
,
,
,
(3)
where beg
i
and end
i
represent, respectively, the
starting and ending day of the contract validity
period and D
i
its duration. In the following, we
consider the same time slot partitioning and contract
validity period, with duration D, for all SLAs.
During the negotiation process of a new SLA, called
SLA
N+1
, we consider the exchange of SLA proposals.
Each proposal is a SLA template with specific
values for parameters in (3) except for price P
N+1
and response time T
N+1
, that represent the negotiable
parameters.
3.2 Capacity Model
To meet the QoS terms we adopt a replication
schema to the application server tier, while the Web
server is used as a load balancer and a unique
database server is shared. Replication is handled by
virtual machines (each one hosting an application
server) allocated on a set of hardware resources (see
Figure 1). Under these assumptions, we model the
overall system capacity as a set of M independent
virtual machines with the same hardware
characteristics and performance. We denote as
N
i
={n
idk
}, i=1,...,N, d=1:,...,D, k=1,...,K the resource
allocation plan for each SLA
i
composed of the
number of virtual machines assigned to the related
VWP service in the time slots of each contract day.
Figure 1: The capacity allocation to a set of VWP services.
4 UTILITY MODEL
The proposed utility model evaluates the profit that
the provider achieves by accepting a new SLA
taking into account QoS targets, usage conditions,
the current capacity availability, the resource
allocation plans and utility deriving from each
already signed SLA.
The utility, denoted by U(P
N+1
,T
N+1
), deriving by
a new contract, SLA
N+1
, with negotiable parameters
(P
N+1
,T
N+1
), is defined as the difference between the
overall profit accommodating the new contract
(denoted as V’) and the one gained by the already
signed SLAs, SLA
i
, i=1,…,N (denoted as V),
,
.
(4)
Both V’ and V are evaluated by means of the
overall profit function v
S
related to a generic set S of
K SLAs
,
,
(5)
indicating the dependency on SLA parameters in (3)
and resource allocation plans.
Adopting an additive model with respect to the
profit deriving from a single SLA, (5) becomes
≡
,
,
(6)
where U
S
i
is the contract utility deriving by a
contract SLA
i
∈S, and N
S
i
the related resource
allocation plan.
Indicated by P the set of N already signed SLAs,
and by Q the set P plus SLA
N+1
, (4) becomes
,
,
,
.
(7)
Varying price and response time, the utility
defined with (7) changes, and its value, typically
adopting a normalized form, is used by the
negotiation strategy to decide if a proposal can be
accepted, to generate a counter-offer, and so on.
Contract utility U
i
, expressing the profit gained
by a contract SLA
i
, is defined as the following:
,
.
(8)
where Cost
i
is the cost of SLA
i
and Pen
i
is the
provisioned penalty. Both Cost
i
and Pen
i
depends on
SLA parameters and by the resource allocation plan.
In order to adjust the price in response to the
changing market supply and demand, we propose a
dynamic market-based price function, proportional
with the cost of the resource allocation plan. In
ExploitingCapacityPlanningofCloudProviderstoLimitSLAViolations
187

particular, P
i
is defined as
1
,
0,01,01,
(9)
where ρ is a factor defined by market historical data
analysis and des represents the interest level of the
provider in signing a new contract. It is calculated
on the basis of the probability for a provider to be
chosen by a customer among the available ones
(higher is the interest level and lower is the price).
Finally, g is a factor useful during the negotiation
process to vary the price between the reserved price
(e. g. the service cost) and the maximum one (e. g.
the maximum allowed under well-defined market
conditions).
Cost
i
, under the assumption of a fixed cost for
virtual machine usage per time slot, denoted by c, is
modeled as
∑∑
,
(10)
where C
base
is a fixed cost for the virtual platform
management.
The penalty incurred during the contract validity
depends on the application performance provisioned
adopting both the resource allocation plan, and the
workload provisioned for the service. We take into
account the workload plan declared by the customer,
but a more accurate provisional model, based on
monitoring data during service operation and/or
Web workload modeling techniques, will be adopted
in the future in order to reduce costs (e.g. energy
consumption of under-exploited resources). The
proposed performance forecasting mechanism is
based on a benchmarking technique that uses the
measurement process described in Section 3.2. A
function, that will be useful for utility evaluation, is
the performance function ,), that relates the
response time of BWC to number n virtual machines
and to workload w.
The acceptable region, indicated as
,
represents the region of negotiable parameters
(P
N+1
,T
N+1
) for the proposals of the new contract,
whose utility U is acceptable. For the utility model
with independent parameters proposed by Raiffa
(1982), the acceptable region is defined by means of
the static minimum and maximum value of each
parameter. As a consequence, it is composed of all
proposals whose parameters values are within their
respective acceptable intervals. On the contrary, for
the proposed utility model, the interval of acceptable
prices depends on the cost of the resource allocation
plan, that, on its turn, depends on the response time.
We define the acceptable region as follows:
indicated with [T
min
, T
max
] the interval of acceptable
response times, called acceptable performance
interval, a proposal (P
N+1
,T
N+1
) belongs to the
acceptable region
if T
N+1
is contained within the
acceptable performance interval and if P
N+1
belongs
to the interval of acceptable prices related to T
N+1,
called acceptable price interval, indicated with
[P
min
(T
N+1
), P
max
(T
N+1
)]. Within the acceptable
region the utility is included between the reservation
value, called
, and the maximum allowed one,
called
. Summarizing
is given by
,
:
∈
,
,
∈
,
.
(11)
5 UTILITY
BASED ON CAPACITY
PLANNING
The hosting of a new service is guided by the
principle of optimizing the gained utility (7). To this
aim, the problem of utility definition for the
negotiation strategy is expressed as the following:
given a proposal for the new service with certain
values for price and response time, a capacity
planning problem is performed in order to find the
optimal resource allocation plan that allows to obtain
the best utility value, taking into account the
available resources in various time slots of contract
period and the utility gained by the already signed
SLAs. Moreover, it is necessary to define the
conditions under which such utility is considered
acceptable. We consider two resource allocation
policies, the progressive and the conservative ones.
With the former, the hosting of a new service takes
into account changes in the resource allocation plan
for the already signed contracts, so potentially
causing a variation in their cost and penalty. With
the conservative policy the resource allocation plan
for the new contract is spread out on effective
available resources and does not affect the resource
allocation of the already signed services.
The problem of the best resource allocation plan
, related to the new contract SLA
N+1
,
characterized by negotiation parameters (P
N+1
,T
N+1
),
is formulated as follows:
,
,
subject to
, ∀,∀,
(13)
n
,∀,∀,∀,
(14)
CLOSER2013-3rdInternationalConferenceonCloudComputingandServicesScience
188

0,
,
∈
,∀,∀,∀,
(15)
where
, i:1,…,N, represent the new
resource allocation plans adopted for the already
signed SLAs, and
, i:1,…,N+1,
the optimal resource allocation plan that, at
minimum cost, allows to obtain a response time less
that T
i
in each time slot. Each
is given by the
minimum between the minimum number of virtual
resources necessary to reach a response time within
T
i
(under the related workload plan w
k
) and the
maximum number of assignable resources, indicated
with n
max
:
:
,
,
(16)
This optimization problem finds the resource
allocation plans for all SLAs that maximize utility in
(7), taking into account the overall capacity
(constraint (13)) and SLAs. (15) states that
must
be integer numbers and less than n
max
.
Constraint (14) maintains at minimum the cost
for the new contract, allowing to avoid waste of
resources and to offer competitive services. It states
that, for each contract, the number of assigned
resources, in each time slot, must be less or equal
than the optimal one
.
In addition to constrains (13), (14) and (15), if a
progressive resource allocation policy is adopted,
additional constraints can be formulated to limit re-
allocation actions that could cause uncontrolled
reduction of each contract profit, related
performance and reputation. Such constraints are,
for example, limitations on the maximum number of
virtual resources that can be added/subtracted to the
already signed SLAs in the new resources allocation
plans
,1,…, and on the maximum
performance degradation.
The utility optimization problem in (12) can lead
to negative and positive values, in case proposal
(P
N+1
,T
N+1
) leads to a loss of profit for the provider,
or to an effective gain respectively. In general, the
overall business policy can dynamically guide the
decision whether a proposal is satisfying or not,
leading to a more competitive or conservative
approach.
To define the acceptable region, we adopt the
following conditions under which a proposal
(P
N+1
,T
N+1
) is defined acceptable:
- Response time acceptability condition: the utility
for the proposal (P
max
(T
N+1
), T
N+1
) has to be greater
that a percentage, indicated as MaxPMinU, of the
utility that can be gained with the optimal resource
allocation plan,
, and the related
maximum price. P
max
(T
N+1
), representing the
maximum price with respect to T
N+1
, is obtained
adopting (9) with g=0.
- Price acceptability condition: the utility for
response time T
N+1
must be included between the
minimum allowed utility and the maximum one. In
particular, the maximum utility,
, is the one
corresponding to the maximum allowed price, and
the minimum utility,
, is a percentage,
MinPMinU, of
.
- Service availability condition: the percentage of
whose response time overcomes T
N+1
more
than
∆
must be less than MinAvail.
5.1 A Heuristic
Since the negotiable parameters are not independent,
the utility model evaluation has a combinatorial
complexity. In order to be computationally feasible,
we propose a heuristic to find an approximation of
the acceptable region and of the utility function
adopting (12) for a limited number of cases and an
interpolation technique. The algorithm consists of
the following steps:
- Evaluation of T
max
, of the acceptable price interval,
[P
min
(T
max
), P
max
(T
max
)], and of utility for the
boundaries of such interval;
- Evaluation of T
min
, of the acceptable price interval,
[P
min
(T
min
), P
max
(T
min
)], and of utility for the
boundaries of such interval;
- Evaluation of utility for the maximum and
minimum prices of a certain number of response
times within the acceptable performance interval.
The algorithm starts with the definition of T
max
,
which represents the maximum response time
provisioned in the K time slots, characterized by
workloads
,…,
, adopting the minimum
number n
min
of virtual machines that can be assigned
to a service, (e. g. one virtual machine):
,
(17)
The acceptable price interval for T
max
is
evaluated through an iterative approach. The first
step is to solve (12) adopting a conservative resource
allocation policy. In this case, (7) becomes:
,
.
(18)
In order to maximize (18), we adopt a “best
effort” capacity planning approach. Considering
constraints (13), (14) and (15), the resource
allocation plan
is determined as following:
ExploitingCapacityPlanningofCloudProviderstoLimitSLAViolations
189

,
.
(19)
Then, the service availability condition for
is checked. If it is satisfied, P
N+1
, Cost
N+1
and Pen
N+1
are evaluated adopting respectively (8), (9) and (2).
If the response time acceptability condition is
satisfied, the acceptable price interval for T
max
is
evaluated exploiting the price acceptability
condition:
1
.
:
,
,
.
(20)
Considering only the conservative resource
allocation approach, different prices do not influence
the best assignable resource allocation plan. In this
case, the minimum price, P
min
(T
max
), is given by
1
1
1
,
(21)
If the service availability and the response time
acceptability conditions are not satisfied, the
progressing resource allocation policy is taken into
account. The basic idea is the following: for each
time slot in which the number of allocated resources,
, is less than both n
max
and the optimal number
, we find a re-allocation plan, involving the
already signed SLAs, that causes the best utility
increase. The process is stopped when the
acceptability conditions is satisfied. If the re-
allocation actions, performed in each time slot, do
not lead to satisfy the acceptability conditions, this
means that the new SLA, under the required
workload plan and contract validity period, does not
lead to an acceptable utility for any value of price
and response time. In this case the negotiation
request is refused.
T
min
is evaluated adopting an iterative approach
aiming to find the minimum response time that
satisfies the service availability and response time
acceptability conditions. At the beginning, T
min
is
defined as the minimum response time obtained
exploiting the resources actually available in each
time slot and the conservative resource allocation
policy:
,
,
,
,
,∀,∀.
(22)
If the acceptability conditions are not satisfied,
the progressing resource allocation policy is
exploited. If, also in this case, the acceptability
conditions are not satisfied, less values of T
min
are
attempted. A attempt value is obtained summing to
the previous one a little amount δ>0, until the
acceptability conditions are satisfied or T
max
is
reached. If a T
min
≥ (T
max
+ε), (ε>0), is found, and the
related acceptable price interval satisfies the
acceptability condition, the heuristic proceeds to the
next step. On the contrary, it stops and the
negotiation request is refused.
Because of non- linearity of the model, the utility
function is evaluated for a certain number of
response times internal to the acceptable
performance interval [T
min
, T
max
]. In particular,
called T
z
, z=1,…,Z the response times in which the
interval is partitioned, a simple technique to define
them is based on the partition of the interval into
equal-length parts:
1∗
,
.
(23)
For each T
z
, z=2,…,Z-1 the acceptable price
interval, [P
min
(T
z
), P
max
(T
z
)], and utilities for P
min
(T
z
)
and P
max
(T
z
) are evaluated.
Summarizing, the utility function and related
acceptable region are defined as follows:
- The acceptable performance interval [T
min
, T
max
];
- The acceptable price interval for Z response times
T
z
in the acceptable performance interval, [P
min
(T
z
),
P
max
(T
z
)], z:1,...,Z;
- Utility evaluated for each T
z
and the related
minimum and maximum acceptable price,
U(P
min
(T
z
), T
z
), U(P
max
(T
z
), T
z
), z:1,...,Z.
The normalized form of the utility function can
be defined normalizing the utility values between the
absolute maximum and the minimum values,
denoted respectively by U
max
and U
min
.
6 EXPERIMENTAL ANALYSIS
In this section, we present the results of the
evaluation of the proposed heuristic for utility
evaluation in terms of estimation error with respect
to the actual gained utility varying the price and
response time of a SLA proposal.
We discuss about the benefit the dynamic
approach introduces with respect to the static one in
CLOSER2013-3rdInternationalConferenceonCloudComputingandServicesScience
190

terms of satisfaction level for both provider and
customer. In the following, the price and response
time of a SLA proposal for a new contract are
indicated respectively with P and T.
The simulation results have been obtained by
adopting the conservative resource allocation policy,
and under the following conditions:
- workload plan W={w
1
,w
2
} defines the workloads
as number of requests/second (r/s) in two time
slots in which a day is subdivided (each time slot
has a duration of 12 hours);
- the contract validity period (the same for all the
contracts) has a duration of D = 180 days (about
six months);
- static competitive market conditions, characterized
by a provider interest level des=0.5;
- ρ=4 (see (9) for price definition);
-
0€, 0.5€, for
the resources cost;
- regarding the service availability condition,
MinAvail=100% and
∆
, that means the
service is always available, and, in particular, that
a proposal is not acceptable if there is a time slot in
which the number of assignable resources leads to
a response time that overcomes 2T. In this case,
(15) becomes
:
,
TT
∈,∀,∀,∀.
(24)
- Parameters for acceptability conditions are:
- MaxPMinU=45% (the utility gained adopting the
maximum price has to be at least the 45% of the
maximum utility that could be gained in case the
optimal resource allocation plan would be
assignable);
- MinPMinU=10% (the utility reserve value has to
be at least the 10% of the utility that could be
gained adopting the maximum price);
- δ=5 ms, ε=10 ms, for T
min
definition;
- n
max
=10,
n
min
=1;
- the number of response time evaluations Z=20;
- the initially available capacity in each time slot is
M=100.
6.1 Utility Model Analysis
The experimental results for the utility model
analysis refer to a SLA proposal characterized by
W={100 r/s, 300 r/s} and a linear trend of the
application performance, varying the number of
assigned resources from n
min
(=1) to n
max
(=10), and
the workload from 100 to 300 r/s. The performance
function ,), as defined in Section 4, is given by:
63220028300/180.
(24)
Moreover, we assume a capacity availability
greater than n
max
for each time slot. Figure 2 shows
the acceptable region in the bi-dimensional space
response time-price and Figure 3 the normalized
utility intervals (from the minimum to the maximum
price adopting respectively (21) and (20)) evaluated
for Z=20 response times within the acceptable
performance interval. Starting from the worst
response time, 250 ms, until 135.8 ms, the width of
acceptable price intervals and the maximum
normalized utility increase, because of an increasing
cost of the best assignable resource allocation plans
and lack of penalty. For best performance levels,
and, in particular, from 135.8 ms to 95 ms, the width
of acceptable price intervals and the maximum
normalized utility decrease, because of increasing
cost of the best assignable resource allocation plans
and an increasing penalty provisioned in the second
time slot characterized by a huge workload plan
(300 r/s).
By observing Figure 2, the proposed model leads
to different acceptable regions from the ones
produced by multi and independent attribute utility
functions (Raiffa, 1982). In particular, for such
model, the acceptable region has a rectangular shape
and the maximum utility is gained with respect to
the best value for each negotiable parameter, that
corresponds to the worst response time (250 ms) and
to the maximum price 3240 € (a combination of
values that does not reflect a SLA proposal in a
realistic Cloud market). On the contrary, the
proposed model reduces the acceptable region to the
proposals with feasible performances and
competitive prices. We state that the proposed model
can be effectively leveraged by a negotiation
strategy to quickly reach an agreement with high
satisfaction levels for both the provider and the
customer. Figures 4 and 5 show, respectively, the
influence of the workload plan and the capacity
availability on the intervals of utility values (varying
the price) for each response time T
z
.
Figure 2: Acceptable region with W={100 r/s, 300 r/s}.
ExploitingCapacityPlanningofCloudProviderstoLimitSLAViolations
191

Figure 3: Normalized utility in the acceptable performance
interval with W={100 r/s, 300 r/s}.
Figure 4 shows that, for uniform workload plans
(e.g. {100 r/s, 100 r/s}), the maximum utility has a
decreasing trend, since no penalty is applied. On the
contrary, for non-uniform plans, the utility reaches a
maximum and then decreases. Moreover, for
increasing workload, the acceptable performance
interval translates towards worst response times.
Figure 5 shows that a decrease of the number of
available resources from 10 to 5 for both time slots
leads to a reduction of the best response time and of
the maximum utility.
In order to evaluate the accuracy level of the
proposed heuristic, we compared the provisioned
utility with the actual one. The actual utility U
act
is
evaluated adopting (18), cost and performance of the
effective best resource allocation plan assignable to
a new contract, adopting the conservative resource
allocation policy and taking into account SLA
parameters and the current resources availability.
In particular, we define the absolute error E as:
|
|
(25)
Error E is influenced by the bi-linear
interpolation technique, adopted by the heuristic to
approximate the actual (non-linear) utility starting
from the utility evaluations for T
z
s, that removes the
integer constraint (15) on the number of resources
effectively assignable to a new contract.
The maximum absolute error E between the
utility provisioned (with Z=10) and the actual value
with respect to response times T
z
within the
acceptable region, for workload plan {100 r/s, 300
r/s}, is 91.9 € in correspondence of the maximum
actual utility (1306 €) and response time 132.4 ms,
leading to a maximum relative error of 7 %.
Moreover, with respect to all the possible SLA
proposals considering 30 values of T within the
acceptable performance interval, and for each
response time, 30 price values within the respective
acceptable interval, the number of proposals with
provisioned utility with error E greater than 90 % of
the maximum one is 23, corresponding to 2.55 % of
the total number (900) of proposals.
With Z=20, the maximum absolute error
becomes 65.1 €, while the percentage of proposals
with an error greater that the 90% of the maximum
one becomes 3.3%. Such results are satisfying,
because in a negotiation scenario the utility
provision of a SLA, performed to correctly delimit
the acceptable region, can tolerate a limited degree
of inaccuracy for the benefit of an acceptable
performance computation.
Figure 4: Utility varying the workload plan.
Figure 5: Utility varying the number of available resources
with W={150 r/s, 250 r/s}.
6.2 Dynamic versus Static Planning
To evaluate the effectiveness of the proposed
dynamic approach in increasing customer
satisfaction level and provider reputation, we
introduce some parameters tied to the agree price P
and response time T and the actual response time
during the contract validity period. In particular, we
define the price-based indicator, U
c
(P), as the
customer satisfaction level with respect to P, and the
CLOSER2013-3rdInternationalConferenceonCloudComputingandServicesScience
192

response time- based indicator, U
C
(T), as the
customer satisfaction level with respect to T and the
actual response time. Denoted with
Cost
op
t
,
(26)
the provider profit perceived by the customer with
the awareness of the resources cost for the optimal
allocation (Cost
opt
), the customer satisfaction is
maximum when P is equal to Cost
opt
, (and
0
while it is minimum when the maximum price,
P
max
is applied (and
). U
C
(P)
is defined as the normalized form of (26) as follows:
. (27)
(27) allows to obtain valued within the interval
[0, 1] for prices within [
, P
max
].
Since in our experimental scenario
P
max
=2Cost
opt
, (27) becomes:
2
.
(28)
For prices less than
,
is greater
than 1, for prices greater than P
max
it becomes
negative. As a consequence,
is adopted as an
indicator that a proposal is in the customer
acceptable region and represents a potential
negotiation point.
Denoted with
,1,…,,1,…,, the
actual response time in the k-th time slot of d-th day
with the assigned resource allocation plan, we define
the following parameter
, useful to represent
the performance degradation perceived by the
customer:
∆
,
∆
,
0
0,
0
,∀,∀.
(29)
When ∆
0,
has the best value, on the
contrary, it is at minimum level, but still acceptable,
when a maximum degradation level is reached.
Defining such level in a proportional way to T by
means of the factor deg,
assumes values
within [0, 1] within these two boundary cases
expressing it as the following normalized form of
:
1
∑∑
∆
.
(30)
For performance equal or better than the agreed one,
is 1, for a degradation level greater than the
maximum allowed,
becomes negative and
indicates a strong discontent level and, as a
consequence, a decrease of the provider reputation.
After a SLA negotiation request is received by a
provider, the negotiation strategy adopts the utility
model in order to take decisions and guide the
correct actions. While with the static approach the
utility model is evaluated una-tantum and is the
same for each request, adopting the dynamic
approach, the utility model is evaluated for each
request.
We conducted a comparative analysis assuming
fixed market conditions, a static utility model
evaluated with the workload plan {150 r/s, 250 r/s}
and SLA negotiation requests characterized by the
same contract validity period and different workload
plans.
Since the aim of our experimentation does not
focus on the evaluation of a negotiation strategy, we
simulate the final result of a negotiation process. In
particular, we analyze eight negotiation points
acceptable for the static utility model, called with
letters from A to H, obtained as follows:
- four response times within the acceptable
performance interval, positioned at 20%, 40%,
60% and 80% of the interval;
- for each response time, we consider two different
prices, positioned at 30% and 70% of the
respective acceptable price interval.
As it is possible to note in Figure 6, by varying
the workload plan of negotiation requests, a
negotiation point can be located inner or outer the
dynamic acceptable region, that means it is
considered respectively a feasible or unfeasible
agreement. The absolute error E (see (25)) adopting
the static and dynamic approach, varying the
workload plan, is reported in Figure 7. The
maximum E adopting the static utility is 1123.3 €,
the average error is 321 € and the standard deviation
is 277.6 €. On the contrary, the maximum E
adopting the dynamic utility is 39.4 €, the average
error is 9.9 € and the standard deviation is 12,31 €.
Such results show that the statically defined utility
can lead to incorrect utility provision for workload
plans both lighter and huger than the static plan and,
as a consequence, to low profits and, eventually, also
to low reputation levels. To better demonstrate this
statement, we report in Figure 8 the static and
dynamic utility under various workload plans and
label with !A the negotiation points defined by the
dynamic approach as not feasible agreements,
because outside the acceptable region.
When a SLA proposal has a workload plan
ExploitingCapacityPlanningofCloudProviderstoLimitSLAViolations
193
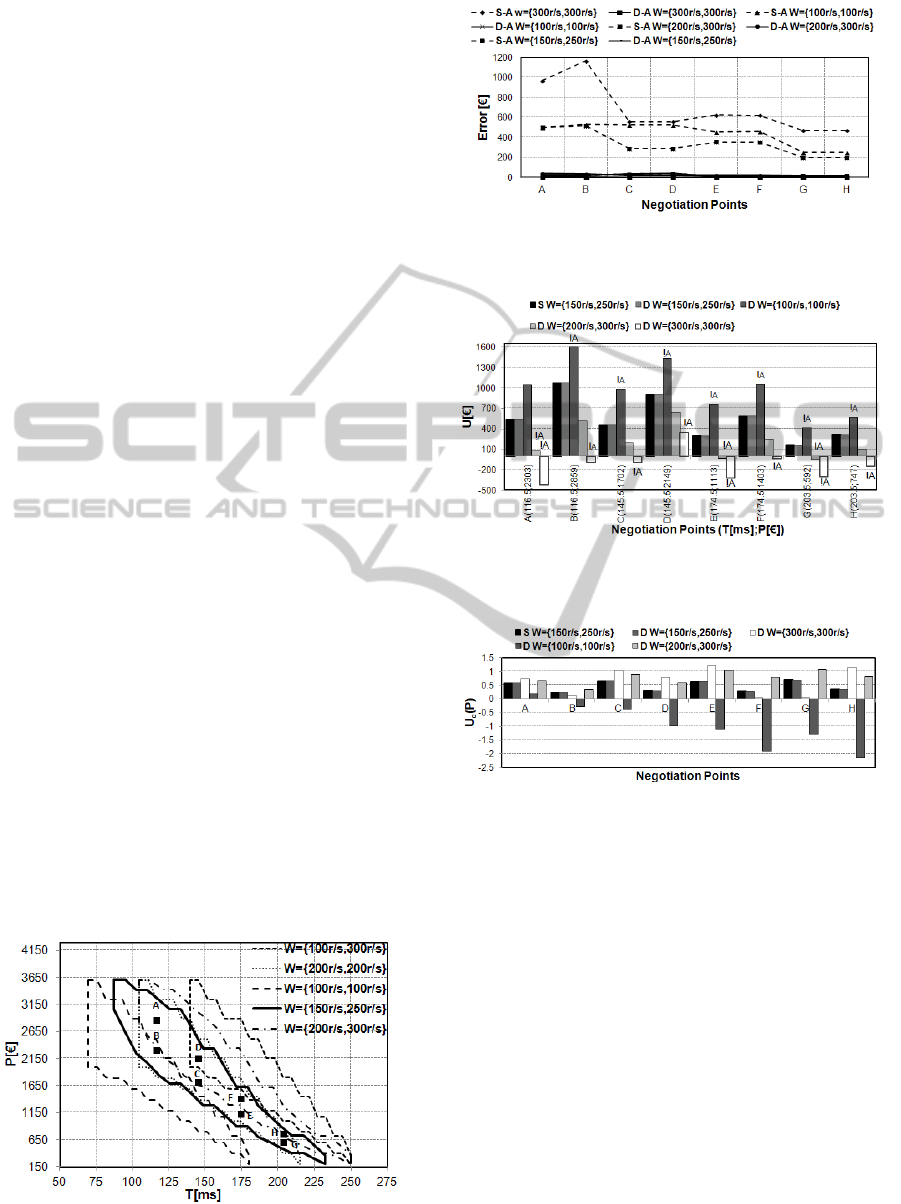
greater that the static one, the cost of the resource
allocation plan required to satisfy such workload is
under-estimated by the static approach, that foresees
a utility greater than the effective one. As an
example, for the workload plan {200 r/s, 300 r/s}
while for the static approach point E (174.5 ms,
1113 €) is within the acceptable region and has an
acceptable utility value of 296.3 € (always the same
varying the workload), for the dynamic approach
such point is outside the acceptable region and has a
negative utility of -38.15 € (too low price). As a
consequence, adopting the dynamic approach, point
E is not accepted as negotiation point, and the
negotiation strategy can decide to propose a counter-
offer or to stop the negotiation process. The same
problem is pointed out also for other points with
workload plans {200 r/s, 300 r/s} and {300 r/s, 300
r/s} (see Figure 8).
For huge workload plans, the dynamic approach
allows not only to avoid profit losses, but also
performance degradation when, in one or more time
slots, the number of available (or assigned)
resources is less than the one necessary to reach the
agreed response time. To demonstrate this statement,
we evaluated the response time-based indicator
U
C
(T) considering deg=0.1KD in (30), that
corresponds to an average tolerable performance
degradation of 10% with respect to the agreed one.
In the majority of cases, this indicator is one, that
means the customer will be totally satisfied. U
C
(T)
results at the limit value (zero) in two cases, in
particular for points A and B (with the lowest
response times), and with respect to the workload
plan {200 r/s, 300 r/s}. With huger workload plan,
(e.g. {300 r/s, 300 r/s}), such indicator becomes
negative, in particular it is -1.1 for points A and B. In
these cases, unlike the static approach, the dynamic
approach avoids profit loss and significant
reputation decrease, by positioning such points
outside the acceptable region.
Figure 6: Negotiation points and acceptable regions
related to different workload plans of negotiation requests.
Figure 7: Error E between the actual utility (A) and the
static (S) and dynamic (D) utility varying workload plan.
Figure 8: Static (S) and dynamic (D) utility varying
workload plan of negotiation requests.
Figure 9: Price-based indicator for static (S) and dynamic
(D) approach varying workload plan of negotiation
requests.
For workload plans lighter than the static one (e.g.
{100 r/s, 100 r/s}), the static approach estimates a
utility lower than the actual one. This, instead, for
some negotiation points can become greater than the
maximum allowed utility, since the customer is
required to pay a price too high with respect to the
required workload plan and greater that the
maximum allowed in the market conditions
(assumed fixed for the experimental analysis). This
happens because for the static approach the prices of
negotiation points refer to an acceptable region
related to a huge workload ({150 r/s, 250 r/s}), that
requires a more expensive resource allocation plan.
Differently from the static approach, this condition
is detected by the dynamic approach, that for
workload {100 r/s, 100 r/s} discards all the potential
CLOSER2013-3rdInternationalConferenceonCloudComputingandServicesScience
194

negotiation points from A to H by positioning them
outside the acceptable region. An approach that
proposes such negotiation points as feasible, can
lead to a high customer dissatisfaction.
Figure 9 presents the price-based indicator
varying the workload plan. The figure shows that for
workload plan {100 r/s, 100 r/s}
is always
negative because the customer is perceiving a too
high price for the required workload plan.
7 CONCLUSIONS
We exploited capacity planning to support Cloud
providers in bilateral automatic negotiation of high-
level QoS parameters and prices of PaaS services.
The technique aims at achieving high satisfaction
levels for both providers and customers. To this end,
we propose a heuristic approach for the dynamic
evaluation of a non-additive utility function and the
acceptable region that takes into account information
about application performance and the availability of
resources and a cost-based price model for
resources.
Through an experimental analysis we
demonstrate that the proposed solution leads the
provider to accurately predict the utility that can be
gained by a contract and to avoid the stipulation of
contracts under conditions that conduct to
unprofitable revenues or customer dissatisfaction.
Further research aiming to improve our approach
regards the investigation of a progressive resource
allocation policy based on the effective incoming
workload of hosted applications and their
performance in order to better exploit data center
resources.
Finally, we are investigating an integrative
negotiation strategy based on time-based decision
functions for the proposed utility model able to
quickly reach an agreement with high satisfaction
levels for both providers and customers.
REFERENCES
Abrahao, B., Almeida, V., Almeida, J., Zhang, A., Beyer,
D., Safai, F., Self-Adaptive SLA-Driven Capacity
Management for Internet Services, Proceedings of
IEEE Network Operations and Management
Symposium, 2006 (NOMS 2006), pp.557-568.
Allspaw, J. (2008), The art of capacity planning: scaling
Web resources. O’Reilly Media, Inc.
Almeida, J., Almeida, V., Ardagna, D., Francalanci, C.,
Trubian, M. (2006), Resource Management in the
Autonomic Service-Oriented Architecture,
Proceedings of IEEE Int. Conf. on Autonomic
Computing, 2006 (ICAC '06), pp. 84- 92.
Chase, J. S., and Anderson, D. C. (2001), Managing
energy and server resources in hosting centers,
Proceedings of the 18th ACM Symposium on
Operating Systems Principles, pp. 103-116.
Chhetri, M., Lin, J., Goh, S., Zhang, J., Kowalczyk, R. and
J. Yan (2006), A Coordinated Architecture for the
Agent-Based Service Level Agreement Negotiation of
Web Service Composition, Proceedings of. Australian
Software Eng. Conf. (ASWEC ’06), pp. 90-99.
Czajkowski, K., Foster, I., and Kesselman, C. (2005),
Agreement-based resource management, Proceedings
of IEEE, Vol. 93 No. 3, pp. 631–643.
Faratin, P., Sierra, C., Jennings, N. R. (1998), Negotiation
decision functions for autonomous agents, Robotics
and Autonomous Systems, Vol. 24, No. 3-4, pp. 159-
182.
Graupner, S., König, R., Machiraju, V., Pruyne, J., Sahai,
A. Moorsel, A. V. (2003), Impact of virtualization on
management systems, Hewlett-Packard Laboratories,
Tech. Rep. HPL-2003-125.
Li, H., Su, S., Lam, H. (2006), On Automated e-Business
Negotiations: Goal, Policy, Strategy, and Plans of
Decision and Action, Organizational Computing and
Electronic Commerce, Vol. 13 No. 1, pp. 1-29.
Liu, Z., Squillante, M. S., Wolf, J. L. (2001), On
maximizing service-level-agreement profits,
Proceedings of the 3rd ACM conference on Electronic
Commerce (EC '01). ACM, New York, NY, USA.
Raiffa, H. (1982). The art and science of negotiation.
Harvard University Press.
Spillner, J., Schill, A. (2009), Dynamic SLA Template
Adjustments Based on Service Property Monitoring,
Proceedings of IEEE Int. Conf. on Cloud Computing
(CLOUD '09), pp.183-189.
Macias, M., Guitart, J. (2010), Using resource-level
information into non-additive negotiation models for
Cloud Market environments, Proceeding of IEEE
Network Operations and Management Symposium
(NOMS 2010), pp.325-332.
Wu, L., Buyya, R. (2012), Service Level Agreement
(SLA) in utility computing systems. In V. Cardellini,
E. Casalicchio, K. Castelo Branco, J. Estrella, & F.
Monaco (Eds.), Performance and dependability in
service computing: concepts, techniques and research
directions, pp. 1-25.
Zulkernine, F. H., Martin, P. (2011) An Adaptive and
Intelligent SLA Negotiation System for Web Services,
IEEE Transactions on Services Computing, Vol. 4 No.
1, pp.31-43.
ExploitingCapacityPlanningofCloudProviderstoLimitSLAViolations
195
