
Cost and Risk Aware Support for Cloud SLAs
Ming Jiang
1
, James Byrne
2
, Karsten Molka
2
, Django Armstrong
1
, Karim Djemame
1
and Tom Kirkham
1
1
University of Leeds, Leeds, U.K.
2
SAP Next Business and Technology, SAP (UK) Limited, Titanic Quarter, Belfast, Northern Ireland
Keywords: Cloud Optimization and Automation, Cloud Risk, Economic Modelling, Cost Modelling, Challenges and
Governance, Monitoring of Services, Quality of Service, Service Level Agreements, Service Monitoring
and Control.
Abstract: Automated control of Cloud Service Level Agreements (SLA) is typically focused on Quality of Service
(QoS) management and monitoring of the Cloud Infrastructure in-line with the SLA. Using risk assessments
to bridge the needs of the Service Provider and Infrastructure Provider is one way in which the management
of the whole Cloud SLA life-cycle can be achieved automatically. In this paper we adapt the QoS based risk
approach and combine it with business orientated goal monitoring to improve the business input into the
management of SLA from both a Cloud IP and SP perspective. We demonstrate this approach using
probability of failure QoS risk linked to economic modelling of cost from the business goals of a SP.
1 INTRODUCTION
Service management during Cloud construction,
deployment and operation is largely guided by
Service Level Agreements (SLA) between the
Service Provider (SP) and Infrastructure Provider
(IP). The SLA captures what levels of service are
expected from each party in relation to the business
models being used. Failure of the SLA can result in
negative business consequence for either party.
Protecting the IP and SP from threats to the SLA
can be done using Risk Assessments. Risk
Assessments have roots outside of computing but are
standardized processes at judging the impact and
probability of an event (Institute of Risk
Management, 2009). In Cloud computing he use of
Risk Assessments has emerged from the
Computational Grid community and can be used to
negotiate the SLA on the basis of what levels of
service the parties are capable of providing
(Djemame et al., 2011). The management of
monitoring of Risk can enable either party to react to
potential threats to the SLA, which can be seen to
provide the SLA with a Risk Cushion reducing
chances of failure.
Within the Risk Assessment process a vital part
is the impact of specific events linked to the
requirements of either the IP or SP. To data analysis
of this impact has been largely been concerned with
technical requirements linked to Quality of Service
(QoS) characteristics in the SLA. From a
infrastructure as a service (IaaS) perspective the
measurements are detected directly from hardware
characteristics such as memory usage, processing
power and availability.
In this paper we expand on this QoS approach to
incorporate cost metrics from the SP perspective.
Risk assessments are developed to combine
monitored levels of QoS from the IP with Cost
impacts from the SP to produce a more business
driven approach to Risk management of the SLA.
2 RISK ASSESSMENT
Throughout the service lifecycle risk is calculated
using different inputs from a variety of perspectives.
2.1 Risk Assessment Phases
We propose that risk is considered during all phases
of the service lifecycle for the two stakeholders
(Service Provider (SP) and Infrastructure Provider
(IP)). The SP being the organization that presents a
service to the Cloud and the IP being the
207
Jiang M., Byrne J., Molka K., Armstrong D., Djemame K. and Kirkham T..
Cost and Risk Aware Support for Cloud SLAs.
DOI: 10.5220/0004377302070212
In Proceedings of the 3rd International Conference on Cloud Computing and Services Science (CLOSER-2013), pages 207-212
ISBN: 978-989-8565-52-5
Copyright
c
2013 SCITEPRESS (Science and Technology Publications, Lda.)

organization that provides the Cloud infrastructure
to the SP. SLAs negotiation between the SP and IP
span the service construction, deployment, and
operation phases of the Cloud lifecycle.
Risk assessments can be used to dynamically
monitor the IP and SP against the SLA, but they can
also be used to give greater support to Cloud
transformations. Such events include Cloud bursting
and Cloud brokerage activities where the IP changes
its topology often to support demands of the SP and
constraints of the SLA. Risk is vital for the proactive
operation of providers in a cloud ecosystem. The
treatment of risk must be performed at the service,
data, and infrastructure layers, and risk assessment is
performed at the following stages:
Infrastructure Provider Assessment: The SP,
before sending an SLA request to an IP,
assesses the risk of dealing with all known IPs.
Service Provider Assessment: An IP receives
an SLA request and assesses the risk of dealing
with the SP from which the request came from.
SLA Request Risk Assessment: The IP assesses
the risk of accepting the SLA request from the
SP, e.g. risk of physical hosts failing and
impact on current services.
SLA Offer Risk Assessment: The SP assesses
the risk associated with deploying a service in
an IP (entering an SLA with the IP).
SP Dynamic Risk Assessment: The SP
performs continuous risk assessment at service
operation, monitoring service level non-
functional Quality of Service (QoS) metrics
such as response time, availability of VMs.
IP Dynamic Risk Assessment: The IP performs
continual risk assessment at service operation,
monitoring low-level events from the
infrastructure such as risk of failure of physical
hosts/VMs, security, legal, and data
management risk.
The risk assessments are designed so they cover
both the IP and SP perspective on risk of the other
partner and also risk to themselves when interacting
in the Cloud. This 360 view on risk is specific to the
SLA and is how we propose the SLA can be better
protected from breaches.
2.2 Risk Assessment Calculation
In simple terms risk calculation is the probability of
a threat multiplied by its impact. Probability of
threats is calculated using both live and historical
data. In this paper we explain how we calculate the
risk of physical host failure during our different risk
assessment phases. Probabilities are expressed
between 0.1 and 1.0.
The impact of risk depends on the context of the
application and stages of execution at which it
applies. Measuring impact can be wide ranging and
is largely determined by the application environment
and requirements of the SP and IP in the SLA. Often
impact is pre calculated using domain expert
opinion.
In order to fit impacts into risk calculations they
are given a scale, we score our impacts between 1
and 10. In the scale 1 is the least impact and 10
highest impact. The final risk scores we calculate are
put into the standard risk score scale of 1-7. We
calculate this by converting the result of the risk
calculation into the scale of 1-7.
For the business process technically measureable
levels of QoS can be linked to cost for both the SP
or the IP. Expressing impact in terms of Cost has the
advantage of being a good bridge between technical
events and business realities. Whilst some Cloud
users may not understand the behaviour of the
technical infrastructure they will be able to
understand events expressed in terms of change in
cost.
The use of cost as a means by which to express
and compensate QoS reductions or SLA failures can
be seen in how the major commercial providers of
Cloud Solutions provide compensation upon SLA
breach (Amazon Web Services, 2013). These
breaches are focused on a measured reduction in
terms of quality of service. Finer grained costing of
fines are agreed in a similar way.
However, to date no mechanism exists to present
cost evaluations associated with SLA failure or SLA
renegotiation to both the SP or IP. The development
of such a tool will give both a different perspective
of risk in the cloud but also provide more accurate
assessments of the impacts of Cloud events in
relation to business process.
3 PHYSICAL HOST FAILURE
MODELLING
For our probability implementation of the risk
assessment we have routed our risk assessments in
the economic impacts of Physical Host failure risk.
An IP usually presents an associated availability
to the entity (SP or broker) it is negotiating an SLA
with. Most of commercial cloud providers such as
Amazon "guarantee" a service availability of 99% or
higher. This metric is related to a Probability of
CLOSER2013-3rdInternationalConferenceonCloudComputingandServicesScience
208

Failure (PoF), therefore a risk of service
unavailability.
In order to calculate PoF, gathering data relating
to past and current status of cloud resources is an
essential activity. Monitoring resource failures is
crucial in the design of reliable systems, e.g. the
knowledge of failure characteristics can be used in
resource management to improve resource
availability. Furthermore, calculating the risk of
failure of a resource depends on past failures as well.
3.1 Overview Approach
There are various events that cause a resource to fail.
Cloud resources may fail as a result of a failure of
one or more of the resource components, such as
CPU or memory; this is known as hardware failure.
Another event which can result in a resource failure
is the failure of the operating system or programs
installed on the resource; this type is known as
software failure. The third event is the failure of
communication with the resource; this is referred to
as network failure. Finally, another event is the
disturbance to the building hosting the resource,
such as a power cut or an air conditioning failure;
this type is event is known as environment failure.
Sometimes, it is difficult to pinpoint the exact cause
of the failure, i.e. whether it is hardware, software,
network, or environment failure; this is therefore
referred to as unknown failure.
The Time To Fail (TTF) of a physical host is
modelled as a life time random variable whose value
is always more than zero. Given the physical host
has been up until time t, the Probability of Failure
(PoF) of it during future time interval x is a
conditional probability P{X<=t+x|t}. In order to
calculate the P{X<=t+x|t}, the general methodology
is based on the following 5 steps:
Step 1: Collect observed historical data
representing TTFs;
Step 2: Find a probability distribution model of
TTF of the physical host by data distribution
fitting;
Step 3: Estimate the particular parameters of
the risk model by analysing the observations
on the physical host;
Step 4: Evaluate the distribution model by
comparing the risk model’s predictions based
on historical data and future observation data;
Step 5: Calculate P{X<=t+x|t} based on the
model with these parameters.
A total of 2.5 years (January 2010 - July 2012)
physical host failures historical data was provided by
Cloud Provider X for this paper.
3.2 Failure Data Gathering
A total of 2.5 years (January 2010 - July 2012)
physical host failures historical data was provided by
Cloud Provider X for this paper. A sample of
logging data physical host ID 10.0.2.10 is illustrated
in
Table 1: Sample logging data – physical host ID 10.0.2.10.
node_ip node_action node_log_timestamp node_log_note
10.0.2.10 Maintenance
2010-01-20
09:34:38.164117
Node is up
after an error
state
10.0.2.10 Recovery
2010-01-20
10:10:46.528909
Node cannot be
accesses doing
a live recovery
10.0.2.10 Recovery
2010-01-20
10:11:00.54699
Performing live
recovery
10.0.2.10 Maintenance
2010-01-25
14:14:57.861363
Node is up
after an error
state
A corresponding pair of 'Recovery' and ‘Node
cannot be accesses doing a live recovery ' means the
physical host is not contactable and the VMs
running on this host have to be migrated elsewhere.
A corresponding pair of 'Maintenance' and 'Node is
up after an error state' means the host is back again
(so repaired) and will await a manual decision to be
brought back into the resource pool.
4 IMPACT
Expressing the impact in terms of cost has the
advantage of being a good bridge between technical
events and business realities. Cloud computing
drives the rethinking of economic relationships
between an infrastructure provider and service
provider in terms of the services being provided.
Service Level Agreements (SLAs), which are
contracts between an infrastructure provider and a
service provider depend in general on certain chosen
criteria, such as service latency, throughput,
availability and security (Xiong et al., 2011). An
SLA typically includes penalty clauses that penalize
the infrastructure provider if it fails to execute the
jobs within quality of service (QoS) constraints or
requirements (McLarnon et al., 2010). The existence
of SLA penalty clauses enable the system to
maintain certain standards of services expected by
users. In the event that an IP fails to meet the
constraints contained within an SLA, a penalty is
typically paid out to mitigate the losses incurred by
CostandRiskAwareSupportforCloudSLAs
209

the user. Such a penalty clause in the SLA may
consist of the following (Rana et al., 2007):
A decrease in the agreed payment for using
the service, that is, a direct financial sanction.
A reduction in price to the consumer, along
with additional compensation for any
subsequent interaction.
A reduction in the future usage of the
provider’s service by the consumer.
Focusing on the economic implications, a
penalty will reduce infrastructure provider earnings.
In such cases, the earnings must be adjusted due to
lost revenue from compensation paid out.
Resource failures have a direct correlation with
service unavailability, leading to loss of revenue due
to financial sanctions and compensation agreed to in
the SLA penalty clauses. The economic impact of
such failure can be significant, even if the failure is
recovered from within a relatively short time period.
To give an example, a recent report covering 2007 to
2012 from press releases found that cloud service
unavailability across cloud service providers such as
Amazon and Microsoft showed an average of 7.5
hours per year with the cost of these failures
amounting to more than 70 million USDs based on
hourly costs accepted in industry (Gagnaire et al.,
2012). This cost would vary depending on the size
and scale of the company.
A modified SLA penalty model is proposed
which takes the risk of failure into account, see
Antonescu et. al, (2012). The impact of the risk of
failure of economic terms has been modelled taking
a typical SLA penalty clause such as this into
account, as follows:
∙
,,
,
(1)
,,
1
∙
,
(2)
,
1
1
0 1
(3)
With reference to the above cost models and to
Table 1, the penalty cost is calculated from an
accumulation of the predicted cost of services that
are hosted by an infrastructure provider which is
based on the risk of a service failing in one or more
future time periods. The penalty model from the
SLA is included as three separate penalty levels
based on a percentage of the overall price being
charged by an IP within the billing time period,
which is typical of a penalty clause included in an
SLA. Referring to equation 3, the service penalty
percentageρ
is highest of the 3 levels, down to the
lowest which is ρ
. This could be further modified to
include more penalty percentage levels. The service
specific availability percentage ε
represents the
highest percentage down to the lowest percentage of
0.
Table 2: SLA Penalty Cost Model Notations.
Symbol Explanation
Cost
Predicted cost of SLA penalty including
PoF
t
Monitoring interval
T Billing period
N
Number of services of SP
s
Service i
P
Price, that is charged per billing period
cost
Percentage of penalty that has to be
applied to cost of billing period
P
Percentage of service downtime within T
time
Predicts P
PoF
s,t
Probability of Failure of service s within
time interval t
ρ
Service specific penalty percentage
ε
Service specific availability percentage
Building a risk assessment from the PoF data and the
Cost calculations will use the derived Cost penalty
metric from the calculations above.
5 EVALUATION
The risk assessment approach using Cost and PoF
has been applied in the context of the EU
Framework 7 project OPTIMIS (Badia et al., 2011).
The Cost impacts were added to the Risk
Assessment process via the Risk Inventory. This
repository records threats and related vulnerabilities
or trigger events that can cause them. Thus, when a
IP is being monitored for events such as CPU level it
can be linked to possible risks. When the SLA is
negotiated the inventory is populated for the specific
instance of the Cloud runtime. This population
CLOSER2013-3rdInternationalConferenceonCloudComputingandServicesScience
210
involves the identification of risks and triggers in
relation to the SLA.
An example of the cost monitoring is the pricing
of energy in the data centre. This metric has been
used by the project to add the cost impact in terms of
energy cost upon SLA renegotiation or failure. In
both cases the final cost impact would not only
consist in change of energy prediction but also other
factors such as potential fine within the SLA.
In terms of Physical Host failure evaluation we
consider the empirical Cumulative Distribution
Function (CDF) of TTFs for each resource, as well
as how well it fits the probability distributions.
Maximum Likelihood Estimation (MLE) is used to
parameterise the distributions and thereby evaluate
the goodness of fit by visual inspection, and the
negative log-likelihood test.
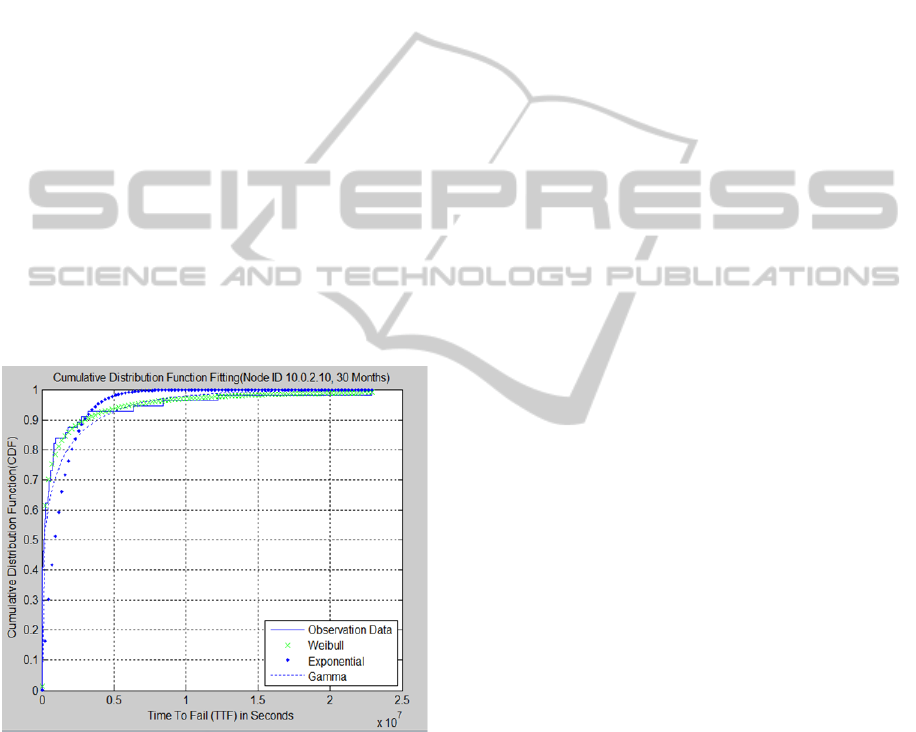
The CDF of TTFs observed over 30 months of
the entire past 2.5 years of physical host ID
10.0.2.10 fits well to the Weibull distribution with
the Distribution Fitting Tool, dfittool, of MATLAB
7.9.0.. The comparison of Exponential, Weibull, and
Gamma distributions curve fitting for Node ID
10.0.2.10 of 30 Months data is illustrated in Figure
1.
Figure: 1 Cumulative Distribution Function Fitting (Node
ID 10.0.2.10, 30 Months Historical Data.
In the figure the CDF of TTFs observed from
physical host ID 10.0.2.10 fits well to the Weibull
distribution. The shape parameter and scale
parameter of this particular Weibull distribution
instance is 0.3455 and 265000 respectively.
6 RELATED WORK
In creating a VM to host allocation algorithm that
considers the effect of existing SLAs and modelling
data, (Antonescu et al., 2012) have attempted to use
historical data to forecast infrastructure load in order
to select the allocation that produces the highest
profit contribution. In carrying this out, they have
created a system model which took SLA violation
and penalty cost into account.
In providing a control-theoretic solution to the
problem of dynamic capacity provisioning, Zhang et
al., (2012) attempts to minimise the total energy cost
while meeting the performance objective in terms of
task scheduling delay. Part of the work in doing this
was to adopt a simple penalty cost model for SLA
violation, whereby if the “delay bound” is violated,
there is an SLA penalty cost proportional to the
degree of violation.
Xiong et al., (2011) address the issue of how to
intelligently manage the resources in a shared cloud
database system and introduce a cost aware resource
management system. They provide a “weighted”
SLA penalty cost function where the weight denotes
a penalty when a database query misses a deadline.
Amongst other resource management work,
examples of work focusing on cost in the cloud from
a SLA perspective also exists in terms of energy use
(Beloglazov and Buyya, 2010) and profit
maximisation through resource allocation.
However, the related work covered here does not
specifically take the risk of failure into account
while modelling the SLA penalty cost. More work
on probability of failure can be seen in and its link to
risk has been explored in terms of recovery and risk
can be found here (Sangrasi and Djemame, 2012).
7 FUTURE WORK
The work on Cost and Risk will be expanded to
incorporate other forms of risk including VM failure
and Security/Legal risks in the Cloud. In addition the
OPTIMIS project is looking to integrate the factors
of eco-efficiency and Trust in a similar way to Cost
in the Risk Assessment process.
Central to this work is the definition of risks and
impacts in relation to the other factors and further
definition of cost factors. In many cases this data
will be tied to other sources such as markets and
would have to feed directly into the risk assessor.
Such an approach would make the calculations
around SLA management finer grained allowing
CostandRiskAwareSupportforCloudSLAs
211

more accurate usage of Cloud transformation
technologies such as Cloud Bursting. More work
also needs to be done on how the extra level of risk
refinement helps sustain the SLA. For this a series of
benchmarking studies leading on from the
probability of failure of physical host need to be
conducted.
Currently our impacts are driven by economic
modelling from a business perspective. In reality a
more user centric approach would be more realistic
as Clouds are increasingly adopted. In these cases
the monitoring and control over cost will have to be
developed in an easier to use and monitor way using
technology such as Dashboards. The user centric
tools would also aid further understanding of risk for
the user.
8 CONCLUSIONS
Although our method relies on a black box
orientated provider co-operation model for data
collection we have demonstrated a novel approach to
SLA management in the Cloud. By expanding a
inventory of risk to include economic/cost impacts
illustrates how risk can be used to combine SLA
impact with direct business consequence of SLA
failure. This offers a more understandable view on
risk to the human and finer-grained approach in
terms of risk management.
ACKNOWLEDGEMENTS
This work has been partially supported by the EU
within the 7th Framework Programme under
contract ICT-257115 - Optimized Infrastructure
Services (OPTIMIS).
REFERENCES
Amazon Web Services. (2013). Amazon EC2 Service
Level Agreement. Retrieved January 2, 2013, from
http://aws.amazon.com/ec2-sla/
Antonescu, A., Robinson, P., & Braun, T. (2012).
Dynamic SLA Management with Forecasting using
Multi-Objective Optimizations. cds.unibe.ch,
(September). Retrieved from http://cds.unibe.ch/
research/pub_files/ARB12.pdf
Badia, R. M., Corrales, M., Dimitrakos, T., Djemame, K.,
Elmroth, E., Ferrer, A. J., Forg, N., et al. (2011).
Demonstration of the OPTIMIS Toolkit for Cloud
Service Provisioning. (W. Abramowicz, I. M.
Llorente, M. Surridge, A. Zisman, & J. Vayssière,
Eds.)Lecture Notes in Computer Science including
subseries Lecture Notes in Artificial Intelligence and
Lecture Notes in Bioinformatics, 6994, 331–333.
doi:10.1007/978-3-642-24755-2_40
Beloglazov, A., & Buyya, R. (2010). Energy Efficient
Resource Management in Virtualized Cloud Data
Centers. Cluster, Cloud and Grid Computing
(CCGrid), 2010 10th IEEE/ACM International
Conference on (pp. 826–831).
Djemame, K., Armstrong, D., Kiran, M., & Jiang, M.
(2011). A Risk Assessment Framework and Software
Toolkit for Cloud Service Ecosystems. The second
International Conference on Cloud Computing,
GRIDS and Virtualisation (CLOUD COMPUTING
2011) (pp. 119–126).
Gagnaire, M., Diaz, F., Coti, C., Cerin, C., Shiozake, K.,
Yingjie, X., Delort, P., et al. (2012). Downtime
statistics of current cloud solutions (pp. 2–3).
Institute of Risk Management. (2009). The Risk
Management Standard. Retrieved January 2, 2013,
from http://www.theirm.org/publications/
PUstandard.html
McLarnon, B., Robinson, P., Sage, P., & Milligan, P.
(2010). Classification and Impact Analysis of Faults in
Automated System Management. 2010 Third
International Conference on Dependability, 182–187.
doi:10.1109/DEPEND.2010.34
Rana, O., Warnier, M., Quillinan, T. B., Brazier, F., &
Cojocarasu, D. (2007). Managing Violations in
Service Level Agreements. Usage of Service Level
Agreements in Grids Workshop, at IEEE/ACM Grid
Conference.
Sangrasi, A., & Djemame, K. (2012). Assessing risk in
Grids at resource level considering Grid resources as
repairable using two state Semi Markov model.
Digital Ecosystems Technologies (DEST), 2012 6th
IEEE International Conference on (pp. 1–6).
Xiong, P., Chi, Y., Zhu, S., & Moon, H. (2011). Intelligent
management of virtualized resources for database
systems in cloud environment. Data Engineering
(ICDE), 2011 IEEE 27th International Conference on,
87–98. Retrieved from http://ieeexplore.ieee.org/
xpls/abs_all.jsp?arnumber=5767928
Zhang, Q., Zhani, M. F., Zhang, S., Zhu, Q., Boutaba, R.,
& Hellerstein, J. L. (2012). Dynamic Energy-Aware
Capacity Provisioning for Cloud Computing
Environments Categories and Subject Descriptors.
ICAC’12.
CLOSER2013-3rdInternationalConferenceonCloudComputingandServicesScience
212
