
Comparison of Cloud Middleware Protocols and Subscription Network
Topologies using CReST, the Cloud Research Simulation Toolkit
The Three Truths of Cloud Computing are:
Hardware Fails, Software has Bugs, and People Make Mistakes
John Cartlidge and Dave Cliff
Department of Computer Science, University of Bristol,
Merchant Venturers Building, Woodland Road, Bristol BS8 1UB, U.K.
Keywords:
Cloud Computing, Simulation, CReST, Middleware Protocols, Subscription Network Topologies.
Abstract:
We introduce the Cloud Research Simulation Toolkit (CReST), a new cloud computing simulation tool de-
signed to enable cloud providers to research and test their systems before release. We compare CReST with
other known cloud simulation tools and demonstrate the utility of CReST by evaluating different distributed
middleware protocols and associated subscription network topologies for robustness and reliability. Our re-
sults extend previous work and demonstrate that the published literature contains inaccuracies. CReST has
been released as open-source under a Creative Commons license on SourceForge, with the intention that it can
be used and extended by the cloud computing research community.
1 INTRODUCTION
Windows Azure is a “Platform as a Service” (PaaS)
offering by Microsoft, enabling users to run cloud ap-
plications on the Azure platform. Cloud applications
consist of virtual machines (VMs) running through
a virtualisation manager, or hypervisor, on physical
servers in Microsoft data centres (DCs). “Clusters” of
approximately 1000 servers are independently man-
aged by platform middleware called the Fabric Con-
troller (FC). Each FC manages the lifecycle of ap-
plications running in its cluster, and provisions and
monitors the health of the hardware under its con-
trol. Applications run in VMs through the use of a
“guest agent” (GA) that Azure deploys into the OS
image of each application. Each server runs a “host
agent” (HA) that the FC leverages to deploy applica-
tion secrets (e.g., SSL certificates) to the GA, and to
“heartbeat” with the GA to determine VM health. At
VM initialisation, the GA generates a “transfer certifi-
cate” (including public key) that it issues to the HA to
enable secure communication of application secrets.
Transfer certificates are issued with one year validity,
using midnight UST of the current day as the valid-
from date and the valid-to date calculated by simply
adding one to the year. Erroneously, this “meant that
any GA that tried to create a transfer certificate on
leap day [2012] set a valid-to date of February 29,
2013, an invalid date that caused the certificate cre-
ation to fail.” (Laing, 2012). This is the “Leap Day
Bug”.
A GA will terminate when its certificate creation
fails. A HA has a 75 minute timeout for hearing from
a GA, after which it assumes that there is a hardware
problem and reports a fault to the FC. Upon receiv-
ing a fault report, the FC will set the server state
to Human Investigate (HI) and re-assign the failed
VMs to an available server elsewhere in the clus-
ter. When a GA initialises on a new server, the Leap
Day Bug will reproduce, causing the GA to terminate
once again. The result is a cascade of servers being
flagged as HI. On 29th February, 2012, such a failure
cascade forced Microsoft to disable service manage-
ment functionality in all clusters worldwide for more
than 10 hours while the bug was located and a suit-
able patch applied. A subsequent series of human er-
rors in the ensuing panic meant it was more than 34
hours before Azure was running at full service avail-
ability, prompting the Windows Azure Team to mark
their postmortem of the event with a fatalistic epitaph:
“The three truths of cloud computing are: hardware
fails, software has bugs, and people make mistakes”
(Laing, 2012).
The Leap Day Bug is a recent exemplar that high-
lights the incontrovertible problem faced by cloud
computing providers: running massively parallel and
58
Cartlidge J. and Cliff D..
Comparison of Cloud Middleware Protocols and Subscription Network Topologies using CReST, the Cloud Research Simulation Toolkit - The Three
Truths of Cloud Computing are: Hardware Fails, Software has Bugs, and People Make Mistakes.
DOI: 10.5220/0004377500580068
In Proceedings of the 3rd International Conference on Cloud Computing and Services Science (CLOSER-2013), pages 58-68
ISBN: 978-989-8565-52-5
Copyright
c
2013 SCITEPRESS (Science and Technology Publications, Lda.)

distributed platforms on heterogeneous hardware in
ultra-large scale data centres while maintaining ser-
vice level agreements (SLAs) under fluctuating user
demand is a complex, dynamic challenge that has no
simple solution. Exacerbating this situation, while
cloud provision has rapidly flourished in recent years,
there has been relatively little progress in the devel-
opment of robust simulation environments to aid in
the design and development of cloud solutions before
they are production-released. This is a risky game,
and one that traditional engineering principles tells
us is dangerous to play. Without a rigorous design
and test harness, cloud computing provision has dis-
concerting parallels with the largely trial-and-error
construction paradigm employed by architects of me-
dieval cathedrals.
In this paper, we argue for the importance of cloud
simulation tools and introduce the Cloud Research
Simulation Toolkit (CReST), a discrete event simula-
tion modelling tool for cloud provision. We compare
CReST with other available tools and demonstrate its
feature uniqueness. We then use CReST to explore a
problem known in the literature: the effect that differ-
ent distributed middleware protocols and component-
subscription network topologies have on the consis-
tency of components. In future, we hope to extend
this work in order to ask questions of the following
nature: if Azure used a different cluster topology and
a decentralised rather than centralised FC protocol,
what effect would it have had on the Leap Day Bug?
In Section 2 we review existing cloud DC simula-
tion models, before introducing CReST in Section 3.
In Section 4 we introduce the problem of component-
subscription network topologies and middleware pro-
tocols, and then present our results in Section 5. In
Section 6 we discuss our results and describe future
work, before concluding in Section 7.
2 CLOUD SIMULATION MODELS
Here, we review the small set of cloud computing
simulation tools that we have found to exist.
2.1 Fujitsu Laboratories
In October, 2011, Fujitsu Laboratories released a
press statement claiming to have developed “the
world’s first simulation technology that can instantly
test for changes in power consumption throughout a
datacenter . . . when operating status of servers or air-
conditioning equipment is altered” (Fujitsu Laborato-
ries, 2011). Fujitsu supported their development of
a proprietary simulation tool by saying: “It is im-
possible to directly perform tests—such as allocat-
ing server load or changing the number of running
servers in response to fluctuations in processing load,
or controlling air conditioning in response to server
utilisation and temperature—using an actual data cen-
tre. A promising alternative is to employ computer
simulations to check the impact of control measures”
(Fujitsu Laboratories, 2011). Results of simulation
led Fujitsu to claim that linking together the con-
trol of servers and air conditioning (AC) equipment–
specifically, at times of low demand, by keeping a
subsection of vincinal servers running at full load with
proximal AC in full operation, and other sections of
servers unloaded with proximal AC idled–may cut
overall datacenter power consumption by as much as
40% (Fujitsu Laboratories, 2011).
2.2 CoolSim
CoolSim is a CFD-based tool for optimising energy
consumption in a DC that combines airflow modelling
using the industry-leading ANSYS CFD solver with
a SaaS delivery model (CoolSim4, 2012). CoolSim
is a commercial product with three paid subscrip-
tion levels—from occasional use through to regular
thermal simulations on large data centres—starting at
$10,000. Applied Math Modelling Inc., the owners
of CoolSim, suggest the following use-cases: predict
cost savings resulting from DC modifications; deter-
mine maximum IT load and placement for a given
DC; perform a comparative analysis of cooling sys-
tem failure modes; and optimise the design of a new
or existing DC (CoolSim4, 2012).
2.3 CloudSim
Developed at the University of Melbourne, CloudSim
is an open source Java library/API that provides a
framework for modelling and simulation of cloud
computing infrastructures and services (Calheiros,
Ranjan, Beloglazov, Rose, & Buyya, 2011). “By
using CloudSim, researchers and industry-based de-
velopers can focus on specific system design is-
sues that they want to investigate, without getting
concerned about the low level details related to
Cloud-based infrastructures and services” (CloudSim,
2012). CloudSim leverages BRITE (Boston uni-
versity Representative Internet Topology gEnerator;
Medina, Lakhina, Matta, & Byers, 2001) to model
the network topology of a DC. A “.brite” file con-
taining network model description, including nodes
and edges, is read by CloudSim to configure the net-
work: the nodes section includes information about
ComparisonofCloudMiddlewareProtocolsandSubscriptionNetworkTopologiesusingCReST,theCloudResearch
SimulationToolkit-TheThreeTruthsofCloudComputingare:HardwareFails,SoftwarehasBugs,andPeopleMake
Mistakes
59

Table 1: Summary of main features of known cloud computing simulation modelling tools.
Name Type Virtualisation Network Physical GUI License Owner
CReST Java Application Yes Yes Yes (Simple) Yes Open Source University of Bristol
Fujitsu Application No No Yes (CFD) Yes Proprietory Fujitsu Laboratories
CoolSim SaaS No No Yes (CFD) Yes Subscription Applied Math Modelling Inc.
CloudSim Java Library/API Yes Yes No No Open Source University of Melbourne
SimGrid C Library/API Yes Yes No No Open Source INRIA, Sci. & Tech. Institute
the location of the node, in and out degree of the node
and the node type (router, switch, server, etc); while
the edges provide information about the source and
destination of the edge (length, propagation delay and
bandwidth). CloudSim has spawned a number of re-
lated projects, and results from CloudSim have pro-
duced at least 8 (correct as of 3rd Dec, 2012) aca-
demic publications (CloudSim, 2012).
Unlike Fujitsu’s application and CoolSim,
CloudSim is a function library/API and so cannot be
used “out of the box”. Hence, it must be extended
via Java classes to achieve a desired functionality.
Further, CloudSim does not have a graphical display
and does not model the DC at the physical level
(of hardware, heat and energy), but instead models
at a higher abstraction level of networking and
virtualisation (network connections, virtual machines
and services).
2.4 SimGrid
Written in C, with bindings for Java, Liu and Ruby,
SimGrid is an open-source library/API “that pro-
vides core functionalities for the simulation of dis-
tributed applications in heterogeneous distributed en-
vironments [to] facilitate research in the area of paral-
lel and distributed large scale systems, such as Grids,
P2P systems and clouds.” (SimGrid, 2012).
First released in 1999, SimGrid is now developed
and maintained at INRIA—France’s National Insti-
tute for Research in Computer Science and Control—
and has been used in a total of 119 academic jour-
nal articles, conference papers and PhD theses.
1
Yet,
from this lengthy publication list, only the confer-
ence paper by Caron, Desprez, Muresan, and Suter
(2012) is ostensibly related to cloud computing. This
is largely due to the fact that SimGrid, as the name
suggests, was originally designed to simulate grid
computing environments. Only relatively recently has
it been extended to accommodate a cloud computing
framework. Indeed, in the SimGrid reference manual,
the description of the virtual machine typedef, VM,
1
http://simgrid.gforge.inria.fr/Usages.html [Accessed
on 20th Jan 2013].
states: “all this is highly experimental and the inter-
face will probably change in the future”.
2
Like CloudSim, SimGrid enables cloud simula-
tion models to be built on top of a grid simulation
framework. Also like CloudSim, SimGrid: (i) is a
function library/API that models cloud data centres at
the level of networking and virtualisation rather than
the physical level; (ii) cannot be used “out of the box”;
and (iii) contains no GUI. For a summary compari-
son of all four platforms, refer to Table 1. For a full
technical description of SimGrid, refer to Casanova,
Legrand, and Quinson (2008).
3 CReST
The Cloud Research Simulation Toolkit (CReST)
was developed at the University of Bristol to ad-
dress the need for a robust simulation modelling tool
for research and teaching of DC management and
cloud provision. CReST is a stand-alone application,
written in Java, and is freely available open source
(CReST, SourceForge, 2012, GNU General Public
License version 3.0). Although alternative tools ex-
ist, CReST has a unique feature set, summarised in
Table 1, that enables simulation at multiple abstrac-
tion levels: from physical hardware, energy usage and
thermal flows within a DC, to networked infrastruc-
ture and the virtualisation layer of application services
supporting dynamic user demand.
3.1 Design
CReST is designed as a set of coupled “modules” that
can be independently switched on or off depending on
the level of abstraction required. Modules include:
Thermal. Heat generation, propagation and extrac-
tion within the DC.
Energy. Energy used by DC hardware.
Failures. Permanent & temporary hardware failures.
2
http://simgrid.gforge.inria.fr/simgrid/latest/ref guide/
html/group msg VMs.html [Accessed on 20th Jan 2013].
CLOSER2013-3rdInternationalConferenceonCloudComputingandServicesScience
60
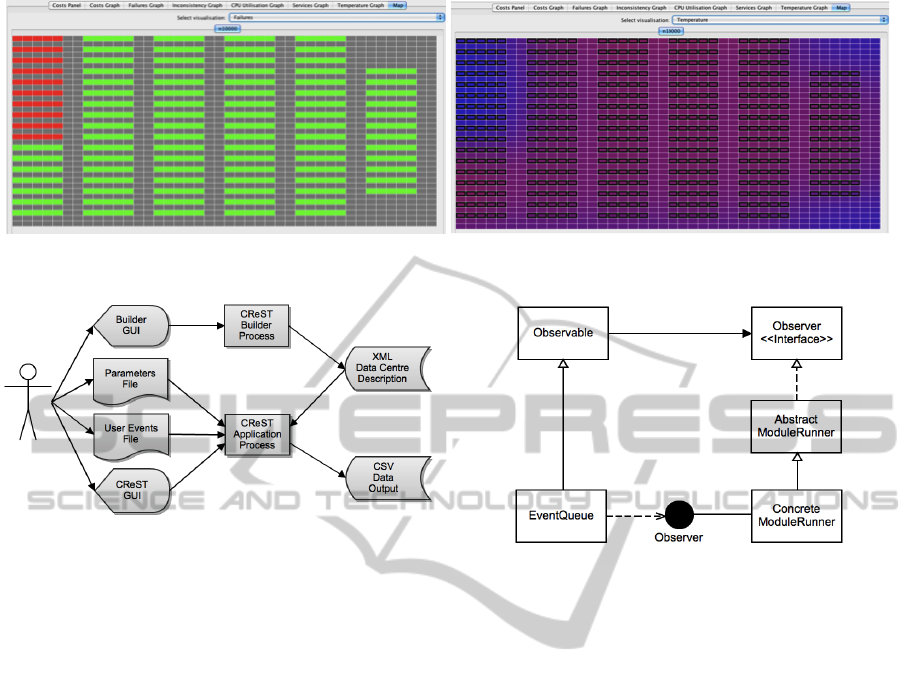
Figure 2: CReST screenshot of real-time GUI “map” display of a DC containing 10,000 servers. Left: “failures” view, with
loaded server-racks in green, failed server-racks in red and floor-space in grey. Right: corresponding “thermal” view of DC.
Figure 1: CReST architecture diagram.
Replacements. New hardware specifications.
Subscriptions. Middleware subscription network.
Services. Scheduling and allocation of VMs.
Pricing. Operational costs and pricing of services.
Demand. User demand and cloud brokerage.
UserEvents. User-defined events input via a text file.
GUI. Real-time display.
The flexible and extensible architecture of CReST en-
ables new modules to be added, and current modules
to be extended, as necessary.
3.2 Architecture
CReST is a discrete event simulation model that runs
as a stand alone application. A schematic of CReST’s
architecture, showing input and output, is presented
in Figure 1. To run CReST it is necessary to input
an XML configuration file containing a full hardware
specification of each CReST DC. CReST “Builder” is
a graphical application for creating and editing such
XML configuration files. CReST is also able to read
simulation parameters from an optional text “Param-
eters” file. Parameters in this file overwrite those du-
plicated in the XML file and offer a quick way for
users to edit a simulation configuration, or to run mul-
tiple simulations with varying configuration parame-
ters. Users can also input their own events via a “User
Figure 3: MVC architecture of modules. Each module has
a ConcreteModuleRunner object that extends the Abstract-
ModuleRunner class. The AbstractModuleRunner imple-
ments the Observer interface, which is used to receive each
new Event popped from the Observable EventQueue via the
Observer.update() method.
Events” file, a text file defining event type and time.
CReST may be run with or without a graphical inter-
face. In GUI mode, users are presented with run-time
visual feedback, such as the DC “map” view showing
failures, server load, and thermal flow (e.g., Figure 2).
All simulation data are logged to a set of CSV files—
one per “live” module—for postmortem analysis.
To ensure extensibility and module independence,
CReST has a Model-View-Controller (MVC) archi-
tecture. Following Figure 3, each module has a Mod-
uleRunner that views the EventQueue model using
Java’s Observer-Observable interface. Modules ob-
serve each Event popped from the EventQueue and
decide whether to ignore the event or take appropriate
action, which may involve generating new Events to
push onto the EventQueue. Thus, modules are inde-
pendent Observers of the EventQueue and only inter-
act via the Queue, ensuring strict delineation between
modules and making it possible to switch modules on
and off, delete modules and add new modules with
relative ease.
Each simulation constructs a World object that
contains one or more DC objects. Following the DC
design described in Barroso and H
¨
olzle (2009), each
ComparisonofCloudMiddlewareProtocolsandSubscriptionNetworkTopologiesusingCReST,theCloudResearch
SimulationToolkit-TheThreeTruthsofCloudComputingare:HardwareFails,SoftwarehasBugs,andPeopleMake
Mistakes
61

DC contains a List of (at least one) abstract Block
objects. Blocks are extended by 4 concrete types:
Aisle, Container, AirCon and Rack. Aisles and Con-
tainer objects contain a List of (at least one) Rack
objects. In turn, Rack objects contain a List of (at
least one) Server objects. Both Server and AirCon
objects implement the Failable interface, since they
represent hardware that can fail. Server objects con-
tain HardDisk, RAM and Software objects and a List
of (at least one) CPU objects. Servers can run Ser-
vice and VirtualMachine objects, which are started
and stopped via methods stop() and start().
All status updates on the World object are initiated
by Events generated by each ModuleRunner. Events
are pushed to the time-sorted EventQueue. When a
new Event is popped from the EventQueue, it per-
forms an action and then has the potential to gener-
ate new events, which it pushes back onto the Even-
tQueue; for example, a VMStart event at time, t, on
Server 6 will generate a VMStop event on Server 6 at
time t + ∆, where ∆ is the VM lifetime. Once an event
has “performed” and “generated”, it is then viewed by
each ModuleRunner. If a ModuleRunner is interested
in the event, then appropriate action is taken, other-
wise it is ignored; for example, upon observing the
VMStart Event on Server 6, the Energy module will
increase the energy usage of Server 6 based on the
attributes of the VM that has been started.
3.3 Middleware Subscriptions Module
Here, we detail the middleware subscriptions module
used to run the empirical experiments presented in 4
and 5. While this module, in isolation, has similar
characteristics to other more classic distributed sys-
tem simulators, it is the complex interaction between
modules that gives CReST its uniqueness; enabling
simulation of physical infrastructure, cloud services
and users in one toolkit. In this paper we aim to ver-
ify the utility of the middleware module by applying
it to a specific set of problems described in the liter-
ature. We reserve the more ambitious goal of explor-
ing the interactions between multiple cloud comput-
ing abstraction levels for future work.
The subscriptions module describes a communi-
cations network—a directed graph—between individ-
ual servers. Servers connect to a subset of other
servers that they periodically query for a “heartbeat”
status to see if they are “alive”. This enables servers
to have a view of which other hardware is available
to communicate. Within this framework it is pos-
sible for servers to have an “inconsistent” view of
other servers, for example, when Server A believes
Server B is “alive” when Server B is, in fact, “dead”;
Table 2: Summary description of network topologies.
Name Clustering Diameter Degree
Random Small Small K
Nearest Neighbour Very Large Large K
Grid Lattice Very Large Large K
Small World Large Small Mean = K
Scale Free Small Small Power Law
Klemm-Egu
´
ıluz (µ = 0.1) Large Small Power Law
or conversely, when Server A believes Server B is
“dead” when Server B is, in fact, “alive”. Inconsis-
tencies occur within the subscriptions network after
“ServerFail” or “ServerFix” Events. The percolation
of inconsistencies is determined by the network topol-
ogy and communications protocol. The subscriptions
module is designed to compare the efficacy of differ-
ent topology-protocol pairings.
The subscriptions module pre-defines a set of
topologies and protocols, described below. When ac-
tivated, the subscriptions module generates a commu-
nications network across a data centre, with each node
corresponding to an individual server. The Subscrip-
tionsModuleEventThread generates SubscriptionUp-
dateEvents that cause nodes to query the status of
other nodes. When a ServerFail or ServerFix Event
is popped from the EventQueue, the Subscriptions-
ModuleRunner observes the Fail/Fix Event and up-
dates the status of the corresponding network node
to dead/alive. The proportion of inconsistent nodes
is plotted as a time-series graph on the GUI (if ac-
tive) and logged to the “subscriptions log” CSV file.
Other event types observed by the SubscriptionsMod-
uleRunner are ignored.
3.3.1 Network Topologies
For reference, Table 2 summarises the salient features
of each network topology, described below.
Random: server nodes are connected at random to
exactly K other nodes. A Random network topol-
ogy has a small clustering coefficient (i.e., few
neighbours of a node are themselves neighbours)
and a small diameter (i.e., the average path length
between any two nodes is small).
Nearest Neighbours: nodes are arranged in a 1D cir-
cular array, with each attached to the K nearest
neighbours. This topology has a large clustering
coefficient and large diameter.
Regular Grid-Lattice: nodes are arranged on a
toroidal grid/lattice network structure and then
subscribed to their K nearest neighbours. This ar-
CLOSER2013-3rdInternationalConferenceonCloudComputingandServicesScience
62

rangement has a large clustering coefficient and
large diameter, similar to Nearest Neighbours.
Watts-Strogatz (Small World): nodes are con-
nected using an implementation of the Watts-
Strogatz algorithm to generate a “Small World”
network (Watts & Strogatz, 1998). Small World
networks have a large clustering coefficient and
small diameter; and are obtained by departing
from a regular lattice, randomly rewiring links
with probability p 1. Networks created in this
way display a degree distribution sharply peaked
around the mean value, K.
Barab
´
asi-Albert (Scale Free): nodes are connected
using an implementation of the Barab
´
asi-Albert
algorithm that generates a “Scale Free” network,
where the distribution of the node degree is scale-
free, i.e., it decays as a power law (Barab
´
asi &
Albert, 1999; Albert & Barab
´
asi, 2002). The ab-
sence of a typical scale for the connectivity of
nodes is often related to the organisation of the
network as a hierarchy. Scale Free networks have
a small clustering coefficient and small diameter.
Klemm-Egu
´
ıluz (Scale Free/Small World): nodes
are connected using an implementation of the
Klemm-Egu
´
ıluz algorithm that utilises a “mixing”
parameter, 0 ≤µ ≤ 1, to generate a topology with
properties that vary between Small World (µ = 0)
and Scale Free (µ = 1). At some intermediate
values, e.g., µ = 0.1, the network has a large
clustering coefficient and small diameter, while
maintaining a scale-free distribution of node
degrees (Klemm & Egu
´
ıluz, 2002).
3.3.2 Protocols
Simple Peer-to-Peer (P2P): nodes communicate
with each other directly using a peer-to-peer
protocol, requesting the status (alive/dead) of
connected nodes.
Transitive Peer-to-Peer (TP2P): nodes communi-
cate with each other directly using a peer-to-peer
protocol in a similar fashion to the simple P2P
protocol. However, nodes also pass information
about the status of other nodes that are mutually
connected. This protocol generates fewer status
requests than simple P2P, but has the side effect
that “stale” information may percolate across the
network (if node A receives information from
node B about the status of node C that is “out of
date”). This protocol is taken from Sriram and
Cliff (2010a).
Centralised: a (small set of) central node(s) period-
ically requests status information from all other
nodes in the network. Individual nodes then query
the central node for status information of other
nodes, rather than querying those nodes directly.
Revisiting Microsoft Azure’s Platform as a Service,
we can consider the Fabric Controller (FC) as mid-
dleware with a Centralised protocol, since the host
agent (HA) of each node within a Cluster commu-
nicates directly with the Cluster’s FC, rather than
with another HA directly. The network topology of
each Cluster may take different forms, depending on
the scheduling (and migration) algorithm that the FC
uses—while the FC is likely to begin by issuing ap-
plication VMs using a Nearest Neighbour topology,
over time the network structure is likely to morph
into a less regular topology as applications spawn new
VMs and failing VMs are migrated. In the following
section, we review the literature on scalable middle-
ware and propose some empirical experiments using
CReST to replicate and extend this work.
4 MIDDLEWARE RESILIENCE &
SCALEABILITY
“A system is scalable if it can be deployed effectively
and economically over a range of different “sizes”,
suitably defined” (Jogalekar & Woodside, 2000). It
is well understood that centralised control systems do
not scale well: as a DC grows in scale, middleware
that uses a centralised protocol will see an increase in
latency, caused by bottlenecking of network commu-
nications, and increased risk of single-point failure.
To circumvent these problems, distributed protocols
offer an attractive alternative; removing the possibil-
ity of single-point failure and decreasing the traffic
congestion at any one node. However, as Isard (2007)
states, distributed middleware can lead to “inconsis-
tency” between networked components:
Where information needs to be shared be-
tween components in a distributed system,
there is often a choice between designs that
allow weak consistency and those that require
strong consistency. Weak consistency can im-
prove availability, since one component may
be able to operate for a while from cached
data when another is unavailable. However,
strong consistency often allows simpler de-
signs. (p. 3)
Inconsistency can occur when applications on differ-
ent machines are configured differently, or are run-
ning different versions of software; particularly likely
ComparisonofCloudMiddlewareProtocolsandSubscriptionNetworkTopologiesusingCReST,theCloudResearch
SimulationToolkit-TheThreeTruthsofCloudComputingare:HardwareFails,SoftwarehasBugs,andPeopleMake
Mistakes
63

to happen when a new software patch or upgrade is
rolled out. Inconsistency can also occur when hard-
ware fails and is no longer “available” (see Torell &
Avelar, 2011, for a discussion of “availability” ver-
sus “reliability” of hardware). “Traditionally, reliable
systems have been built on top of fault-tolerant hard-
ware. The economics of the contemporary comput-
ing industry dictate, however, that the cheapest way
to build a very large computing infrastructure is to
amass a huge collection of commodity computers”
(Isard, 2007). In essence, fault-tolerance has moved
from hardware to software, making failure a “normal”
event that has to be managed efficiently (so called
“normal failure”, an extension of the concept “normal
accident” expounded by Perrow, 1999). Referring to
hardware failures at Google, Miller (2008) states:
In each cluster’s first year, it’s typical that
1,000 individual machine failures will occur;
thousands of hard drive failures will occur;
one power distribution unit will fail, bring-
ing down 500 to 1,000 machines for about 6
hours; 20 racks will fail, each time causing 40
to 80 machines to vanish from the network;
5 racks will “go wonky” with half their net-
work packets missing in action; and the clus-
ter will have to be rewired once, affecting 5
percent of the machines at any given moment
over a 2-day span [. . . ] And there’s about a 50
percent chance that the cluster will overheat,
taking down most of the servers in less than 5
minutes and taking 1 to 2 days to recover.
Sriram and Cliff (2010a) used a simulation model to
empirically compare the resilience and scalability of
different middleware protocols in a large scale DC ex-
periencing normal failure such that, at any given time,
some proportion of the DC hardware is unavailable.
They compared three middleware protocols (Hierar-
chical, P2P and TP2P) under a selection of network
topologies and demonstrated that:
1. inconsistencies grow with DC size;
2. subscription topology has no significant effect on
P2P and hierarchical protocols; and
3. under TP2P protocol, there is a direct relation be-
tween the clustering coefficient of the subscription
topology and inconsistency in the network.
As an extension, Sriram and Cliff (2010b) went on
to show that a “hybrid” network topology contain-
ing a mix, µ = 0.2, of Small World and Scale Free
features produces less network inconsistency than a
Small World (µ = 0) or Scale Free (µ = 1) topology.
The authors concluded that, under TP2P protocol:
4. inconsistencies fall as the path lengths drop. “This
contradicts our previous belief that the transitivity
caused the higher levels of inconsistencies” (Sri-
ram & Cliff, 2010b).
We believe these results are interesting and deserve
further investigation. Hence, we perform a series of
empirical experiments, using CReST, to replicate and
extend the work of Sriram and Cliff (2010a, 2010b).
4.1 Experimental Design
CReST was used to explore the scalability and re-
silience of cloud middleware under different messag-
ing protocols and network topologies. To do this, we
ran a series of empirical experiments using CReST’s
Subscriptions Module, pairing each Protocol with
each Topology (18 P-T pairings). All other modules
were switched off, apart from the UserEvents Module
which was used to input a series of server hardware
failures at a specific time. Each P-T pairing was tested
under the following conditions:
• number of servers, S ∈ {100, 1000, 10000};
• mean number of subscriptions, K ∈ {10, 30, 100};
• number of failures, F ∈ {10, 100, 500, 1000}; and
• failure type, T ∈ {random, correlated}.
Each run, a UserEvents file was generated to input a
set of hardware failures at time, t, where t was drawn
from a Uniform distribution with limits 5 and 15 sec-
onds. Under random failure type, servers were se-
lected randomly from the DC, whereas for correlated
failures, a contiguous block of IP addresses was se-
lected at random. Since IP addresses in CReST are
determined by server location, correlated failures oc-
cur within a localised neighbourhood (e.g., same rack,
or same aisle). The network is continually monitored
for inconsistency and three measures are recorded:
• maximum proportion of the DC that becomes in-
consistent, MAX INCON;
• time until the DC becomes consistent, T IME; and
• total load on the DC network, LOAD.
Each condition was repeated between 10 and 30
times, with mean and 95% confidence intervals taken.
CReST simulations lasted one simulated minute.
5 RESULTS & ANALYSIS
For all graphs presented here, we plot mean ±95%
confidence interval for each protocol, representing
TP2P as green triangles, P2P as red squares, and
Centralised as blue circles. On the x-axis, the net-
work topologies are labelled using the mapping: SF =
Barab
´
asi-Albert (Scale Free), KE = Klemm-Egu
´
ıluz,
CLOSER2013-3rdInternationalConferenceonCloudComputingandServicesScience
64
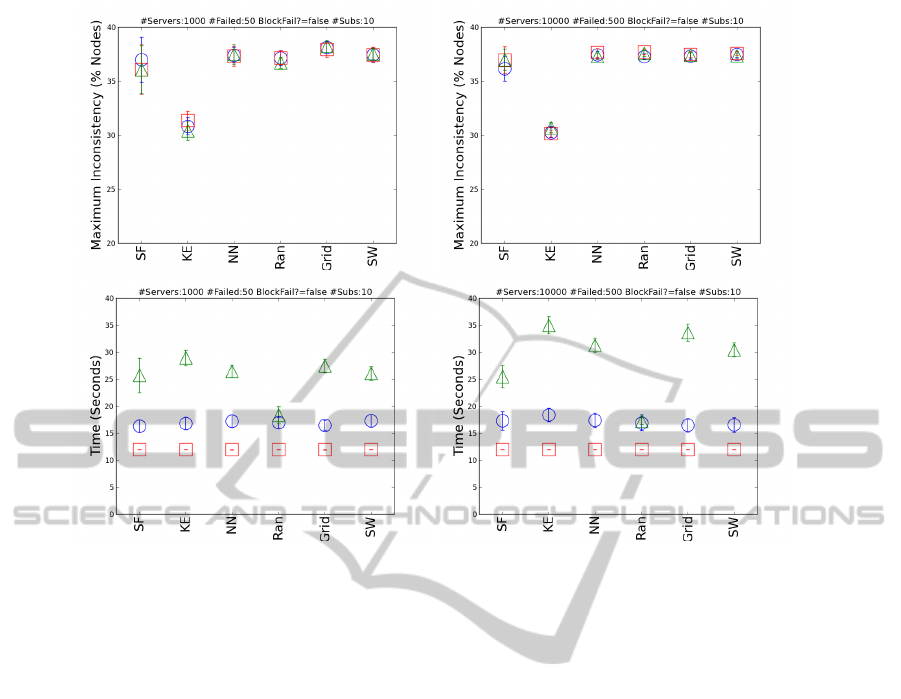
Figure 4: Mean ±95% C. I. for each protocol, with TP2P as green triangles, P2P as red squares, and Centralised as blue
circles. Maximum network inconsistency (top) and time to consistent (bottom) for DCs with 1,000 servers (left) and 10,000
servers (right) subject to a 5% random hardware failure event.
NN = Nearest Neighbours, Ran = Random, Grid
= Regular Grid-Lattice, and SW = Watts-Strogatz
(Small World). Further, all graphs present results of
Klemm-Egu
´
ıluz with mixing parameter µ = 0.11.
Figure 4 shows the effects of scaling on the
protocol-topology pairings when 5% of servers fail
randomly. The top row displays the maximum in-
consistency in the network at any given time, and the
bottom row displays the time until the network be-
comes consistent once again. In the left column we
have a DC with 1,000 servers, in the right column a
DC with 10,000 servers. It can clearly be seen that
maximum inconsistency, top, is invariant to DC size
for all protocols. However, the relationship for time to
consistent, bottom, is more complicated. For P2P and
Central, time to consistent does not vary with DC size.
However, for the TP2P protocol, there is a significant
increase in time to consistent for topologies: KE, NN,
Grid, and SW. From Table 2, it can be seen that these
are the four topologies with the highest clustering co-
efficients. Hence, the likelihood is that inconsistency
in the TP2P protocol is sensitive to scaling when the
underlying network topology has a high clustering co-
efficient. As the clustering coefficient increases, there
is more likelihood of passing on “stale” information
about a mutual “neighbour”. Further, as the size of
the network increases, the number of opportunities to
pass on stale information also increases, resulting in
an overall increase in network inconsistency. It should
be noted that the value of maximum inconsistency for
KE is an obvious outlier. Possibly, this is a results
of the beneficial features of KE described by (Sriram
& Cliff, 2010b). However, at this stage, until more
analysis is completed, we remain cautious about this
datum.
In Figure 5, we see four graphs comparing the ef-
fects of random failure (left column) with correlated
failure (right column) when 1% of servers in a DC of
10,000 servers fail. For each network, mean subscrip-
tions K = 100. It is clear that correlated failure has
a significant affect on network inconsistency. Unsur-
prisingly, when failure is correlated, topologies with
a high clustering coefficient suffer the least network
inconsistency across all protocols (top row). When
considering time to consistent (bottom row), although
P2P and Centralised are unaffected by topology or
correlated failures, TP2P is significantly affected by
both. Once again, for TP2P, time to consistency un-
der correlated failure is often quicker when clustering
coefficients are high (however, there are some excep-
tions to this rule, such as Ran and Grid).
One reason that NN recovers much more quickly
than Grid may be because the NN topology fits the un-
derlying physical topology more closely (i.e., servers
ComparisonofCloudMiddlewareProtocolsandSubscriptionNetworkTopologiesusingCReST,theCloudResearch
SimulationToolkit-TheThreeTruthsofCloudComputingare:HardwareFails,SoftwarehasBugs,andPeopleMake
Mistakes
65
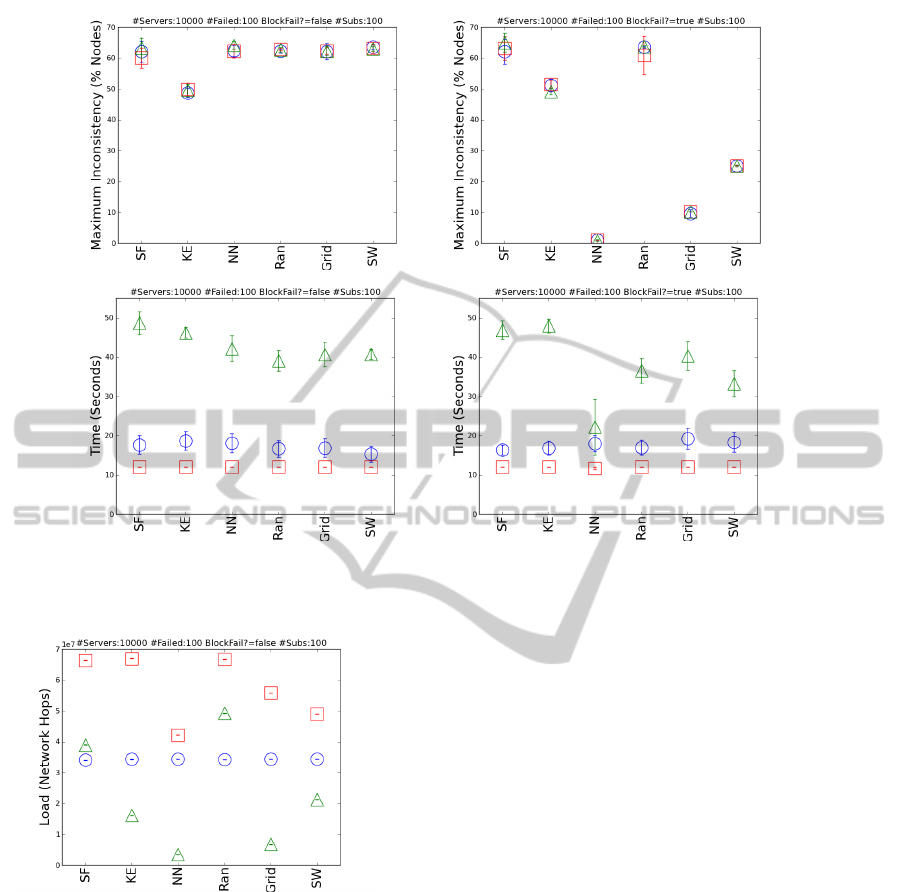
Figure 5: Mean ±95% C. I. for each protocol, with TP2P as green triangles, P2P as red squares, and Centralised as blue
circles. Maximum network inconsistency (top) and time to consistent (bottom) for DCs with 1,000 servers subject to 1%
random failure (left) and 1% correlated failure (right).
Figure 6: Mean network load ±95% C. I. for each proto-
col, with TP2P as green triangles, P2P as red squares, and
Centralised as blue circles.
are more likely to subscribe to other servers in the
same rack). This is a similar effect to that observed by
Cartlidge and Sriram (2011), who noticed a resilience
sensitivity to particular scheduling algorithms when
the scheduled/software network directly fits the un-
derlying hardware network.
Figure 6 displays network load under each
protocol-topology pairing. As may be expected, load
is not affected by failure rate and failure type (not
shown), but is affected by protocol and topology. Fig-
ure 6 plots the network load for a DC containing
10,000 servers and network subscriptions K = 100.
Intuitively, we see that the load produced by the Cen-
tralised protocol is invariant under topology. How-
ever, the load of P2P and TP2P does vary with topol-
ogy, with high clustering coefficients tending to pro-
duce lower load. The ordering of the topologies,
based on load, is largely invariant, except for KE and
SW under the TP2P protocol. Interestingly, when
subscriptions, K, is small, KE load is greater than
SW load, however, as K increases, KE load increases
more slowly than SW, until SW eventually has greater
load (for example, in Figure 6, where K = 100). The
KE topology has an intriguing scaling behaviour that
is unlike the other topologies. We intend to investigate
this further to determine whether or not this effect is
real, or an artefact of our design.
6 DISCUSSION
In Section 4, we listed four findings from the literature
(Sriram & Cliff, 2010a, 2010b). Here, we discuss our
results from Section 5 in the context of each finding.
Finding 1: inconsistencies grow with DC size
(Sriram & Cliff, 2010a). We have shown (Figure 4)
that DC size has no significant effect on inconsisten-
cies when using the Central and P2P protocols. Fur-
ther, when using the TP2P protocol, inconsistencies
CLOSER2013-3rdInternationalConferenceonCloudComputingandServicesScience
66

only increase with DC size when the network topol-
ogy has a high clustering coefficient. Hence, we be-
lieve that finding 1 is an artefact of experimental de-
sign and not a real phenomenon. From our results (not
shown), we have evidence that the time to consistency
increases with the number of subscriptions, K, under
both random and correlated failure. Also, it should
be noted that Sriram and Cliff (2010a) automatically
scale the number of subscriptions, K, with DC size, n,
such that K =
√
n. Thus, we believe that finding 1 is
incorrect: our evidence suggests that inconsistencies
grow with subscriptions, K, and not DC size, n.
Finding 2: topology has no significant effect of
P2P and centralised (hierarchical) protocols (Sriram
& Cliff, 2010a). When considering consistency, for
the set of protocol-topology pairings used by Sriram
and Cliff (2010a), we agree with this finding. How-
ever, in Figure 6, we have shown that topology has a
significant effect on the network load of P2P. Hence,
finding 2 is not completely accurate. However, we be-
lieve this to be a refinement, rather than a refutation,
of finding 2.
Finding 3: for TP2P, there is a direct relation be-
tween the clustering coefficient of the subscription
topology and inconsistency in the network (Sriram &
Cliff, 2010a). In Figure 4 we presented evidence to
support this finding. Further, we extended this finding
by observing the impact of correlated failures (Fig-
ure 5). Interestingly, when hardware failures are cor-
related, rather than random, the inverse of finding 3
holds true: topologies with higher clustering coeffi-
cients produce less network inconsistency. The rea-
son for this is intuitive: when a topology is highly
clustered, a failure in one region of the network is
unlikely to affect many other regions of the network.
This can be most clearly seen in the top-right graph
of Figure 5, where a 1% correlated failure in a Near-
est Neighbour topology produces little over 1% net-
work inconsistency—i.e., nearly 99% of the network
is unaffected. Compare this with Random and Scale-
Free topologies, where more than 50% of the network
becomes inconsistent upon failure. Intriguingly, how-
ever, despite also having a very high clustering co-
efficient, the Grid topology produces a significantly
longer period of inconsistency than NearestNeigh-
bour. The reason for this is that the NearestNeigh-
bour topology more tightly matches the underlying
hardware topology, an effect similar to that previously
identified by Cartlidge and Sriram (2011).
Finding 4: inconsistencies fall as the path lengths
drop (Sriram & Cliff, 2010b). As recognised by the
authors, this result is in slight contradiction to finding
3: “This contradicts our previous belief that the tran-
sitivity caused the higher levels of inconsistencies”
(Sriram & Cliff, 2010b). In the work presented here
we have not replicated this finding directly. Yet, we
have presented some intriguing findings regarding the
KE network that we are currently unable to explain.
It is our intention to perform further work in this area
in order to tease out the relationship between network
diameter, clustering, and inconsistencies, particularly
in relation to the KE network.
7 CONCLUSIONS
We have introduced the Cloud Research Simulation
Toolkit (CReST)—a discrete event simulation mod-
elling tool for cloud provision—and demonstrated its
unique feature set when compared with other com-
mercially and freely available alternative tools. We
used the “Subscriptions Module” of CReST to run a
series of experiments to evaluate the performance—
scalability with respect to “consistency”—of different
communication protocols and network topologies in a
distributed middleware platform. Our results replicate
and extend a set of experiments from the literature to
test the findings therein. Demonstrating the efficacy
of CReST, we were able to draw the following new
conclusions:
1. network inconsistency grows with the average
number of network subscriptions and not with
data centre size, as was previously published;
2. network topology has a significant effect on the
network load of peer-to-peer (P2P) protocols; and
3. for transitive peer-to-peer (TP2P) protocols,
topologies with higher clustering coefficients pro-
duce less network inconsistency when failures are
correlated, and more network inconsistency when
failures are non-correlated;
We aim to continue extending CReST so that we
have a powerful, versatile platform, capable of solv-
ing real-world problems in simulation before software
is released into production. Hopefully this will enable
cloud providers to avoid cascading middleware failure
such as the “Leap Day Bug” which, on 29th Febru-
ary, 2012, caused Microsoft to disable service man-
agement functionality in all Azure clusters worldwide
for more than 10 hours and reduce service availability
for more than 34 hours, while the bug was located and
a suitable patch applied.
ACKNOWLEDGEMENTS
Particular thanks goes to all the LSCITS undergrad
ComparisonofCloudMiddlewareProtocolsandSubscriptionNetworkTopologiesusingCReST,theCloudResearch
SimulationToolkit-TheThreeTruthsofCloudComputingare:HardwareFails,SoftwarehasBugs,andPeopleMake
Mistakes
67

uate interns that helped to develop the CReST plat-
form: Luke Drury, Sarah Haswell, James Laverack,
Callum Muir, and Alex Sheppard. John Cartlidge is
supported by EPSRC grant number EP/H042644/1;
primary financial support for Dave Cliff’s research
comes from EPSRC grant number EP/F001096/1.
REFERENCES
Albert, R., & Barab
´
asi, A.-L. (2002). Statistical mechanics
of complex networks. Rev. Mod. Phys., 74(1), 47–
97.
Barab
´
asi, A.-L., & Albert, R. (1999). Emergence of scaling
in random network. Science, 286, 509–512.
Barroso, L. A., & H
¨
olzle, U. (2009). The datacenter
as a computer: An introduction to the design of
warehouse-scale machines. Synthesis Lect. Comput.
Archit., 4(1), 1–108. http://bit.ly/2mggRO.
Calheiros, R. N., Ranjan, R., Beloglazov, A., Rose, C. A.
F. D., & Buyya, R. (2011). Cloudsim: A toolkit for
modeling and simulation of cloud computing envi-
ronments and evaluation of resource provisioning al-
gorithms. Software: Practice and Experience (SPE),
41(1), 23–50.
Caron, E., Desprez, F., Muresan, A., & Suter, F. (2012).
Budget constrained resource allocation for non-
deterministic workflows on an IaaS cloud. In Proc.
12th Int. Conf. Algorithms & Architectures for Par-
allel Processing, ICA3PP, pp. 186–201 Fukuoka,
Japan. Springer.
Cartlidge, J., & Sriram, I. (2011). Modelling resilience in
cloud-scale data centres. In Bruzzone, A. G., Piera,
M. A., Longo, F., Elfrey, P., Affenzeller, M., & Balci,
O. (Eds.), Proc. 23rd European Modeling & Simula-
tion Symposium, EMSS-2011, pp. 299–307 Rome,
Italy. Univ. Genoa Press. http://bit.ly/YvPuCC.
Casanova, H., Legrand, A., & Quinson, M. (2008). Sim-
grid: a generic framework for large-scale distributed
experiments. In Proceedings of the Tenth Interna-
tional Conference on Computer Modeling and Sim-
ulation, UKSIM ’08, pp. 126–131 Washington, DC,
USA. IEEE Computer Society.
CloudSim (2012). A framework for modeling and simula-
tion of cloud computing infrastructures and services.
http://www.cloudbus.org/cloudsim/.
CoolSim4 (2012). Applied Math Modeling Inc. [Home-
page] http:// www.coolsimsoftware.com/.
CReST, SourceForge (2012). Owner: John Cartlidge. http://
cloudresearch.sourceforge.net.
Fujitsu Laboratories (2011). Fujitsu laboratories develops
world’s first datacenter simulator for promptly pre-
dicting the total energy consumption and evaluating
energy-saving control of datacenters, 13/10/2011.
http://bit.ly/nDraIg.
Isard, M. (2007). Autopilot: automatic data center manage-
ment. SIGOPS Oper. Syst. Rev., 41(2), 60–67.
Jogalekar, P., & Woodside, M. (2000). Evaluating the scal-
ability of distributed systems. IEEE Transactions on
Parallel and Distributed Systems, 11(6), 589–603.
http://bit.ly/UDX5Lm.
Klemm, K., & Egu
´
ıluz, V. M. (2002). Growing scale-free
networks with small-world behavior. Phys. Rev. E,
65, 057102, 1–4.
Laing, B. (2012). Summary of Windows Azure service dis-
ruption on Feb 29th, 2012. MSDN Windows Azure
Team Blog, 09/03/12. http://bit.ly/AfdqyL.
Medina, A., Lakhina, A., Matta, I., & Byers, J. (2001).
BRITE: Universal topology generation from a user’s
perspective. User manual BU-CS-TR-2001-003,
Boston University. http://bit.ly/SDQW15.
Miller, R. (2008). Failure rates in google data centers,
30/05/2008. [Blog] http://bit.ly/SJItI3.
Perrow, C. (1999). Normal Accidents: Living with High
Risk Technologies (2 edition). Princeton University
Press.
SimGrid (2012). Versatile simulation of distributed sys-
tems. http://simgrid.gforge.inria.fr/.
Sriram, I., & Cliff, D. (2010a). Effects of component-
subscription network topology on large-scale data
centre performance scaling. In Calinescu, R., Paige,
R., & Kwiatkowska, M. (Eds.), Proc. 15th IEEE Int.
Conf. Eng. Complex Comp. Systems, ICECCS-2010,
pp. 72–81 Oxford, UK. http://bit.ly/YLic1m.
Sriram, I., & Cliff, D. (2010b). Hybrid complex network
topologies are preferred for component-subscription
in large-scale data-centres. In Proc. 2nd Work. Com-
plex Networks, CompleNet-2010, pp. 130–137 Rio,
Brazil. Springer. http://bit.ly/TA5rQU.
Torell, W., & Avelar, V. (2011). Mean time between fail-
ure: explanation and standards. White paper 78, rev.
1, Schneider Electric - Data Center Science Center.
http://bit.ly/hOR5t3.
Watts, D., & Strogatz, S. H. (1998). Collective dynamics of
“small-world” networks. Nature, 393, 440–442.
CLOSER2013-3rdInternationalConferenceonCloudComputingandServicesScience
68
