
Outdoor Lighting Design Process Optimization
Igor Wojnicki, Adam Sedziwy and Leszek Kotulski
AGH University of Science and Technology, Department of Applied Computer Science,
Al. Mickiewicza 30, 30-059 Krakow, Poland
Keywords:
Smart Lighting, Lighting Design, Outdoor Lighting, Control System, Optimization.
Abstract:
Outdoor lighting design process is based on trial and error approach. It takes considerable effort and time.
Furthermore, since the process involves several software components, some errors might be introduced which
make it even worse. It is proposed than to optimize it by automating transitions among selected stages. As
a result, there is a prototype software component implemented. It integrates photometric calculations with
photo-realistic rendering. Applying it greatly improves the design process and increases interactivity with the
designer.
1 INTRODUCTION AND
MOTIVATION
Outdoor lighting design is a multistage process which
results in precise information regarding light point
distribution and characteristics (S˛edziwy and Kozie
´
n-
Wo´zniak, 2012). It is interdisciplinary, involving ar-
chitects, lighting engineers, and designers. The re-
sulting design should comply with both aesthetics and
formal requirements (e.g. street lighting regulations).
Emerging technologies, as LED, turn out to be
game changers by extending light point capabilities.
Light point parameters can be precisely designed to
give appropriate light stream characteristics prevent-
ing overexposure – potential overexposure leads to
increased energy consumption thus reducing it con-
serves energy and decreases CO
2
emission.
A LED light point can be precisely controlled.
While standard luminaries provide up to a few power
states, LED based solutions deliver hundreds of them.
It gives very fine grained control over power con-
sumption and dynamic light stream distribution. Hav-
ing well designed light point distribution, multiple
light point power levels, sensors, and communica-
tion enable intelligent control (Wojnicki and Kotulski,
2012).
An analysis of software environment supporting
lighting design process is discussed below. Theoreti-
cal background supporting effectively the considered
problem, has already been established. Some exper-
iments regarding software solution have been com-
pleted.
The research is part of the Green AGH Campus
project (Szmuc et al., 2012) targeting emerging appli-
cations of Smart Grid solutions. The proposed light-
ing design process optimization and further intelligent
lighting control serve as test cases.
2 LIGHTING DESIGN PROCESS
The lighting design process is started by a lighting
designer or architect. Spatial and compositional as-
sumptions regarding the architectural space are made
resulting in conceptual sketch. These include light
point distribution and lighting effects taking into ac-
count aesthetics. The design at this stage is very in-
formal, see Fig.1. Usually some sketching software is
being used such as Google SketchUp. It represents a
general view of the scene with light points indicated
and their general parameters in terms of light cones.
It is manly to identify where the light points should
be and where the actual light should go.
Then the sketch is transformed into a two or three
dimensional (2D, 3D) technical drawing (Fig. 2) re-
sulting in a spatial concept, a wire-frame. This al-
lows to precisely specify places which are to be il-
luminated, color, temperature, quality and other pa-
rameters of a lighting composition. The drawing is
performed by a supporting software such as AutoCad,
ArchiCad, Revit or other.
A next step, verification, is performed by a light-
ing engineer. Luminaries and intensities of light
sources are selected, according to the assumptions
231
Wojnicki I., Sedziwy A. and Kotulski L..
Outdoor Lighting Design Process Optimization.
DOI: 10.5220/0004379202310234
In Proceedings of the 2nd International Conference on Smart Grids and Green IT Systems (SMARTGREENS-2013), pages 231-234
ISBN: 978-989-8565-55-6
Copyright
c
2013 SCITEPRESS (Science and Technology Publications, Lda.)
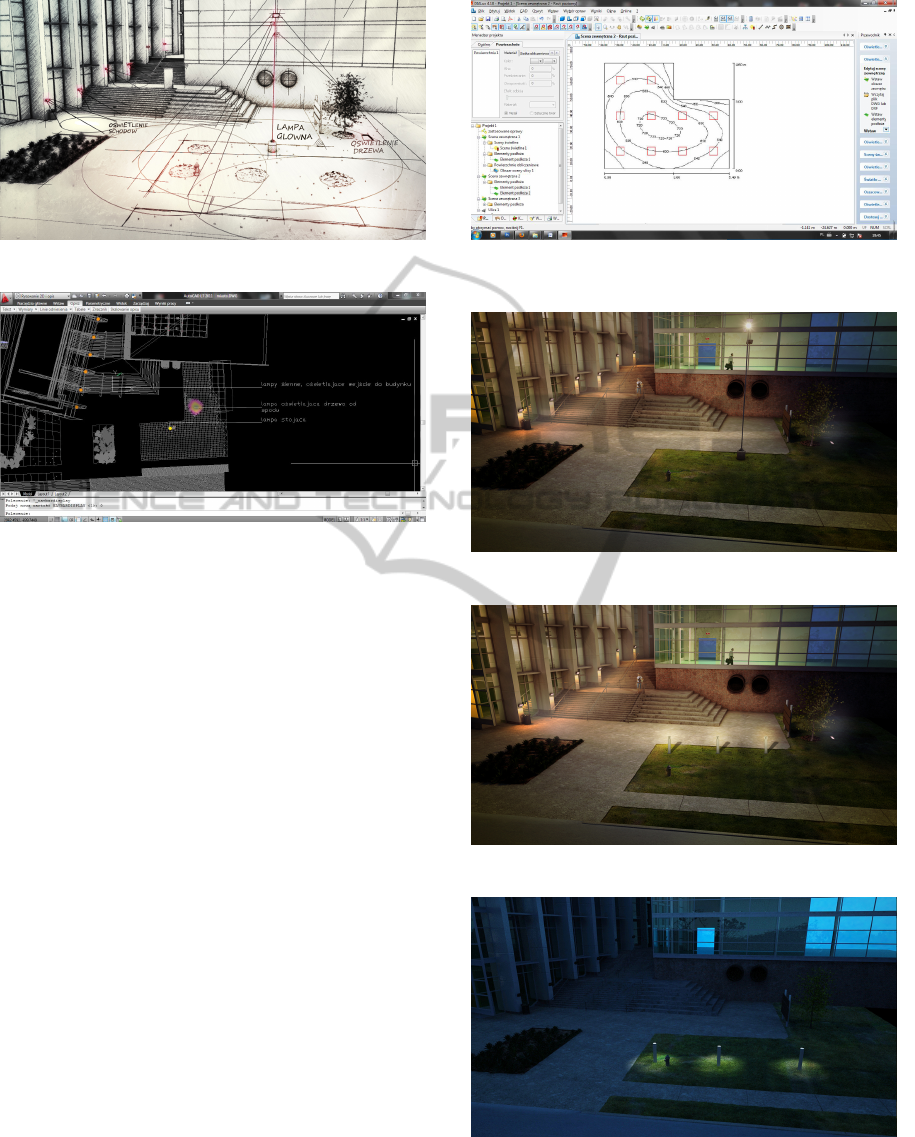
Figure 1: Conceptual sketch.
Figure 2: Spatial concept.
provided by the designer. Furthermore, they are ver-
ified using photometric software (Dialux, Calculus,
Ulysse or similar) if technical capabilities of luminar-
ies meet requirements of the project. This phase im-
pacts number, power and detailed specifications of the
luminaries. Since the technical drawing (wire-frame)
can contain multiple elements not influencing photo-
metrics, it has to be tuned accordingly or even created
from very beginning.
Next the parameters calculated in the previous
stage are given to the lighting designer to prepare
three dimensional (3D), photo-realistic visualization
(see Fig. 4), a 3D model. It also supported by yet
another software (e.g. 3ds Max, Maya). A final ef-
fect is analyzed. If it does not satisfy the designer it
is adjusted accordingly (see Fig. 5) and the process
is looped back to the spatial concept (wire-frame) or
verification (Photometric calculations) stages. Based
on the adjustments of the 3D model the results from
previous steps need to be updated. These steps
are performed iteratively until satisfying results are
achieved, being a trial and error process.
Optionally alternative 3D models can be created
providing visualization under different lighting con-
ditions (see Fig. 6, low light conditions). Once again,
if it does not suit the designer the process loops back.
Since each stage is isolated some errors or artifacts
can be introduced unwillingly in the process. Com-
paring Fig. 5 and Fig. 6 it can be noticed that the lamp
Figure 3: Verification of a concept against technical con-
straints.
Figure 4: 3D visualization.
Figure 5: 3D visualization, corrections.
Figure 6: 3D visualization, power saving mode.
poles are at different locations. This leads to inconsis-
tences and lengthens the entire process.
SMARTGREENS2013-2ndInternationalConferenceonSmartGridsandGreenITSystems
232
3 DESIGN PROCESS
OPTIMIZATION
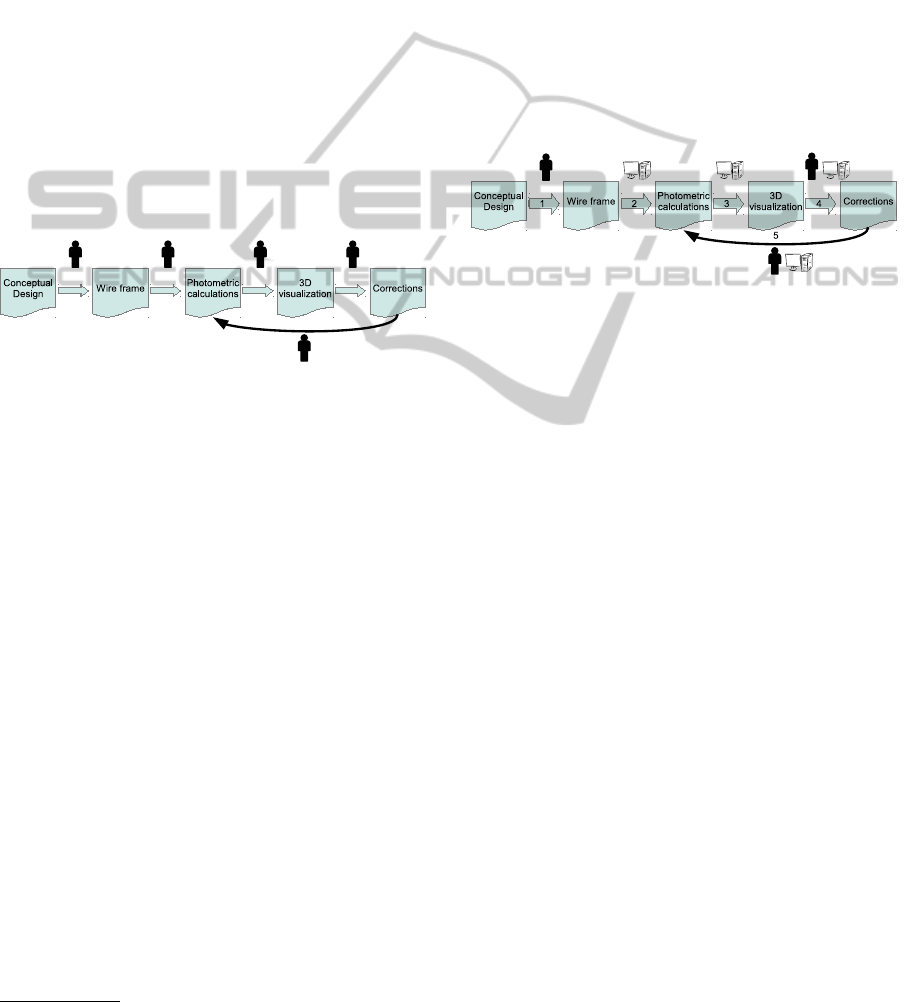
The design process described earlier is showed in
Fig. 7. It needs to be pointed out that there is lack
of automation between subsequent stages. Data pro-
duced as a result of the conceptual stage need to be
interpreted and recreated as a wire frame model and
so on. Human interactions are required for transiting
data between subsequent stages. Some support from
the editing tools is given. Data import/export capabil-
ities make it easier but still it is tedious and subject to
mistakes.
The most problems are caused by the looping over.
It is taking the corrections of the 3D model and feed-
ing them back to the verification and adjustments
(photometrics) stage. Multiple iterations, to achieve
a satisfying result, might cause even more mistakes
and elongate the entire process.
Figure 7: Design process.
It is proposed then to reduce number of human in-
teractions. It is achieved through the following steps:
1. automated data translation among different tools,
2. simplified interaction scheme,
3. automated selection and testing of performance
parameters.
Step one is to unify data interfaces among appli-
cations to ensure proper import and export. It is to au-
tomate this process to rule out human factor as much
as possible. Data flow among applications should be
provided with minimal human interactions. It can be
achieved through utilizing API
1
built into considered
applications (e.g. SketchUp, AutoCAD, Calculux,
Maya). Alternatively, if provided API is not suitable
or non existing, given application should be replaced
by software which provides one.
Step two, which is the simplified interaction
scheme, assumes that entire design process should be
presented to the users as a single environment rather
than separate cooperating applications. Switching
from the conceptual design to wire frame, or going
into photometrics or visualization should be perceived
as different perspectives of a single design.
1
Application Programming Interface
Finally, the most error causing part, which is ap-
plying corrections, should be as interactive as possi-
ble. It should also provide optimization and anima-
tion features to better understand and perceive the de-
sign, simultaneously verifying if all the light point pa-
rameters are within the assumed range. Optimization
criteria such as energy consumption reduction, public
safety increase, overexposure elimination should also
be considered.
The resulting process, taking into considerations
the above proposal, is given in Fig. 8. The main fo-
cus regards the loop, which is transitions: 3, 4 and 5.
It covers photometric calculations, 3D visualizations,
and applying corrections to the design, which require
recalculations in turn. Automation of transitions is in-
dicated accordingly (compare with Fig. 7).
Figure 8: Design process, desired state.
As a proof of concept a prototype tool has been
implemented. It is an extension to Maya rendering
and animation software. It mainly improves transi-
tion 3 by integrating photometric calculations with the
rendering engine. This extension is showed in Fig. 9
in action. The scene consists of a flat urban area with
four lamp posts. At each lamp post there is a luminary
(a light point) with given parameters. While the ren-
dering engine shows how the scene would look like
photo-realistically, the photometric engine indicates
underexposed and overexposed regions (underexpo-
sure at the outer rim).
Furthermore, the proposed extension is capable
of calculating and optimizing luminary parameters,
minimizing or maximizing given criteria function
e.g. power consumption, public safety, overexposure
etc. It can also optimize number of light points or
their distribution, proposing corrections to the design.
The presented solution is highly interactive. While
changing light point parameters, the over and under-
exposure is interactively calculated and visualized in
real time. There is no need to switch back and forth
between photometric calculation tool and 3D visual-
ization one any more.
Since the photometrics is integrated into the 3D
visualization it is feasible to guard proper data import
from the wire-frame stage. It is indicated as an au-
tomated transition 2 in Fig. 8. It prevents a situation
of e.g. misplacing the light points which takes place
in Fig. 5 and 6. Since, the photometric extension is
capable of rearranging the light points, thus changing
OutdoorLightingDesignProcessOptimization
233
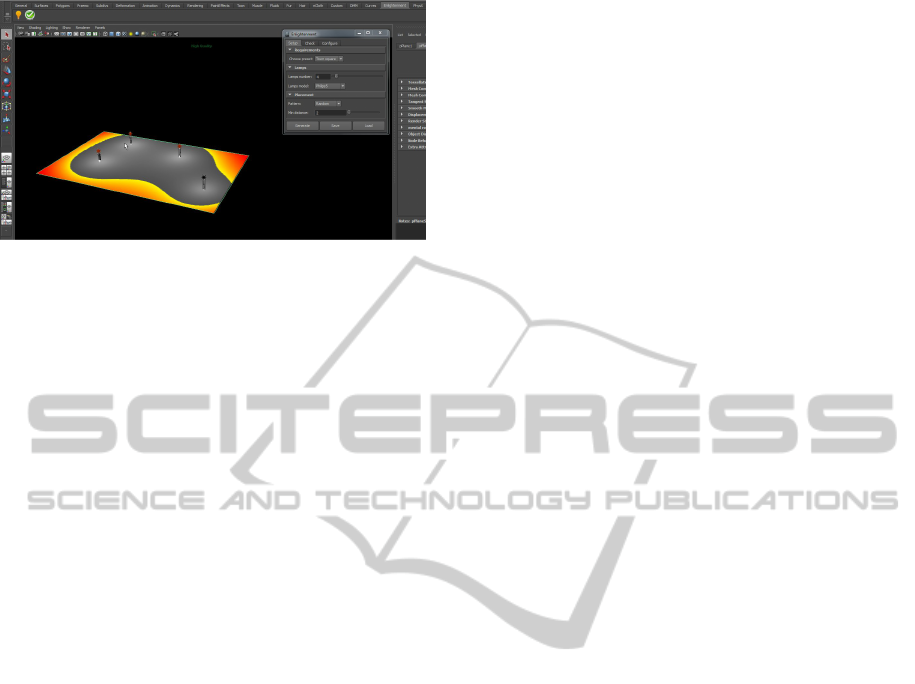
Figure 9: A prototype tool integrating photometric calcula-
tions with a rendering and animation software.
the wire-frame objects, the wire-frame model, can be
also updated automatically.
4 SUMMARY AND FUTURE
WORK
Summarizing, actual lighting design process is based
on trial and error approach. There are certain difficul-
ties identified:
• design process involves several incompatible
tools,
• numerous variants of the design need to be tested
manually.
The proposed solution reduces effort and time by au-
tomating selected operations, enhancing data migra-
tion among various software components and inte-
grating them.
A prototype software component integrating pho-
tometric calculations and 3D visualization is pro-
posed. It automates selected parts of the process.
Time and effort reduction are observed. It also min-
imizes probability of human errors which take place
during transitions among tools.
Further work focuses on perfecting the proposed
integration. Design optimization extension is needed
which finds light point parameters complying with
given optimization criteria. The proposed extension
could also be capable of assisting the user and sug-
gesting changes to the design according to the pro-
vided criteria e.g. power consumption optimization,
public safety increase, total or partial cost optimiza-
tion, to automate the process even more.
The proposed design process can be also inte-
grated with intelligent outdoor lighting control sys-
tem (Wojnicki and Kotulski, 2012). Such integration
enables verification of the design under dynamically
changing lighting conditions against aesthetic vision
of the designer. The verification can be performed
by the 3D rendering software after successful integra-
tion with a simulator of the before mentioned control
system. The result would be a complete, interactive
animation of the scene being designed.
It needs to be mentioned that the optimization pro-
cess regarding light point parameters results in combi-
natorial explosion of the state-space. To compensate
formal graph-based methods, tools, and algorithms
are used (S˛edziwy and Kozie
´
n-Wo´zniak, 2012). They
fully utilize parallel and distributed computations,
and agent-based approaches (S˛edziwy and Kotulski,
2011).
REFERENCES
Szmuc, T., Kotulski, L., Wojszczyk, B., and Sedziwy, A.
(2012). Green agh campus. In Donnellan, B., Lopes,
J. A. P., Martins, J., and Filipe, J., editors, SMART-
GREENS, pages 159–162. SciTePress.
S˛edziwy, A. and Kotulski, L. (2011). Solving large-scale
multipoint lighting design problem using multi-agent
environment. Key Engineering Materials, 486:197–
182.
S˛edziwy, A. and Kozie
´
n-Wo´zniak, M. (2012). Com-
putational support for optimizing street lighting de-
sign. In Zamojski, W., Mazurkiewicz, J., Sugier, J.,
Walkowiak, T., and Kacprzyk, J., editors, Complex
Systems and Dependability, volume 170 of Advances
in Intelligent and Soft Computing, pages 241–255.
Springer Berlin Heidelberg.
Wojnicki, I. and Kotulski, L. (2012). Controlling complex
lighting systems. In Zamojski, W., Mazurkiewicz, J.,
Sugier, J., Walkowiak, T., and Kacprzyk, J., editors,
Complex Systems and Dependability, volume 170 of
Advances in Intelligent and Soft Computing, pages
305–317. Springer Berlin Heidelberg.
SMARTGREENS2013-2ndInternationalConferenceonSmartGridsandGreenITSystems
234
