
Wireless Network Deployment as Low Cost Building Management
System Solution
Liam Moore
1
, Mike Hayes
1
, Brendan O. Flynn
1
, Cian O. Mathuna
1
, Emmanuel Frecon
2
,
Joakim Ericksson
2
, Peeter Kool
3
, Peter Rosengren
3
, Alberto Fernandez
4
, Jacek Rosik
5
and Donagh MacSuibhne
6
1
The Tyndall National Institute, Cork City, Ireland
2
The Swedish Institute of Computer Science, Stockholm, Sweden
3
CNET, Stockholm, Sweden
4
Sensing and Control, Barcelona, Spain
5
ResourceKraft., Limerick, Ireland
6
ARUP, Cork, Ireland
Keywords: Wireless Sensor Network, 6LoWPAN, BMS, Retrofit, Middleware.
Abstract: This paper presents the design and implementation of a wireless monitoring and actuation network for
residential and commercial buildings that was carried out as part of the ARTEMIS funded project ME3gas.
The aim of this deployment is to demonstrate that low cost wireless sensor networks can be used in
situations where a full building management system may not be suitable technically or commercially either
in residential home applications or commercial enterprises. This work focuses not just on electricity
consumption but also on gas consumption into the building. The current deployment consists of a number of
wireless sensor motes retrofitted throughout a residential building converted for office use. The WSN nodes
are based on the Tyndall modular mote platform running the Contiki operating system and communicating
with a mesh network running IPV6 through 6LoWPAN over IEEE 802.15.4 at 2.4GHz. Each node is
configured for a specific task within the framework of enabling energy efficiency and these tasks can be
broadly described as, environmental sensing, metering (gas and electricity) and actuation. The motes are
controlled through the LinkSmart middleware platform which is an open source hardware agnostic system
for building energy management, which hides the underlying physical layer allowing ease of development
for web based applications, which is also demonstrated as part of this work.
1 INTRODUCTION
Energy demand in residential and small commercial
buildings is increasing dramatically and currently
accounts for 65% of energy consumed on a national
grid. European Union directives are targeting
dramatic improvements in Energy efficiency of at
least 20%, combined with a reduction of green house
gases by 20% for the year 2020 (Directive of
European Parliament, 2004/2006). Managing and
reducing the energy demands from residential and
small businesses will require a low cost and easily
implementable strategy that can be easily adopted by
non-technical users.
Building management systems (BMS) currently
are not cost effective solutions for home or light
commercial users. Cost estimates for wired systems
can range from €1.60 per metre for a new
construction up to €5.00 per metre for retrofit
applications for wired BMS installations (Nan Li,
2010). This is a significant cost and does not take
into account the cost of the BMS itself. Wireless
systems can negate wiring cost with wireless motes
ranging in costs from 20 -100 euro and the cost is
continually dropping. Outside of potential cost
savings wireless systems can also offer other
advantages over traditional BMS solutions. These
are (Nan Li, 2010; Jun Zhang et al., 2011)
Ease of deployment
Easily reconfigured
Easily expanded and upgraded
Low Maintenance
Range of operational environments , they can
be deployed in areas where wiring may not
64
Moore L., Hayes M., Flynn B., Mathuna C., Frecon E., Ericksson J., Kool P., Rosengren P., Fernandez A., Rosik J. and MacSuibhne D..
Wireless Network Deployment as Low Cost Building Management System Solution.
DOI: 10.5220/0004379300640070
In Proceedings of the 2nd International Conference on Smart Grids and Green IT Systems (SMARTGREENS-2013), pages 64-70
ISBN: 978-989-8565-55-6
Copyright
c
2013 SCITEPRESS (Science and Technology Publications, Lda.)

be practical
Can be integrated into smart metering
frameworks (Kaplantis, 2012)
There are a number of commercially available
technologies primarily for home automation.
Hardware such as EnOcean, Z-wave, and KNX that
have been developed that can carry out energy
monitoring and actuation commands. Currently
these systems focus on the Home environment and
while they could be adapted as light weight BMS
solutions they are currently not optimised for such.
These solutions also tend to focus primarily on
electricity consumption of devices without offering
cost effective methods of monitoring gas
consumption (Anders, 2011). Industrial based
wireless hardware and protocols exist on the other
extreme such as WirelessHart. These systems again
are not optimised for the intermediate BMS solution
and are generally targeted towards very specific
industrial applications. Additionally since these
technologies tend towards proprietary technologies
they do not offer a complete retrofit solution (they
are not entirely future proof and if existing wireless
infrastructure exists such as a smart meter, they may
not be easily interoperable) A number of researchers
have looked at physical architectures and
deployments using Zigbee wireless networks (Yang,
2009; Jinsoo, 2009) for the areas of home
automation. These papers have focused primarily on
the design of the Zigbee mote and networks and do
not discuss in any great details deployments or
complete system requirements for a wireless BMS.
Other authors have looked at using 6Lowpan
enabled networks (Bernd and Thomas, 2011) and
have focused on the advantages 6Lowpan, such as
IPV6 compatibility and internet accessibility.
For a completely adaptable retrofit installation
that can act as a BMS alternative the system should
be broken into three distinct parts that are
completely interchangeable. These are
1. Hardware infrastructure
2. Middleware platform
3. Application
The deployment presented here has successfully
retrofitted a residence that is over one hundred years
old with a light weight BMS solution, utilizing low
cost wireless sensor nodes that are flexible and non-
invasive in their design enabling them to easily
integrate onto the existing utility framework at the
pilot site.
The deployment looked at all the components
required to create a lightweight BMS solution such
as the sensor motes, a middleware platform and web
based application that could interface through the
middleware to the deployed hardware acting as the
monitoring and intelligence of the BMS system.
The rest of this paper describes the set-up,
running and evaluation of a real world sensor
network deployment demonstrating device
interoperability and a non-invasive deployment that
provides data to a communications agnostic
middleware platform.
2 NETWORK OVERVIEW
The main objectives of the work carried out were to
Retrofit an existing building with a wireless
sensor enabled energy monitoring and
management system
Deploy wireless sensor motes in a real world
“living-lab” environment
Use a “self healing” mesh network to create a
robust network infrastructure
Utilize an IPV6 protocol for web interoperability
Integrate with the LinkSmart middleware
platform for network management
Report to a web based application for data
monitoring
2.1 Location
A suitable building was selected for deployment of
the wireless sensor network. The building selected
was the Crossleigh building located at University
College Cork (UCC) Figure 1. It is an old residential
building dating back to the middle of last century
that was adapted for use as offices and computer
laboratories for teaching staff and students in the
School of Applied Social Studies. The building’s
heating system is water based. There is a small
boiler house where a gas driven boiler heats the
water, which is then circulated in the building by a
set of pumps, also located in the boiler house. A gas
meter is located in a meter box in the front garden.
In this application the deployed system will control
the pump that serves the second floor, and use it to
regulate the temperature on that floor. The building
itself consists of three floors with the gas boiler
located in a separate extension on the back of the
house and the gas meter in a box out in front of the
building. This building was considered an ideal test
site as it represented both an old residential building
and small commercial enterprise.
WirelessNetworkDeploymentasLowCostBuildingManagementSystemSolution
65
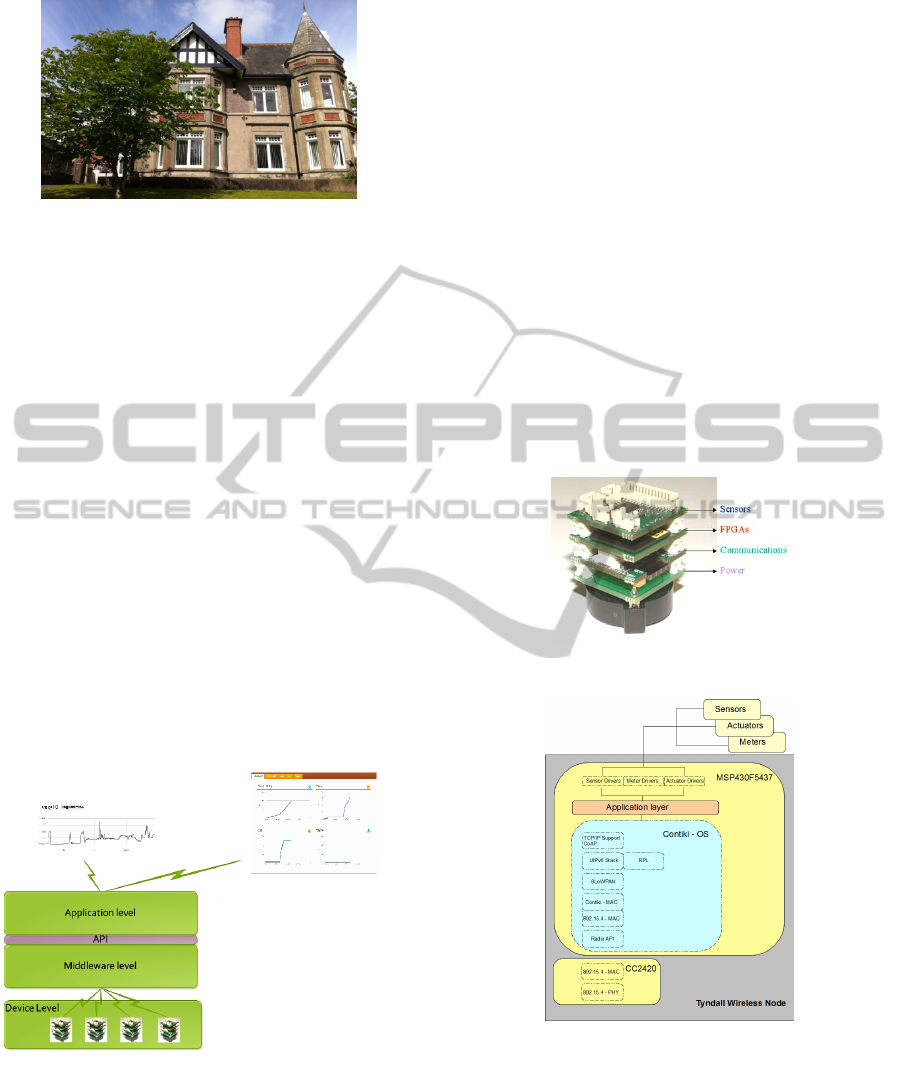
Figure 1: Crossleigh House.
2.2 Deployment Architecture
In order to retrofit an old building such as Crossleigh
house with a light weight BMS solution three main
architectural components are required. These are
The physical hardware
The middleware platform
The BMS application
The system architecture is shown below in Figure 2.
The physical hardware is the monitoring and control
infrastructure for the building and is completely
wireless. The middleware platform connects the
application for monitoring and control with the
deployed hardware. The middleware creates an
agnostic environment for the application developer
to work with, allowing applications to focus on
higher level BMS and energy solutions rather than
integrating with the lower physical layer. The
middleware can be expanded to work with a range of
protocols and devices creating a complete
interoperable framework for retrofit deployments.
Figure 2: System Architecture.
2.2.1 The Wireless Hardware
The wireless sensor platform used for this
deployment is the Tyndall 25mm platform known as
the Tyndall Mote 0. The mote design is based on a
modular layout which enables the user to integrate
any combination of sensors, communications and
power source. The flexible nature of the mote makes
it ideal for an experimental wireless sensor
deployment such as this.
The motes deployed here operate in the 2.4GHz
ISM band using a Texas Instruments CC2420 as the
transceiver. They are controlled by an
MSP430F5437 microcontroller and their peripheral
layer includes: - Temperature, Humidity, Light, RS-
485 interface, UART interface, Modbus, SCADA,
KNX, and DALI
The motes in this project all run the Contiki OS
created by the Swedish Institute for Computer
Science (SICS) (Dunkels et al., 2004).The node
application layer sits on top of the Contiki operating
system, and is capable of executing small C
programs, such as programs for communicating over
modbus to an electric meter or pulse counting on a
gas meter. The Tyndall node is shown below in
Figure 3 and the architecture in figure 4.
Figure 3: Hardware platform used.
Figure 4: Wireless Hardware Architecture.
2.2.2 The Middleware
One of the key components of the deployment is to
use an energy orientated middleware platform
making it possible to network heterogeneous
physical devices into a service-oriented architecture.
The aim of the middleware is to hide the complexity
of the underlying device and communications
SMARTGREENS2013-2ndInternationalConferenceonSmartGridsandGreenITSystems
66

technologies, thus making it easier to develop
applications. Developers can focus more on high
rather than low level issues and functionality. This
deployment utilizes the LinkSmart (formally Hydra)
service orientated middleware software to achieve
these aims (Eisenhaur et al., 2009). This middleware
platform was developed by CNET, Fraunhofer
Institute of Technology (FIT) and Telefonica and is
an open source platform that can be adapted to any
application domain (in this case energy efficiency).
A context manager (Frécon, 2012) was also part
of the middleware platform which focuses
specifically on energy awareness. The middleware
platform communicates with a deployed wireless
network over an RS232 connection to a PC. A
border-router, communicates with the middleware
via a SLIP protocol and acts as the interface between
middleware and hardware. The middleware offers an
API to higher level developers. A device that is
incorporated through the LinkSmart platform is
presented to the developer as software abstraction
within the LinkSmart network, commands can be
sent to the network and data taken from the devices
without needing to know any of the underlying
physical process. This device can then be made
accessible via web services to the application layer.
2.2.3 The Application Layer
As mentioned one of the main advantages of using
the LinkSmart middleware platform is it hides the
complex physical layer from the higher level
application developer. This enables shorter
development times in creating custom applications
for building monitoring. These applications can be
interfaced with any hardware deployed that makes
up the infrastructure of a light weight BMS as the
middleware creates complete platform agnostic
layer. Since the middleware presents physical
devices services to the application layer as web
services the applications can be entirely web based
and accessible from any internet enabled device.
Figure 5 below shows a sample of a developed
Figure 5: Graphical User Interface for Crossleigh house.
business GUI which was created specifically for
Crossleigh house by the ME3gas partner
ResourceKraft.
While the above GUI was developed specifically
for Crossleigh house the web based nature of the
middleware enables easy integration to open source
applications again reducing costs if required. For
example the data for this application has also been
integrated with the online service COSM which is a
free online sensor data monitoring service. A
screenshot of it is illustrated in Figure 6 showing
electricity data for the ground floor of Crossleigh
house.
Figure 6: COSM Screenshot.
The first step in retrofitting this building with an
intermediate BMS solution was to deploy the
wireless hardware that would act as the sensing and
control infrastructure for the building. Since wireless
technology was chosen for the physical
communications a radio survey was first carried out
of the site in order to determine the effective range
of individual wireless motes as well as to determine
the number and placement of each individual mote
in the network. The radio survey was a simple send
receive test, where one node was configured to send
a packet of data and another node configured to
receive and display the data packet on a terminal
program through a UART port. The motes were
placed as shown in figure 7 below based on the radio
survey carried out.
Figure 7: Placed wireless sensor motes.
WirelessNetworkDeploymentasLowCostBuildingManagementSystemSolution
67

The Motes are segmented by task into three main
categories. These are 1. Metering and sensing 2.
Routing and 3.Actuation The metering part of this
application is split into three areas which are
Electricity, Gas and Heat Metering. Two electricity
meter motes were installed, one mote for the ground
floor of the building (M13) and the other for the 2
nd
and 3
rd
floors (M10) A mote was connected to the
pulse output of the gas meter in Crossleigh at M9
(Figure 8) and four meters were connected to pulse
output heat meters M2-M5 Each heat meter
corresponds to one heating zone within Crossleigh
house. The four zones are (i) Ground floor, (ii)
Computer lab (attached to ground floor) , (iii) Floor
2 and (iv) Floor 3.
Figure 8: Gas meter mote.
Based on the radio survey carried out at the start
of this work two motes were placed purely for
routing purposes at M8 and M7.
Actuation is carried out via M6 which controls
the heating for the third floor of the building. M11 is
an under sink heater and this also controlled by the
network.
2.2.4 Network Topology
The wireless network is mesh configured. It operates
UDP for sending data and a TCP-IP for
configuration with an IPV6 header over 802.15.4
utilizing 6LOWPAN for the sensor network itself. It
was envisioned that the network would run on only
TCP. One advantage of using TCP was that any
“normal” tools can be used to monitor and debug the
network and this was proven to work very well for
configuration with a REST Client plug-in for
Firefox. Data is transferred through the motes using
JSON expressions. Problems occurred when trying
to deliver data packets over TCP. Since another
advantage of TCP is the reliability that is offered
from a handshaking protocol, call-backs occur which
raises the network overhead and could cause the
network to “freeze” resulting in situations where no
data was able to get through. As a result TCP was
used for configuration and actuation commands
while UDP was used for sending data packets. This
worked to improve the network stability as non-
critical data packets could be sent via UDP (which
were the majority of data packets). Critical data
packets such as actuation commands were still sent
offer TCP to guarantee delivery.
3 RESULTS
In order to justify the cost of any building
management system savings on utility costs need to
be demonstrated. While actuation was implemented
in this deployment, due to contractual agreements
with the users of the building, no advanced control
strategies were implemented in order to avoid
impact to the quality of their utility services. All
actuation carried out was in-line with existing
building constraints. So for example the actuator
controlling the under sink heater the original system
switched on the heating at 7:00 and off at 18:00
and?? this system did the same. Despite these
restraints based on the monitoring alone and the
integrated application it was possible to show where
further cost savings could be made. Using the
deployed system it was possible to monitor the
electrical consumption of the building broken into
two zones (a) Ground floor which also houses a
computer lab used by students and (b) combined
second and third floors). The electrical consumption
is shown in Figure 9. This graph shows the
consumption per zone as well as the total peak
consumptions. Figure 10 shows the total amount of
gas being consumed in Crossleigh house.
This data is presented as kWhrs for electricity
and gas. For most people the main consideration is
cost. Through the business GUI this data can easily
be converted to monetary value if the pricing is
known. This allows the user to quickly check
various plans and costings on offer from utility
companies and determine the savings that can be
made directly to them. For example, based on the
data available and looking at various plans available
within Ireland (Residential price plans used,
company names not used as this is only a snapshot
of what’s available and not indicative of the whole
market) where this deployment is situated,
comparisons can be made as shown in Table1 for the
week.
Total Gas Consumption = 1750kWhr
Total Electricity Consumption = 700kWhr
SMARTGREENS2013-2ndInternationalConferenceonSmartGridsandGreenITSystems
68

Table 1: Prices applied to gathered data.
Gas
(c/kWhr)
Electricity
(c/kWhr)
Total
Gas €
Total
Electric €
Utility 1 5.540 17.161 94.5 120
Utility 2 5.628 16.93 98.49 118.51
Utility 3 5.894 17.93 103.145 125.51
The data in Table 1shows how using this data
can provide estimates of where to make initial
savings and this is before advanced control
techniques are employed.
As can be seen from the table above switching
providers based on the monitored data and real
values of up to 9% on gas bills and 5% on electricity
can be made. For the week shown this works to an
actual saving of nearly €15. This a very basic
analysis based on basic price plans and one weeks
data but the potential for ensuring cost savings and
return on investment has been demonstrated.
There is only one gas meter within Crossleigh
but the gas is only used to feed the heating supply
within the building. The heating within Crossleigh is
split into 4 separate zones. These are the ground
floor, the student’s computer laboratory, the second
floor and the third floor. As already mentioned there
are heat meters attached to the heating pipe outlets
for each zone and each meter has a wireless mote
attached to it. Thus a breakdown of gas consumption
in Crossleigh could be derived and is shown in
Figure 11. The largest area is the ground floor and
not surprisingly this consumed the most in terms of
gas. The second largest area is the second floor and
this was not surprisingly the second largest
consumer of gas. The computer lab was third largest
area but this consumed the least gas due to the fact
that heat generating equipment is located here and
less heating was needed. From this breakdown it is
easy to see what each area of the buildings is
consuming in terms of heating.
Figure 9: Electricity Consumption 1 week.
Figure 10: Gas Consumption of Crossleigh 1 week.
Figure 11: Gas use per zone in Crossleigh.
4 CONCLUSIONS
Presented here is a real world application of a
wireless network for energy metering and
management that has successfully been retrofitted
into an existing 100+ year old building. This
deployment demonstrated a clear alternative for
building management that bypasses the more
expensive & invasive building energy management
system with
a deployment of all components that would be
required for a wireless BMS deployment
A 6lowpan network for wireless sensing and
actuation in a real world environment
A middleware platform to act as an
intermediary between application layer &
physical layer
A business application for monitoring of the
deployed network
The installation did not require the addition of any
capital equipment such as new boilers or gas meters
and for the most part existing equipment already in
the building was adapted with “add-on” wireless
sensor motes in the form of the Tyndall mote.
Trouble free wireless mote deployment in this
scenario was resultant from the radio survey of the
site carried out early on in the development.
Although relatively simple it still proved a valuable
and effective tool in deploying the sensors in
WirelessNetworkDeploymentasLowCostBuildingManagementSystemSolution
69

suitable locations. This helped in avoiding problems
as the network was expanded. Another observation
related to the issues with TCP mentioned above.
HTTP over IPV6 is believed by many to be the
future of wireless sensor networks due to the ability
to access sensors directly over the web. This
deployment has shown that there can be issues with
this method of communications, future work on this
project is investigating the use of other strategies
such as the use of websockets reduce header
overhead when transmitting sensing and actuation
data over TCP. Other future work is to deploy this
type of set-up on a larger scale in countries such as
Sweden & Spain.
REFERENCES
Directive of the European Parliament & of the Council on
energy & efficiency & amending and subsequently
repealing directives 2004/8/EC and 2006/32/EC.
Jun Zhang, Guangming Song, Hui Wang, Tianhua Meng.,
2011 “Design of a wireless sensor network based
monitoring system for Home Automation” IEEE
International Conference on Future Computer
Sciences and Application.
Yang Li1 , Ji Maorong, Gao Zhenru,Zhang Weiping,Guo
Tao, 2009 “Design of a home automation system
based Zigbee wireless network” The 1st International
Conference on Information Science and Engineering.
Nan Li, “Exploring the use of wireless technology in
building energy management” Proc International
conference in Civil & Building Engineering, 2010.
Jinsoo Han, Haeryong Lee, Kwang-Roh Park, 2009
Remote-Controllable and Energy-Saving Room
Architecture based on ZigBee Communication” IEEE
Transactions on Consumer Electronics.
Bernd Michael Dörge, Thomas Scheffler, 2011 “Using
IPV6 & 6Lowpan for home automation networks”
IEEE International Conf on Consumer Electronics.
M Eisenhaur, P. Rosengran, P. Antolin 2009. “A
Development Platform for Integrating Wireless
Devices and Sensors into Ambient Intelligence
Systems” IEEE 6
th
International Communications
Society Conference on Sensor Mesh and Ad-Hoc
Communications Networks.
Karsten Menzel, Dirk Pesch, Brendan O Flynn, Marcus
Keane, Cian O’ Mathuna, 2009“Towards a Wireless
Sensor Platform for Energy Efficient Building
Operation”.
Kaplantis S., 2012 “Security and Smart Metering” 18
th
European wireless conference.
Anders, A. "EnOcean Technology --- Energy Harvesting
Wireless," EnOcean White paper 2011.
E. Frécon, Dec. 2012 "Bringing Context to the Internet of
Things", In Proceedings of the 19
th
Tcl Conference.
A. Dunkels, B. Grönvall, and T. Voigt. Nov. 2004.
“Contiki – a lightweight & flexible operating system
for tiny networked sensors. In Proceedings of EmNets.
SMARTGREENS2013-2ndInternationalConferenceonSmartGridsandGreenITSystems
70
