
Edges Detection from Aeromagnetic Data using the Wavelet
Transform
Sid-Ali Ouadfeul
1
and Leila Aliouane
2
1
Algerian Petroleum Institute, IAP, XYZ, Boumerdès, Algeria
2
LABOPHT
,
FHC, UMBB, Boumerdès, Algeria
Keywords: Aeromagnetic, Structural Boundaries, Delimitation, Wavelet Transform.
Abstract: The main goal of this paper is to use the 2D Directional Continuous Wavelet Transform (DCWT) for
structural boundaries delimitation from geomagnetic data. The proposed idea is based on the mapping of
maxima of the modulus of the 2D DCWT for each scale used in the DCWT calculation. Application to
synthetic data shows robustness of the technique. Application to the real geomagnetic data of In Ouzzal area
located in the West of Hoggar (Algeria) shows clearly the strength of this last. Comparison with the analytic
signal solutions exhibits that the DCWT is able to predict a pattern of boundary that is hidden by the noise
in the analytic signal and eliminated by a threshold. The proposed method proves to be more powerful easy
to use and versatile where classical methods of potential field interpretation fail or are very constraining.
1 INTRODUCTION
The continuous wavelet transform has becoming a
very useful tool in geophysics (Ouadeul, 2006);
(Ouadfeul, 2007). In Potential field analysis it was
used to locate causative sources point in 2D in
combination with the analytic signal (Ouadfeul and
Aliouane, 2011).
Ouadfeul and Alioaune (2012) have published a
paper on the characterization of geological
boundaries using 2D wavelet transform of gravity
data, the proposed technique has been applied on the
Hoggar.
Ouadfeul et al., (2012) have proposed a new
technique of structural boundaries delimitation from
aeromagnetic data using the 2D ditrectional
continuous wavelet transform, obtained results show
robustness of the proposed technique.
Here we propose a technique of boundaries
delimitation from aeromagnetic data using the 2D
continuous wavelet transform, we start the paper by
describing the relation between the wavelet
transform and the upward continuation, after that we
apply the proposed idea to a synthetic and real data
of an area located in the Algerian Sahara. We
finalize the paper by a results interpretation and a
conclusion.
2 THE CONTINUOUS WAVELET
TRANSFROM AND
POTENTIAL FILED DATA
The sharp contrasts that show the potential data are
assumed to result from discontinuities or interfaces
such as faults, flexures, contrasts intrusive rocks ...
For contacts analysis between geological structures,
we use usually the classical methods based on the
location of local maxima of the modulus of the total
(Nabighian, 1984) or the horizontal gradient
(Blakely et al., 1986), or the Euler’s deconvolution
(Reid et al., 1990). This technique allows, in
addition to localization in the horizontal plane of
contact, an estimate of their depth. The potential
field reduced to the pole, over a vertical contact,
involving the presence of rocks of different
susceptibilities is indicated by a low in side rocks of
low susceptibility and a high in side rocks of high
susceptibility. The inflection point is found directly
below the vertical contact. We can use this
characteristic of geomagnetic anomalous for
localization of abrupt susceptibility change. If the
contact has a dip, the maxima of horizontal gradients
move in the direction of dip. To determine the dip
direction of contacts, we upward the map of the
potential field at different altitudes. At each level,
the maxima of horizontal gradient are located. If the
697
Ouadfeul S. and Aliouane L..
Edges Detection from Aeromagnetic Data using the Wavelet Transform.
DOI: 10.5220/0004380506970701
In Proceedings of the 2nd International Conference on Pattern Recognition Applications and Methods (PRG-2013), pages 697-701
ISBN: 978-989-8565-41-9
Copyright
c
2013 SCITEPRESS (Science and Technology Publications, Lda.)
structures are vertical, all maxima are superposed.
However, moving of maxima with the upward
indicates the direction of the dip. The potential
theory lends perfectly to a multiscale analysis by
wavelet transform.
By choosing an appropriate wavelet,
measurement of geomagnetic field or its spatial
derivatives can be processed as a wavelet transform.
Indeed, this analysis unifies various classical
techniques: it process gradients that have been
upward to a range of altitudes. The expressions of
various conventional operations on the potential
field are well-designed in the wavelet domain. The
most important is the equivalence between the
concept of scaling and the upward. Indeed, the
wavelet transform of a potential field F
0
(x, y) at a
certain scale a = Z/Z
0
can be obtained from
measurements made on the level Z
0
by:
1. Upward continue the measured field a level
Z=a*Z
0
2. Calculation of the horizontal gradient in x and y
directions.
3. Multiplication by a.
For a multiscale analysis of contacts, it is sufficient
to look for local maxima of the modulus of the
continuous wavelet transform (CWT) for different
scales to get exact information about geological
boundaries (Ouadfeul et al., 2010).
3 APPLICATION TO SYNTHETIC
DATA
The proposed idea has been applied at a synthetic
model of a cylinder and prism, parameters of these
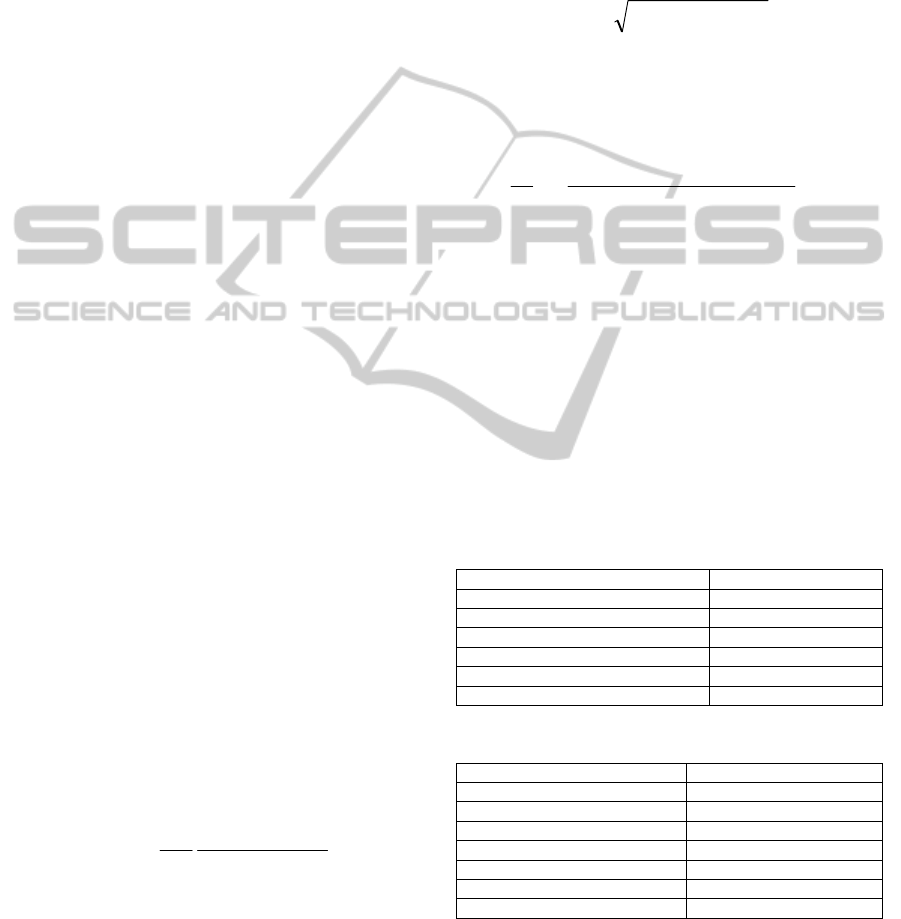
last are resumed in tables 01 and 02. Figure 1 is the
magnetic response of this model generated with a
grid of dimensions 100mx100m. The first operation
is to calculate the modulus of the continuous wavelet
transform. The analyzing wavelet is the Poisson
Kernel defined by equation below (Ouadfeul et al.,
2012).
2/3
22
1
1
2
1
,
yx
yxP
The choice of the analyzing wavelet is based on the
analogy between the upward continuation and the
continuous wavelet transform, if the analyzing
wavelet is the Poisson’s Kerenel, the Modulus of the
continuous wavelet transform at a scale a is
equivalent to the upaward continuation of this field
at the same scale( Ouadfeul et al, 2010). Calculation
of maxima of the continuous wavelet transform of
the geomagnetic field reduced to the pole at the scale
a is equivalent to maxima of the horizontal gradient
of this filed upwarded to Z=a (Ouadfeul et al.,
2010).
Scales are varying following a power law:
djj
j
aa
*
0
2* j=0,1,……,N
22
0
)()(*2 YXa
X
is the grid dimension following the x
dimension.
Y
is the grid dimension following the y
dimension.
22
max max
0
(* )(* )
1
log( ) / log(2)
j
XN YM
N
da
j
d is a real number, in this case we take
3.0
j
d
N
max
=100
M
max
=100
Figure 2 shows this modulus plotted at the smaller
scale a=282m. The second step consists to calculate
its maxima, figure 3 is a map of these maxima for
the full range of scales (Scales varied from 282m to
1131m). Solid curves are the exact boundaries of the
prism and the cylinder. One can remark that the
maxima of the continuous wavelet transform are
positioned around the two exact boundaries.
Table 1: Physical parameters of the Cylinder.
Coordinates of the center (5000, 2500, -250).
Ray 1500m.
High 2500m.
Magnetic Susceptibility K=0.015 SI.
F 37000 nT
Declination D=0°
Inclination I=90°
Table 2: Physical parameters of the Prisme.
Coordinates of the center (5000, 7000, -300).
Width 3000m
Length 3000m.
High 2000m.
Magnetic Susceptibility K=0.01 SI.
F 37000 nT
Declination D=0°
Inclination I=90°
4 APPLICATION TO REAL DATA
The proposed idea is applied to the aeromagnetic
ICPRAM2013-InternationalConferenceonPatternRecognitionApplicationsandMethods
698
data of In Ouzzal, it is located in Hoggar. We start
by describing geology of massif of the area.
F(nT)
X(m)
Y(m)
Figure 1: Magnetic anomaly map of the synthetic model.
X(m)
Y(m)
C(X,Y)
Figure 2: Modulus of the 2D CWT at the smaller scale
a=282m.
Figure 3: Structural boundaries delimited by the 2D CWT.
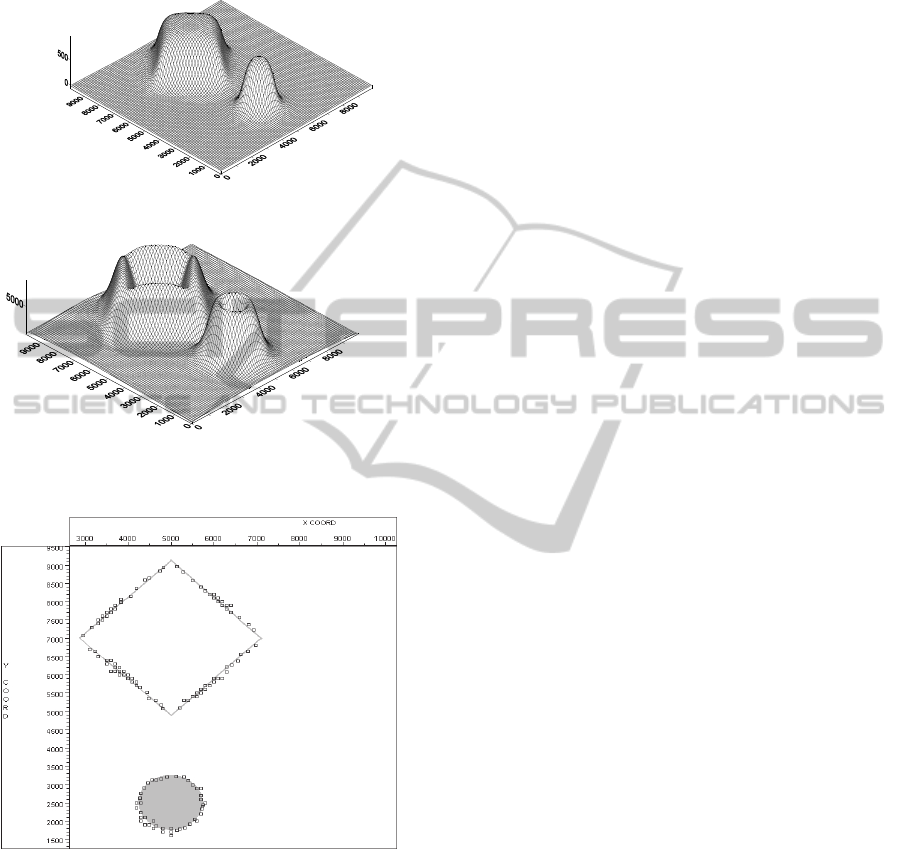
4.1 Geological Setting of in Ouzzal
The In Ouzzal terrane (Western Hoggar) is an
example of Archaean crust remobilized by a very-
high-temperature metamorphism during the
Paleoproterozoic (2 Ga). Structural geometry of the
In Ouzzal terrane is characterized by closed
structures trending NE-SW to ENE-WSW(figure 04)
that correspond to domes of charnockitic
orthogneiss. The supracrustal series are made up of
metasediments and basic-ultrabasic rocks that
occupy the basins located between these domes. In
In Ouzzal area, the supracrustal synforms and
orthogneiss domes exhibit linear corridors near their
contacts corresponding to shear zones. The structural
features in In Ouzzal area, observed at the level of
the base of the crust, argue in favour of a
deformation taking place entirely under granulite-
facies conditions during the Paleoproterozoic. These
features are compatible with D
1
homogeneous
horizontal shortening of overall NW-SE trend that
accentuates the vertical stretching and flattening of
old structures in the form of basins and domes. This
shortening was accommodated by horizontal
displacements along transpressive shear corridors.
During the Pan-African event, the brittle
deformation affected the granulites which were
retrogressed amphibolite and greenschists facies
(with the development of tremolite and chlorite, in
the presence of fluids along shear zones corridors.
Brittle deformations were concentrated in the
southern boundary of In Ouzzal. An important NW-
SE-trending dextral strike-slip pattern has been
mapped along which we can see the Eburnean
foliation F1 overprinted. This period was also
marked by ductile to brittle deformation along the
eastern shear zone bordering the In Ouzzal terrane
with steep fracture cleavage (NNW-SSE) and
conjugate joint pattern. All these structural features
are compatible with an ENE-WSW shortening in
relation with the collision between the West African
Craton and the Hoggar during the Pan-African
orogeny (Djemai et al., 2009).
4.2 Data Processing
In this section we have analyzed the aeromagnetic
data of In Ouzzal to demonstrate the power of the
2D CWT method to identify geological contacts.
Source codes in C language are developed to
calculate the 2D continuous wavelet transform and
the spatial distribution of its maxima at different
scales.
The geomagnetic field data are processed with a
regular grid of 750mX750m.
Figure 5 is the map of the anomaly magnetic
field
T
after reduction to the pole. Parameters of
reduction to the pole (RTP) are illustrated in table
03. After RTP the maximum of the anomaly
magnetic field will be found at the vertical of the
physical structures. The data are then filtered to
remove high frequency noise using a low pass
Butterworth filter with cut-off frequency of 0.29
cycles by km. The next step consists to calculate the
EdgesDetectionfromAeromagneticDatausingtheWaveletTransform
699
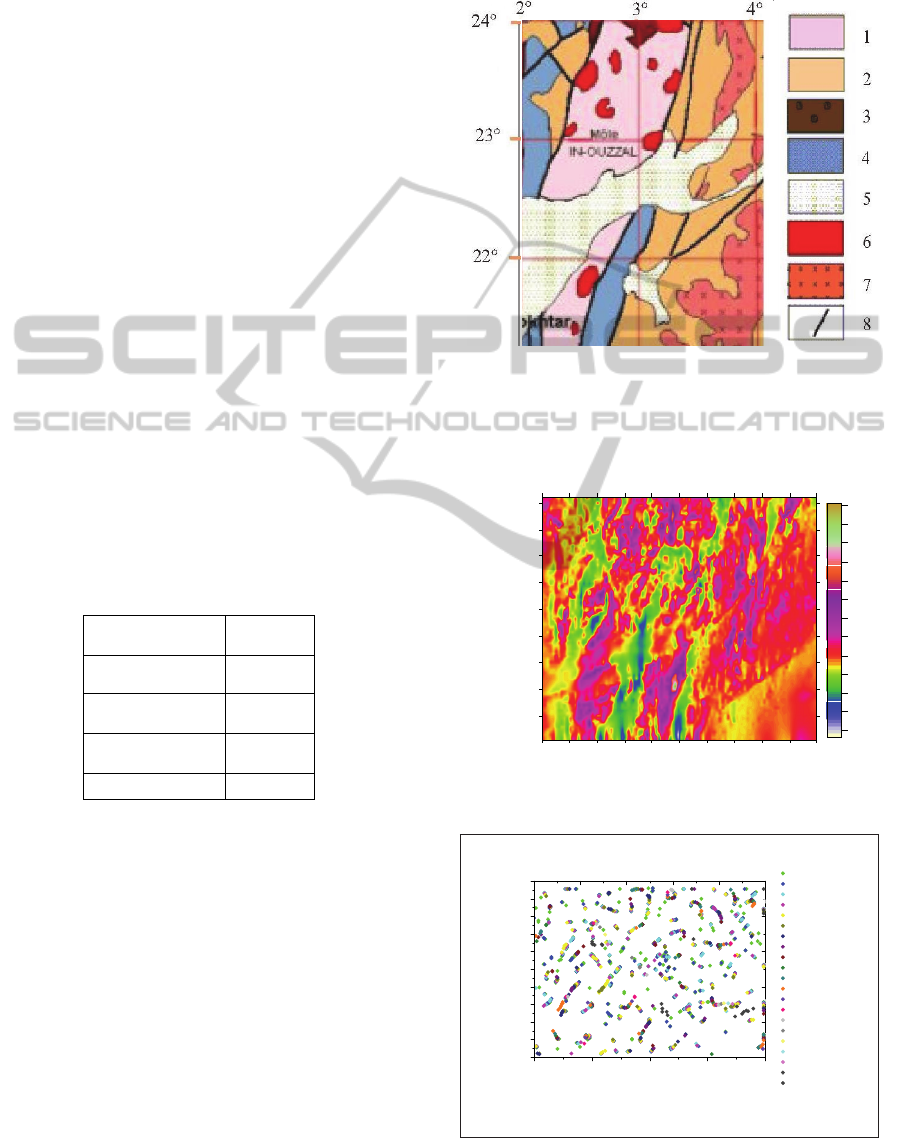
2D continuous wavelet transform of the filtered data.
The analyzing wavelet is the Poisson’s Kernel.
Parameters of scales calculation are:
d
j
=0.3, N
max
=255, M
max
=268.
The next operation consists to calculate maxima of
the modulus of the continuous wavelet transform for
each scale (scales varied between 2.12 and 9.09 km).
Figure 6 shows the chains of maxima in the X, Y,
log-scales coordinates. They are called the Skeleton
of the modulus of the wavelet transform. At each
scale we map points of maxima in the plan. The
obtained set of maxima for all ranged scales will
give the geometry of geologic contacts (Figure 7).
4.3 Results Interpretation and
Conclusions
The obtained contacts by CWT are compared with
the geological map. Obtained results show that the
proposed technique is able to identify contacts that
exist in the structural geology map.
We have proposed a technique of boundaries
identification based on the 2D directional continuous
wavelet transform. Firstly we have applied this idea
to a synthetic model, obtained results shows
robustness of CWT. Application on noised model
shows that CWT is sensitive to noise.
Table 3: Parameters of Reduction to the pole.
Longitude 3°
Latitude 22.5°
Elevation 1000m
Inclinaton 27.6
Declination -4.38
We have applied this technique to the
aeromagnetic data of In Ouzzal. Obtained results are
compared with the geological map and the analytic
signal solutions. One can remark that the 2D
continuous wavelet transform is able to detect
boundaries defined by geologists. Comparison with
analytic signal shows that the CWT is able to
identify contacts that not exist in the map of contacts
defined by AS. The results of this study show that
the proposed technique of edge detection based on
the wavelet transform is very efficient for geological
contacts analysis from maps of geomagnetic
anomalies. Indeed, this kind of analysis of potential
field maps can enhance conventional structural
studies. The identified geological structures have a
big importance in hydrogeological exploration,
mining and in the study of earthquakes and
landslides.
1-Archaean granulites; 2- Gneiss and metasediments; 3- Gneiss
with facies amphibole; 4- Indif gneiss; 5- Paleozoic curvature; 6-
Panafrican granite; 7-Volcano-sediments of Tafassasset; 8- Major
faults.
Figure 4: Structural boundaries of in Ouzzal.
4 0000 0 4 4 0000 48 00 00 5 20 000 5 60 0 00 60 00 00
2420000
2440000
2460000
2480000
2500000
2520000
2540000
2560000
2580000
-800
-600
-400
-200
0
200
400
600
800
1000
1200
1400
1600
X(m)
Y(m)
Figure 5: Magnetic anomaly map reduced to the pole.
400000 450000 500000 550000 600000
2400000
2420000
2440000
2460000
2480000
2500000
2520000
2540000
2560000
2580000
2600000
Y(m)
X(m)
a=3215.32m
a=3958.52m
a=4873.51m
a=6000.00m
a=7386.86m
a=9094.29m
a=11196.39m
a=13784.38m
a=16970.56m
a=20893.21m
a=25722.56m
a=31668.19m
a=38988.11m
a=48000.00m
a=59094.93m
a=72754.40m
a=89571.17m
a=110275.05m
a=135764.51m
a=167145.73m
a=205780.54m
Figure 6: Mapped contacts by the 2D CWT.
ICPRAM2013-InternationalConferenceonPatternRecognitionApplicationsandMethods
700

REFERENCES
Blakely, R. J. and Simpson, R. W, 1986. Approximating
edges of source bodies from magnetic or gravity
anomalies, Geophysics: 51, 1494–1498.
Caby. R, Bertrand. J. M. L, and Black. R, 1981. Pan-
African closure and ontinental collision in the Hoggar-
Iforas segment, central Sahara. in Kroner A (ed)
Precambrian Plate Tectonics, Elsevier, Amst. 407-
434.
Djemaï, S., Haddoum, H., Ouzegane. K., And Kienast, J-
R., 2009. Archaean Series Reworked At Proterozoic In
Amesmessa (West Hoggar): Cartography, Tectonic
Evolution And P-T Path, Bulletin du Service
Géologique National, Vol. 20, n°1, pp. 3 – 29.
Nabighian, M. N., 1984. Toward a three-dimensional
automatic interpretation of potential field data via
generalized Hilbert transforms: Fundamental relations:
Geophysics, 49, 957–966.
Ouadfeul, S., 2006: Automatic lithofacies segmentation
using the wavelet transform modulus maxima lines
WTMM combined with the detrended fluctuations
analysis DFA, 17 International Geophysical congress
and exhibition of Turkey.
Ouadfeul, S.., 2007, Very fines layers delimitation using
the wavelet transform modulus maxima lines WTMM
combined with the discrete wavelet transform DWT,
Presented in SEG Summer research workshop,
Antalya , Turkey.
Ouadfeul, S and Aliouane. L, 2011, Mutiscale analysis of
3D analytic signal using the 2D continuous wavelet
transform, EAGE 6th Congress of Balkan Geophysical
Society - Budapest, Hungary.
Ouadfeul, S., Aliouane, L., Eladj, S., 2010, Multiscale
analysis of gomagnetic data using the continuous
wavelet transform, SEG expanded abstract; Vol29,
doi:10.1190/1.3513065.
Ouadfeul, S., Hamoudi, M., Aliouane, L., and Eladj, S.,
2012, Aeromagnetic data analysis using the 2D
directional continuous wavelet transform (DCWT),
Arab Journal of geosciences.
Ouadfeul, S., Aliouane, L., 2012, Multiscale analysis of
gravity data using the 2D directional continuous
wavelet transform. SEG Istanbul.
Reid, A. B., Allsop, J. M., Granser, H., Millett, A. J.,
Somerton, I. W., 1990. Magnetic interpretation in
three dimensions using Euler deconvolution:
Geophysics, 55, 80–91.
EdgesDetectionfromAeromagneticDatausingtheWaveletTransform
701
