
Enhancing Estimation Skills with GeoGebra
Volume Ratios of Essential Solids
Libu
ˇ
se Samkov
´
a
Department of Mathematics, Faculty of Education, University of South Bohemia,
Jeron
´
ymova 10,
ˇ
Cesk
´
e Bud
ˇ
ejovice, Czech Republic
Keywords:
Volume Ratios, Estimation Skills, GeoGebra, ICT Support.
Abstract:
The first part of this article reports the results of a survey focusing on estimation skills relating to the concept of
volume. The survey tested pre-service and in-service math teachers of various nationalities and various school
types, and investigated their skills in estimating volume ratios of essential solids (a cylinder, a ball, and a cone).
The second part of the article analyzes the mathematical background of cone and ball cases. The third part of
the article shows the possibilities of GeoGebra software in creating test materials for similar surveys, and —
in accordance with the results of the survey — presents dynamic models designed to enhance estimation skills
in volume ratios. The text gives detailed instruction on how to create such kind of GeoGebra materials.
1 INTRODUCTION
Estimation is a process whereby one approximates,
through rough calculations, the worth, size, or amount
of an object or quantity that is present in a given situ-
ation. The approximation, or estimate, is a value that
is deemed close enough to the exact value or mea-
surement to answer the question being posed (NCES,
1999). The importance of estimation in the school
curriculum was acknowledged for instance in the
1986 yearbook of National Council of Teachers of
Mathematics, see (Schoen and Zweng, 1986). The
acquiring of estimation skills in schools is said to pro-
vide an essential practical means of operating within
many mathematical and everyday situations in which
precise calculation or measurement are contextually
defined as either impossible or unnecessary (Levine,
1982).
This article focuses on estimation skills re-
lated to the concept of volume, that means on the
measurement-type estimation skills. It is particularly
devoted to estimating volume ratios. The issue can be
represented by the question
“What are the corresponding height and vol-
ume ratios of a given solid?”
Precisely, for a given solid and for a given volume ra-
tio m/n we explore the level to which the solid should
be filled with water in order to fill exactly m/n of the
solid volume. This level is specified relatively, as a
ratio of the height of the solid. We may also study the
issue conversely — fill the solid to a given height ratio
α, and look for the volume of the filled part expressed
as a ratio of the volume of the whole solid.
The issue of volume ratios is not a common part
of school mathematics, due to difficult calculations
backgrounding the problem. On the other side, vol-
ume ratios are an integral part of everyday reality. To-
gether it makes the issue an ideal candidate for engag-
ing estimates.
The first part of this article reports the results of
a survey focusing on volume ratios of three essential
solids: a cylinder, a ball, and a cone. See Figure 1.
The survey tested 80 pre-service and in-service math
teachers of various nationalities and various school
types, and investigated their skills in estimating vol-
ume ratios of these solids.
Figure 1: Solids filled with water to a certain level.
The second part of the article analyzes the mathe-
matical background of cone and ball cases.
The third part of the article shows the possibilities
of GeoGebra software in creating test materials for
similar surveys, and — in accordance with the results
of the survey — presents dynamic models designed to
enhance estimation skills in volume ratios. The text
89
Samková L..
Enhancing Estimation Skills with GeoGebra - Volume Ratios of Essential Solids.
DOI: 10.5220/0004382100890094
In Proceedings of the 5th International Conference on Computer Supported Education (CSEDU-2013), pages 89-94
ISBN: 978-989-8565-53-2
Copyright
c
2013 SCITEPRESS (Science and Technology Publications, Lda.)
gives detailed instruction on how to create such kind
of GeoGebra materials.
2 THE SURVEY
2.1 The Sample
We tested 37 in-service math teachers, namely 11 uni-
versity teachers and teacher trainers from Czechia,
Germany, Serbia and Bulgaria, and 26 teachers
from Czech, German and Serbian primary, lower-
secondary and upper-secondary schools. These teach-
ers were participants in workshops at some confer-
ences and training seminars held between November
2011 and October 2012.
Concurrently we tested 43 pre-service math teach-
ers from Czech and German universities. These
teacher students were not individually selected; the
survey was conducted in whole classes.
2.2 The Test
All surveyed teachers got to fill the same worksheet,
consisting of 17 quick-answer questions with a com-
mon instruction. These questions were open-ended.
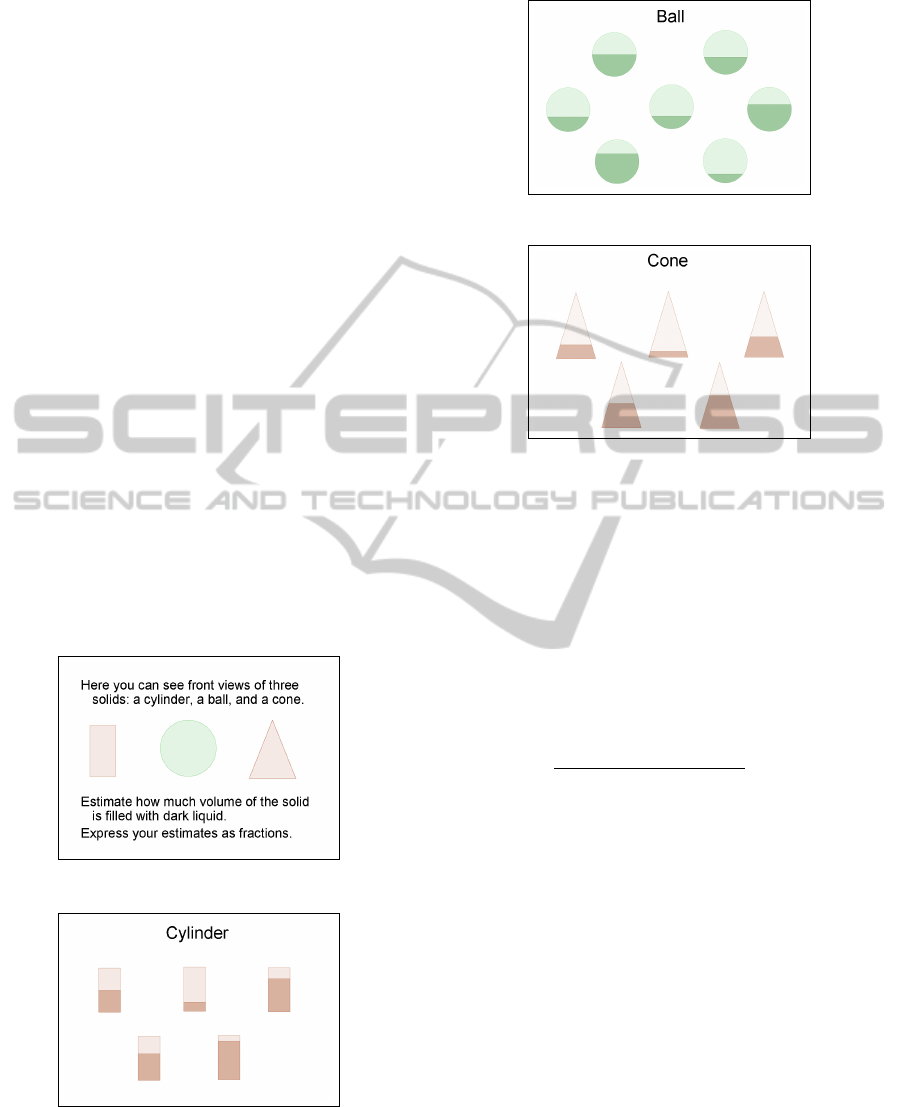
The worksheet is precisely shown in Figures 2-5.
Figure 2: The worksheet, a title page.
Figure 3: The worksheet, a cylinder page.
The content of the worksheet is of escalating dif-
ficulty. It begins with a cylinder case, which serves as
a kind of calibration — all volume ratios of a cylin-
der are identical to height ratios. Then the worksheet
Figure 4: The worksheet, a ball page.
Figure 5: The worksheet, a cone page.
continues with a ball, whose height and volume ratios
coincide only in 1/2 case. The final part of the work-
sheet is devoted to a cone, in which all height ratios
differ from their corresponding volume ratios.
2.3 The Evaluation
We divided respondents into 2 groups according to
their status (in-service, pre-service).
We focused on relative errors of estimates calcu-
lated as
estimate − exact answer
exact answer
(1)
so that the sign can tell us if the estimate is bigger
than the exact answer (+ sign) or smaller (− sign).
As the first evaluation method we ascertained
relative errors of all outcome estimates, and deter-
mined their arithmetic mean and median. A detailed
overview can be found in Table 1.
The table shows that both in-service and pre-
service teacher respondents have good estimation
skills in a cylinder case, and also in a ball case — ex-
cept 1/10 of the ball volume. Both groups overrated
1/10 of the ball volume, in-service performed a little
better, their mean relative error is 44 %. Also both
medians are overrated in this case.
On the other side, cone estimates are generally un-
derrated, for all tested volume ratios. The worst cone
ratio was 1/2 (with mean relative error -33 %, resp.
-32 %), closely followed by 1/4 (with both mean rel-
ative errors -29 %).
Since the variability of answers was limited by
the requirement to express volume ratios as fractions,
CSEDU2013-5thInternationalConferenceonComputerSupportedEducation
90

Table 1: Relative errors of in-service and pre-service teach-
ers’ estimates; in-service: N = 37, pre-service: N = 43.
Solid & In-service Pre-service
volume ——————- ——————-
ratio Mean Median Mean Median
Cylin 1/2 -1 % 0 % 0 % 0 %
Cylin 1/5 -2 % 0 % 0 % 0 %
Cylin 3/4 1 % 0 % 1 % 0 %
Cylin 3/5 3 % 0 % 3 % 0 %
Cylin 7/8 -7 % 0 % 0 % 0 %
Ball 1/2 0 % 0 % 0 % 0 %
Ball 1/3 8 % 0 % 5 % 0 %
Ball 1/4 8 % 0 % 14 % 6 %
Ball 1/5 15 % 0 % 7 % 0 %
Ball 2/3 -2 % 0 % -1 % 0 %
Ball 3/4 1 % 0 % -1 % 0 %
Ball 1/10 44 % 34 % 48 % 55 %
Cone 1/2 -33 % -33 % -32 % -33 %
Cone 1/4 -29 % -20 % -29 % -33 %
Cone 2/3 -30 % -25 % -28 % -25 %
Cone 3/4 -19 % -20 % -19 % -20 %
Cone 7/8 -15 % -14 % -14 % -14 %
Table 2: Modus of estimates.
Solid, volume ratio In-service Pre-service
Ball 1/10 1/6 1/5
Cone 1/2 1/3 1/3
Cone 1/4 1/5 1/6
Cone 2/3 1/2 1/2
Cone 3/4 3/5, 1/2 3/5
Cone 7/8 3/4 3/4
we may also focus on modus of our data. A detailed
overview of cases whose modus differs from the exact
answer is in Table 2.
We may also analyze the difference between
groups by independent two-sample t-test. Take for
example the samples of relative errors belonging to
Ball 1/10 picture. Formula
S
2
X
S
2
Y
= 1,443 ∈
1
F
42,36
(0,025)
,F
42,36
(0,025)
(2)
means that we do not reject the hypothesis of equal
variances at 0,05 level, and
T = 0, 399 5 t
78
(0,05) (3)
means that we do not reject the hypothesis of equal
means at 0,05 level either.
As the last method of evaluation we use the scor-
ing method for Estimation Interview Test used in
(Montague and van Garderen, 2003): an estimate is
considered accurate if it is within 50 % of the ex-
act answer. From this perspective, the case of 1/10
of the ball volume appears as the one with the high-
est failure rate: it has 17 inaccurate estimates among
Table 3: Percentage of inaccurate estimates.
Solid, volume ratio In-service Pre-service
Cylinder 1/2 0 % 0 %
Cylinder 1/5 3 % 0 %
Cylinder 3/4 0 % 0 %
Cylinder 3/5 0 % 2 %
Cylinder 7/8 8 % 2 %
Ball 1/2 0 % 0 %
Ball 1/3 6 % 9 %
Ball 1/4 11 % 23 %
Ball 1/5 11 % 7 %
Ball 2/3 0 % 9 %
Ball 3/4 0 % 7 %
Ball 1/10 47 % 54 %
Cone 1/2 6 % 21 %
Cone 1/4 25 % 28 %
Cone 2/3 6 % 7 %
Cone 3/4 8 % 19 %
Cone 7/8 6 % 9 %
in-service teachers’ answers (which means 47 % an-
swers being inaccurate), and 23 among pre-service
teachers’ answers (54 % inaccurate). The second one
in terms of failure is the case of 1/4 of the cone vol-
ume with 25 %, resp. 28 % inaccurate answers. A
detailed overview can be found in Table 3.
2.4 The Summary
The survey showed that both pre-service and in-
service math teachers had significant difficulties with
estimating volume ratio from a picture of a cone, and
in some cases also from a picture of a ball.
It would be expedient to enhance this kind of esti-
mation skills, for instance through a suitable ICT en-
vironment.
3 MATHEMATICAL
BACKGROUND
This section shall reveal the mathematical back-
ground of the problem of finding the height ratio α
for a given volume ratio m/n, and vice versa.
3.1 The Cone
The volume of a cone with base radius r and height
k is given by a formula
1
3
πr
2
k. The water in the
cone reaches an unknown height h, expressed as an
α-multiple of the height of the cone, i.e., h = α · k.
The complement of the water in the cone is also a
cone, with height k(1 − α), and base radius r(1 − α).
EnhancingEstimationSkillswithGeoGebra-VolumeRatiosofEssentialSolids
91

See Figure 6. Thus, the volume of the water can be
expressed as
V
water
=
1
3
πr
2
k −
1
3
πr
2
(1 − α)
2
k(1 − α)
=
1
3
πr
2
k
1 − (1 − α)
3
(4)
Figure 6: The cone (left), similar triangles (middle, right).
We are looking for a water level corresponding to
m/n of the cone volume:
V
water
=
m
n
· V
cone
1 − (1 − α)
3
=
m
n
(5)
α = 1 −
3
r
1 −
m
n
(6)
3.2 The Ball
The volume of a ball with radius r is given by a for-
mula
4
3
πr
3
. The height of the ball equals 2r. The wa-
ter in the ball reaches an unknown height h = α · 2r.
The water in the ball occupies a spherical cap with
height h, for details see Figure 7.
Figure 7: The ball situation in detail.
The volume of the water equals the volume of the
spherical cup, that means
V
water
=
1
6
πh(3a
2
+ h
2
) =
4
3
πr
3
α
2
(3 − 2α) (7)
We are looking for a water level corresponding to
m/n of the ball volume:
V
water
=
m
n
· V
ball
α
2
(3 − 2α) =
m
n
(8)
2α
3
− 3α
2
+
m
n
= 0 (9)
This cubic equation has three real solutions, one of
them belonging to an interval h0,1i:
α =
1
2
− cos
π + arccos
1 −
2m
n
3
(10)
Detailed solution of (9) leading to (10) can be found
in (Samkova, 2012).
4 ICT SUPPORT
We shall show the possibilities of enhancing estima-
tion skills with help of ICT, both in passive and active
ways. We shall use GeoGebra, free mathematics dy-
namic software for teaching and learning mathemat-
ics at all school levels. GeoGebra is currently avail-
able in about 55 languages, it has received several
educational software awards in Europe and the USA.
For more about GeoGebra see (GeoGebra, 2012).
4.1 Creating Illustrations with
GeoGebra
At first we shall demonstrate the passive way of Geo-
Gebra support — dynamic illustrations of transparent
hollow essential solids partially filled with water.
4.1.1 The Cylinder
The GeoGebra construction begins with sliders for n,
m, cylinder radius r, and cylinder height k. Then we
create a front view of the cylinder, which is actually a
rectangle with base 2r and height k:
poly1= Polygon[(r,0),(r,k),(-r,k),(-r,0)]
The filled part of the cylinder is also a cylinder, its
front view is another rectangle:
h=k*m/n
poly2=Polygon[(r,0),(r,h),(-r,h),(-r,0)]
The construction is almost done, we just have
to design it properly. We change LineThickness of
poly1 to 6, Color of poly2 to blue, LineThickness of
poly2 to 0, Opacity of poly2 to 50. The preview of
the construction is in Figure 8.
With this dynamic illustration we may prepare
various pictures of cylinders filled with water to a cer-
tain level, and export them as PNG or EPS files.
We may also export the dynamic worksheet as a
webpage, and make it available to students. In this
case, we label the r slider with “base radius”, and the
k slider with “cylinder height”. We add an interactive
text to the worksheet.
The final form of the worksheet is in Figure 9.
CSEDU2013-5thInternationalConferenceonComputerSupportedEducation
92
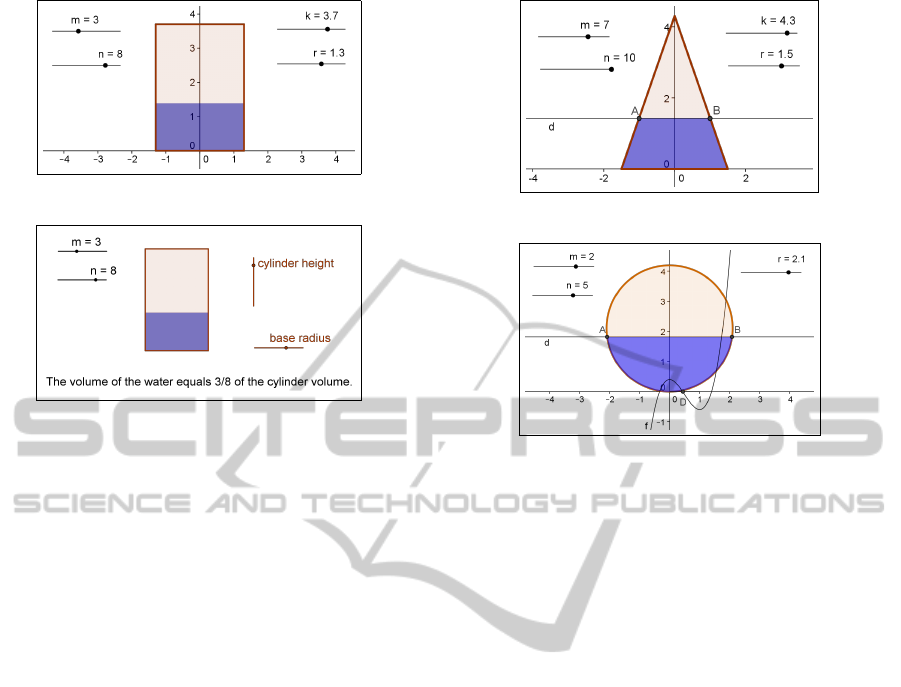
Figure 8: The preview of the cylinder case construction.
Figure 9: The dynamic worksheet for a cylinder.
4.1.2 The Cone
The construction begins again with sliders for n, m,
base radius r, and cone height k. Then we create a
front view of the cone, which is actually an isosceles
triangle with base 2r and height k:
poly1= Polygon[(r,0),(0,k),(-r,0)]
The filled part of the cone is a truncated cone, its
front view is an isosceles trapezoid:
alpha=1-(1-m/n)ˆ(1/3)
h=alpha*k
d=Line[(0,h),xAxis] . . . the water level
Intersect[d,poly1] . . . points A and B
poly2=Polygon[(r,0),B,A,(-r,0)]
Now we just have to design the picture the same
way as in the cylinder case. The preview of the con-
struction is in Figure 10.
Note that the illustration is not correct for m = n.
We have to create a blue triangle
poly3=Polygon[(r,0),(0,k),(-r,0)]
with a Condition to Show Object m=n.
4.1.3 The Ball
The construction begins again with sliders for n, m,
and ball radius r. Then we create a front view of the
ball, which is a circle with radius r:
circ1=Circle[(0,r),r]
As the next step we solve graphically the equation
(9): we define a left side as a function, and find where
its graph intersect h0,1i at the x-axis:
f(x)=2xˆ 3-3xˆ 2+m/n
Figure 10: The preview of the cone case construction.
Figure 11: The preview of the ball case construction.
a=Segment[(0,0),(1,0)]
D=Intersect[f,a]
alpha=x(D)
The filled part of the ball is an upside-down ori-
ented spherical cup, its front view is a circular seg-
ment with a chord parallel to x-axis:
h=alpha*2r
d=Line[(0,h),xAxis] . . . the water level
Intersect[d,circ1] . . . points A and B
circ2=Arc[circ1,A,B]
As previously, we design the picture, and solve
separately the situation for m = n. The preview of the
construction is in Figure 11.
4.2 Interactive Estimation Training
with GeoGebra
Now we shall demonstrate the active way of Geo-
Gebra support — a dynamic GeoGebra worksheet for
interactive estimation training of volume ratios. This
tool focuses on the process of finding the right esti-
mate of water level for a given volume ratio. The
worksheet randomly generates volume ratios m/n,
waits for the user to draw his estimate to the picture,
and evaluates the estimate.
We shall show the construction in a cone case. The
construction begins with random sliders for n, m, with
sliders for r, k, and with poly1, alpha, h as in 4.1.2.
Then we create the exact water level:
d=Segment[(-2*r,h),(2*r,h)]
EnhancingEstimationSkillswithGeoGebra-VolumeRatiosofEssentialSolids
93
This exact answer should be hidden if needed, so that
we create a check box q with d as its selected object,
and label it Exact answer.
The next step will prepare the picture for user’s
estimation process:
p=Segment[(0,0),(0,k)]
P=Point[p]
o=Line[P,xAxis]
Intersect[o,poly1] . . . points A and B
poly2=Polygon[(r,0),B,A,(-r,0)]
The preview of the construction is in Figure 12.
Figure 12: The preview of the training construction.
As a final activity we have to manage the process
of generating random values of n, m: we create a but-
ton with label New task, and with GeoGebra script
UpdateConstruction[]
q=false
Pressing this button will load new random values
for n and m, and hide the segment with exact answer.
The user can move point P to a position where he
thinks the corresponding water level should be, then
mark the check box Exact answer, and compare his
estimate with the line of exact answer.
We may also determine relative error of the esti-
mate: define err=round((y(P)-h)/h*100), and in-
corporate it into an interactive text with a Condition
to Show Object q=true to it.
The final form of the worksheet can be seen in
Figures 13 and 14.
5 CONCLUSIONS
The issue of volume ratios is a remarkable compo-
nent of the concept of volume. Our survey showed
that even math teachers had difficulties with estimat-
ing volume ratios of some essential solids. GeoGebra
software offers an interesting way how to enhance
this kind of estimation skills — through a dynamic
GeoGebra environment we can create illustrations re-
lated to the volume ratio issue, or an interactive es-
timation training tool. Future surveys may focus on
Figure 13: The worksheet ready for user’s estimation.
Figure 14: The evaluation of the user’s estimate.
non-teacher respondents or more deeply on the partic-
ular role of GeoGebra in enhancing estimation skills.
ACKNOWLEDGEMENTS
The survey described in the article was conducted
within a European FP7 project: The FIBONACCI
Project — Large scale dissemination of inquiry based
science and mathematics education, No. 244684.
REFERENCES
GeoGebra 4 available at http://www.geogebra.org, (re-
trieved Nov 5, 2012).
Levine, D. R. (1982). Strategy use and estimation ability of
college students. Journal for Research in Mathematics
Education, 13, 350-359.
Montague, M. and van Garderen, D. (2003). A Cross-
Sectional Study of Mathematics Achievement, Esti-
mation Skills, and Academic Self-Perception in Stu-
dents of Varying Ability. Journal of Learning Dis-
abilities, 36(5), 437-448.
National Center for Educational Statistics (1999). Estima-
tion Skills, Mathematics-in-Context, and Advanced
Skills in Mathematics. NCES 2000-451, Washington,
DC.
Samkova, L. (2012). Jak velk
´
a je t
ˇ
retina koule? [In Czech:
How big is one third of a ball?] South Bohemia Math-
ematical Letters, 20(1). (to appear)
Schoen, H. and Zweng, M. (1986). Estimation and mental
calculations: The 1986 Yearbook of the NCTM. VA:
National Council of Teachers of Mathematics, Reston.
CSEDU2013-5thInternationalConferenceonComputerSupportedEducation
94
