
Text Mining in Students’ Course Evaluations
Relationships between Open-ended Comments and Quantitative Scores
Tamara Sliusarenko, Line Harder Clemmensen and Bjarne Kjær Ersbøll
Department of Applied Mathematics and Computer Science, Technical University of Denmark, 2800 Lyngby, Denmark
Keywords:
Text Mining, Course Evaluation, Teacher Evaluation, Factor Analysis, Keyphrase Extraction.
Abstract:
Extensive research has been done on student evaluations of teachers and courses based on quantitative data
from evaluation questionnaires, but little research has examined students’ written responses to open-ended
questions and their relationships with quantitative scores. This paper analyzes such kind of relationship of a
well established course at the Technical University of Denmark using statistical methods. Keyphrase extraction
tool was used to find the main topics of students’ comments, based on which the qualitative feedback was
transformed into quantitative data for further statistical analysis. Application of factor analysis helped to reveal
the important issues and the structure of the data hidden in the students’ written comments, while regression
analysis showed that some of the revealed factors have a significant impact on how students rate a course.
1 INTRODUCTION
Teacher evaluations and overall course quality eval-
uations, where students submit their feedback about
the teacher and the course anonymously at the end of
the course or during the course, are widely used in
higher education. The results of such evaluations is
one of the most common tools used by universities
to improve courses for future students and to improve
teachers effectiveness (Seldin, 1999; Wright, 2006).
At the same time, student ratings is also one of the
most controversial and highly-debated measures of
course quality. Many have argued that there is no bet-
ter option that provides the same sort of quantifiable
and comparable data on teaching and course effective-
ness (Abrami, 2001; McKeachie, 1997).
In addition to analysis of quantitative answers for
questions, there is a need for analyzing students’
written comments. Many instructors say that they
get much more relevant information from students’
written comments than they do from the quantitative
scores. Teachers can use insights from the ’ written
feedback to make adjustments to future classes in a
more productive way.
Student’s written feedback is also of interest for
university administration and study board, however it
is hard to go trough all the comments from all courses
taught at the university every semester. It is more con-
venient to have a general overview of the main points
of student satisfaction and dissatisfaction, extracted
from students written feedback.
A tool, that helps to automatically extract impor-
tant points from open-ended questions from course
evaluation, can add important information to the pro-
cess of analysis and improvement of courses. This
study is just an early stage that tries to find the most
important patterns in students’ written positive and
negative feedback for one well established course, at
the Technical University of Denmark (DTU) using
simple statistical and text-mining tools.
2 LITERATURE
Analysis of open-ended students’ comments is prob-
lematic, because written comments have no built-in
structure. Another challenge is that open-ended ques-
tions have much lower response rates than quantita-
tive questions and there are some comments like ”no
comments” or ”nothing”, that are unhelpful. On the
other hand the open ended nature of a question allows
students to focus on what exactly is the most impor-
tant for them.
Students’ written comments have not received as
much attention as quantitative data from student eval-
uations. Lots of studies have been done on validity
and reliability of quantitative data for course improve-
ment and on relationship between student ratings and
student achievements (Cohen, 1981; Feldman, 1989;
Abrami et al., 2007).
564
Sliusarenko T., Harder Clemmensen L. and Ersbøll B..
Text Mining in Students’ Course Evaluations - Relationships between Open-ended Comments and Quantitative Scores.
DOI: 10.5220/0004384705640573
In Proceedings of the 5th International Conference on Computer Supported Education (CSEDU-2013), pages 564-573
ISBN: 978-989-8565-53-2
Copyright
c
2013 SCITEPRESS (Science and Technology Publications, Lda.)

Studies on analysis of written comments, that have
been published, suggests how written student com-
ments can be organized and analyzed in order to re-
veal information about aspects of the learning process
(Lewis, 2001; Hodges and Stanton, 2007). Most of
such studies suggest manual categorization of com-
ments into groups of positive, negative and neutral,
or some other kind of grouping, with further investi-
gation of particular factors that reflects students satis-
faction or dissatisfaction within each group.
It is quite hard to classify written feedback. Be-
cause of it’s open-ended nature, the text, that is en-
tered by a student, can range from a few noncritical
words such as ”cool teacher” to paragraphs with de-
tailed analysis. In general, students more often write
positive comments, rather then negative, and com-
ments tend to be more general rather than specific (Al-
hija and Fresko, 2009).
Not much research have been done to investigate
the relationship between data obtained from the writ-
ten comments and data obtained from the quantita-
tive part of evaluations. Improvement of computa-
tional power and the development of more sophisti-
cated text mining techniques allows for a more so-
phisticated analysis on teacher and course evaluation
data (Romero and Ventura, 2007).
Studies that have looked into relationship between
the quantitative data and the students written re-
sponses suggest that there is a correlation between
the quantitative and written feedback from students
(Sheehan and DuPrey, 1999), but such examinations
are relatively rare.
3 METHODS
Unstructured data, as students’ written feedback, is
difficult to process and to analyze. Text mining is the
process of deriving information from text, that usually
involves the process of structuring the input text, de-
riving patterns, and finally evaluating and interpreting
the output.
Text mining is an interdisciplinary field that draws
on information retrieval, data mining, machine learn-
ing, statistics, and computational linguistics. It is of
importance in scientific disciplines, in which highly
specific information is often contained within written
text (Manning and Schutze, 1999).
3.1 Term-document Matrix
A lot of the text mining methods are based on
construction of a term-document matrix, high-
dimensional and sparse mathematical matrix that de-
scribes the frequencies of terms that occur in a col-
lection of documents. There are various ways to de-
termine the value that each entry in the matrix should
take, one of them is tf-idf.
Term frequency - inverse document frequency (tf-
idf), is a numerical value which reflects importance of
a word for a document in a collection of documents.
The tf-idf value increases proportionally to the num-
ber of times a word appears in the document, but with
an offset by the frequency of the word in the corpus,
which helps to control for the fact that some words
are generally more common than others (Salton and
Buckley, 1988).
Tf-idf is defined as the product of two statistics:
term frequency, the number of times that term occurs
in a document devided by the total number of words
in the document, and inverse document frequency, a
measure of whether the term is common or rare across
all documents. It is defined by dividing the total num-
ber of documents by the number of documents con-
taining the term, and then taking the logarithm of that
ratio.
The tf-idf weight of term t in document d is high-
est when t occurs many times within a small num-
ber of documents, lower when the term occurs fewer
times in a document, or occurs in many documents
and lowest when the term occurs in almost all docu-
ments of a collection.
3.2 Key Term Extraction
Extraction of keyphrases is a natural language pro-
cessing task for collecting the most meaningful words
and phrases from the document. It helps to summa-
rize the content of a document in a list of terms and
phrases. Automatic keyphrase extraction can be used
as a ground for other more sophisticated text-mining
methods.
In this study, the Likey keyphrase extraction
method (Paukkeri and Honkela, 2010) is used. Likey
is an extension of Damerau’s relative frequencies
method (Damerau, 1993). It is a simple language-
independent method (the only language-specific com-
ponent is a reference corpora). According to the
method, a Likey ratio (1) is assigned to each phrase
(Paukkeri et al., 2008).
L(p, d) =
rank
d
(p)
rank
r
(p)
(1)
where rank
d
(p) is the rank value of phrase p in doc-
ument d and rank
r
(p) is the rank value of phrase p in
the reference corpus. The rank values are calculated
according to the frequencies of words of the same
length n. The ratios are sorted in increasing order and
the phrases with the lowest ratios are selected.
TextMininginStudents'CourseEvaluations-RelationshipsbetweenOpen-endedCommentsandQuantitativeScores
565

3.3 Statistical Methods
3.3.1 Factor Analysis
Multivariate data often include a large number of
measured variables, and often those variables ”over-
lap” in the sense that groups of them may be depen-
dent. In statistics, factor analysis is one of the most
popular methods used to uncover the latent structure
of a set of variables. This method helps to reduce the
attribute space from a large number of variables to a
smaller number of unobserved (latent) factors.
Factor analysis searches for joint variations in re-
sponse to unobserved latent variables. The observed
variables are modeled as linear combinations of the
potential factors, plus ”error” term. The coefficients
in a linear combination are called factor loadings.
Sometimes, the estimated loadings from a factor
analysis model can give a large weight on several fac-
tors for some of the observed variables, making it dif-
ficult to interpret what those factors represent. The
varimax rotation is the most commonly used crite-
rion for orthogonal rotation, that helps to simplify the
structure and ease interpretation of the resulting fac-
tors (Hair et al., 2006).
3.3.2 Logistic Regression
Logistic regression is a type of regression analysis
used in statistics for predicting the outcome of a cate-
gorical dependent variable based on one or more usu-
ally continuous predictor variables. In cases where
the dependent variable consists of more than two cat-
egories which can be ordered in a meaningful way,
ordered logistic regression should be used.
The relationship between a categorical depen-
dent variable and independent variables is measured,
by converting the dependent variable to probability
scores. The model only applies to data that meet
the proportional odds assumption, that the relation-
ship between any two pairs of outcome groups is sta-
tistically the same. The model cannot be consistently
estimated using ordinary least squares; it is usually
estimated using maximum likelihood (Greene, 2006).
4 DATA DESCRIPTION
At the Technical University of Denmark (DTU), as
in many other universities around the world, students
regularly evaluate courses. At DTU students fill final-
evaluation web-forms on the university’s intranet one
week before the final week of the course. It is not
mandatory to fill out the course evaluation. The eval-
uation form consist of tree parts: Form A contains
specific quantitative questions about the course (Ta-
ble 1), Form B contains specific quantitative questions
about the teacher and Form C gives the possibility of
more qualitative answers divided in 3 groups: What
went well?; What did not go so well?; Suggestions
for changes.
Table 1: Questions in Form A.
A.1.1 I think I am learning a lot in this course
A.1.2 I think the teaching method encourages my
active participation
A.1.3 I think the teaching material is good
A.1.4 I think that throughout the course, the teacher
has clearly communicated to me where I
stand academically
A.1.5 I think the teacher creates good continuity
between the different teaching activities
A.1.6 5 points is equivalent to 9 hours per week. I
think my performance during the course is
A.1.7 I think the course description’s prerequisites
are
A.1.8 In general, I think this is a good course
The students rate the quantitative questions on a 5
point Likert scale (Likert, 1932) from 5 to 1, where 5
means that the student strongly agrees with the given
statement and 1 means that the student strongly dis-
agrees. For question A.1.6, 5 corresponds to ”much
less” and 1 to ”much more”, while for A.1.7, 5 corre-
sponds to ”too low” and 1 to ”too high”. These ques-
tions where decoded in such a way that 5 corresponds
to best option and 1 corresponds tho the worst.
For this paper data from a Mathematics for En-
gineers course was analyzed. This is a bachelor 5-
ECTS points introductory level course that is avail-
able in both spring and fall semesters. The course is
well established with almost the same structure over
the last 5 years, thus it is large enough to collect a suf-
ficient number of comments to perform text analysis.
Table 2 presents the response rates on the course
from fall 2007 to spring 2012. The number of stu-
dents that followed the course during spring semesters
is approximatively half of that for fall semesters. The
course is mandatory for students who want to enter a
Master program at DTU. According to the program
the most convenient is to take this course in the fall
semester of the second year of education. A part
of the spring semester students are those who failed
the course in the fall semester. The response rates
are lower for spring semesters (33-49%), than for fall
semesters (41-62%).
There are more students, who write positive com-
ments than those who write negative. However the
CSEDU2013-5thInternationalConferenceonComputerSupportedEducation
566
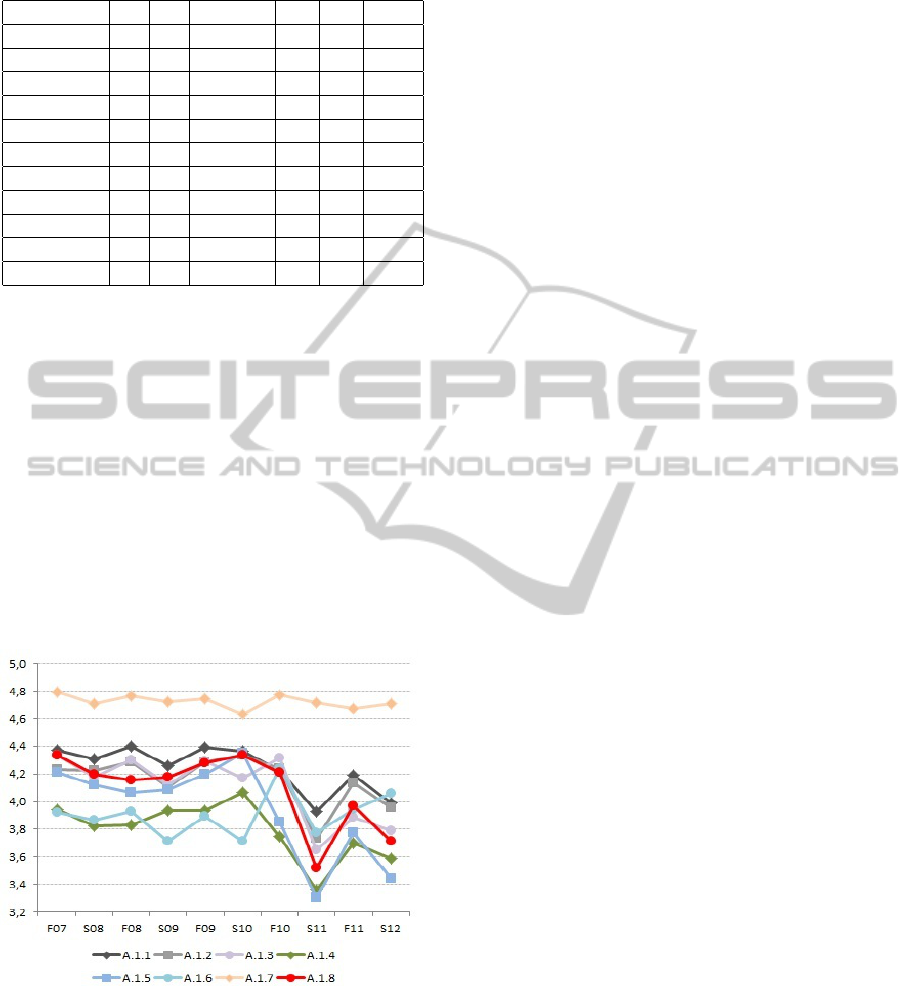
Table 2: Number of comments.
semester n.s. n.e. r.r.. n.p.c.n.n.c. n.o.s.
spring 2012 251 85 33,86% 32 28 30
fall 2011 494 239 48,38% 78 60 70
spring 2011 262 93 35,50% 30 41 37
fall 2010 520 212 40,77% 60 46 46
spring 2010 260 101 38,85% 35 25 29
fall 2009 545 337 61,83% 153 91 98
spring 2009 223 73 32,74% 31 22 21
fall 2008 517 290 56,09% 93 71 83
spring 2008 225 111 49,33% 37 21 17
fall 2007 566 326 57,60% 119 58 68
total 38631867 48,33% 668 463 499
n.s. - number of students registered for the course
n.e. - number of students that answered some question of eval-
uation
r.r. - response rate
n.p.c. - number of positive comments
n.n.c - number of negative comments
n.o.s. - number of suggestions for changes
average length of the negative comments (35 words)
is 10 words larger than the average length of possitive
comments(26 words) and suggestions (25 words).
Figure 1 shows a change in the average student
rating of the course over time. The students satis-
faction of the course dropped down by approximately
half a point on a Likert scale in spring 2011 for all of
the questions except A.1.7. (course prerequisites).
Figure 1: Change in average quantitative ratings over time.
The course is well-established: the curriculum,
the book and the structure of the course were the same
during last years. However one of the main teachers
changed in spring 2011. This caused a drop in course
evaluation, since the teacher was not experienced in
teaching introductory-level courses and had higher
expectations to the students. The results of course
and teacher evaluations were analyzed and changes
in teaching style were made for the next semesters.
The general objectives of the course are to provide
participants with tools to solve differential equations
and systems of differential equations. Some mention
mathematical issues related to the course topics.
5 RESULTS
5.1 Term Extraction
The length of student comments on the course un-
der consideration ranges from 1 word to 180 words.
Even large comments are not long enough to perform
keyphrase extraction solely on them. The keyphrase
extraction process was done in the following way:
1. All comments for each semester were collected in
3 documents corresponding to the 3 open-ended
questions in the questionnaire. It resulted in 10
documents for each type of comments.
2. In order to apply the Likey method, the documents
were preprocessed. English comments and punc-
tuation were removed, numbers were replaced
with num tags and teacher and teaching assistants
names with teachername and taname tags.
3. From each document 50 one-grams (keyphrases
that contain just one term - key term) were ex-
tracted. These key-terms show the main topics of
the students’ comments in each semester.
4. Obtained term-lists were stemmed using the
Snowball stemmer (http://snowball.tartarus.org/)
and irrelevant terms, like slang, were removed.
5. The stemmed term-lists were combined into 3
general term-lists that represent the main topics
of comments through the last 5 years.
This procedure resulted in: a positive comments
term-list with 142 terms; a negative comments term-
list with 199 terms; a term-list of 190 terms represent-
ing main topics of suggestions for improvements.
It is not surprising that the negative comments
term-list is much longer than the term-list from the
positive comments. Students tend to write positive
comments that are more general, but in negative com-
ments they tend to write about specific issues they
were not satisfied with.
The Danish Europarl corpus, a corpus that con-
sists of the proceedings of the European Parliament
from 1996 to present and covers eleven official lan-
guages of the European Union (Koehn, 2005), was
used as the reference corpus to perform Likey.
TextMininginStudents'CourseEvaluations-RelationshipsbetweenOpen-endedCommentsandQuantitativeScores
567
Based on these 3 term-lists 3 corresponding term-
document matrices where created. Each row corre-
spond to a single comment in the collection of com-
ments over 10 semesters, each column corresponds to
a key term and each entry is a tf-idf weight of a key
term in the collection of comments. These matrices
were used for the further analysis.
5.2 Factor Analysis
The statistical analysis was done separately for two
groups of comments, positive and negative feedbacks.
Suggestion comments are expected to correlate a lot
with negative comments.
Factor analysis of the term-document matrices
was done to reveal the underlying structure of the
written feedback from the students. The number of
factors, that should be used, is a tricky question, as
there is no prior knowledge on the possible number
of factors. The Kaiser rule to define the optimal num-
ber of factors, that states that the number of factors to
be extracted should be equal to the number of factors
having variance greater than 1.0, suggests 50 factors
for the dataset of positive comments, while random-
ization method suggests that around 40 factors should
be extracted. Another important issue is interpretabil-
ity of the factors, therefore it was decided to extract
10 factors for each group of comments.
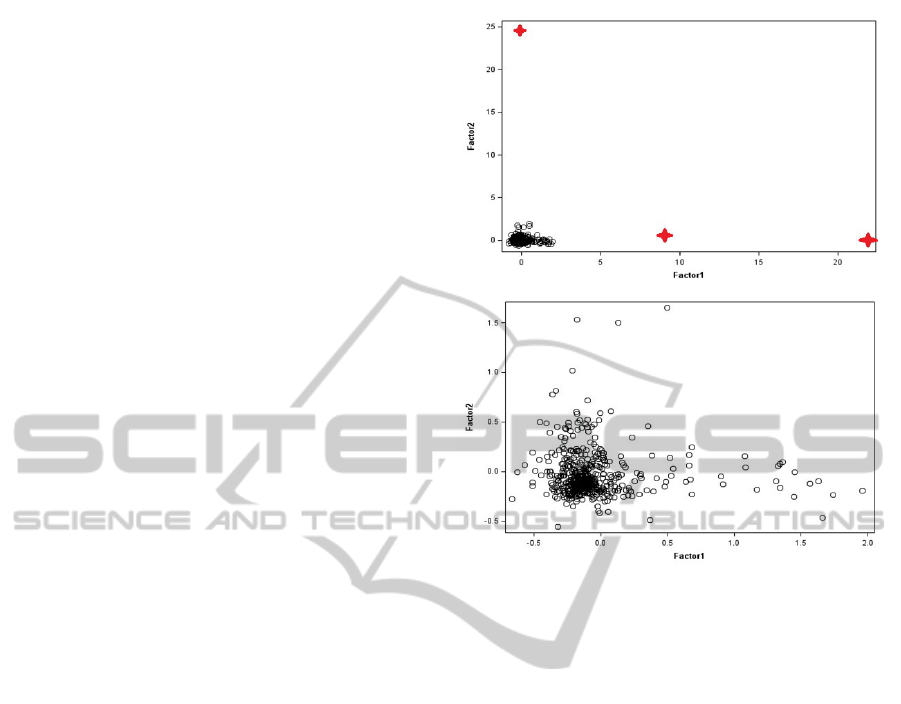
Factor analysis can also be used for outlier detec-
tion (Hodge and Austin, 2004). Observations with
factor scores, the scores of each case (comment) on
each factor (column), greater then 3 in absolute value
were considered as outliers.
Figure 2 shows the difference of factor scores dis-
tribution for the first and the second factor before and
after outlier removal for positive comments dataset.
At least 3 observations that are different from others.
One of the most illustrative examples of an outlier
is a ”positive” comment from a student, who had a
long break in studying: ”I had a longer break from
the studies. . . when I stopped at the time it was among
other things because of this course which frustrated
me a lot since. . . it is nice that this has improved. . .”
This comment really differs from the others in the
style it is written. Other examples of outliers are com-
ments that mentioned a specific issue that is not men-
tioned by any other respondents, or comments where
a specific issue, for example the ”Maple” program-
ming language, is mentioned many times. In total
59 observations were removed from the positive com-
ments data and factor analysis was performed again.
In order to increase interpretability and simplify
the factor structure the varimax rotation of the factor
reference axes, that aims to have as many zero factor
Figure 2: Factor1 scores vs. Factor2 scores for positive
comments before and after outlier removal.
loadings as possible, was done.
Table 3 shows the most important variables (fac-
tor weight higher than 0.25 in absolute value) in each
factor for the positive comments. The presented terms
are translated from danish. Terms with are presented.
Extracted factors can be interpreted as:
• Factor1 - overall course quality in relation to
other courses
• Factor2 - good teacher qualities.
• Factor3 - weekly home assignments - students
were motivated to spend extra hours at home to
understand the material.
• Factor4 - good textbook quality
• Factor5 - blackboard teaching performed by lec-
turer/ presentation of material
• Factor6 - teaching assistant (TA’s) communica-
tion during exercise classes
• Factor7 - weekly question sessions - question ses-
sions are an extra hours, where students can ask
question regarding the course material.
• Factor8 - teaching during exercise classes.
• Factor9 - reflects 2 things: possibility to follow the
course twice a week and appropriate level of home
assignments.
CSEDU2013-5thInternationalConferenceonComputerSupportedEducation
568

Table 3: Rotated factor pattern for positive comments.
Factor1 Factor2 Factor3 Factor4 Factor5
keyterm cor keyterm cor keyterm cor keyterm cor keyterm cor
educational 0,60 skilled 0,44 time 0,56 general 0,48 example 0,51
course 0,50 exciting 0,44 assignments 0,47 view 0,45 blackboard 0,40
control 0,41 professional 0,44 additional 0,47 nice 0,45 teachername 0,39
DTU 0,36 teacher 0,43 week 0,40 read 0,42 topic 0,39
less 0,36 mathematics 0,39 good 0,36 ok 0,38 go through 0,33
lecturer 0,35 communicate 0,38 home 0,36 course 0,38 really/very 0,32
most 0,31 fun 0,33 idea 0,32 little 0,32 theory 0,29
amount 0,27 teachername 0,31 division 0,30 textbook 0,26 statement 0,27
curriculum 0,26 enormous 0,29 understand 0,28 really 0,30 because 0,27
teachername -0,30 Maple 0,27 do 0,26
Factor6 Factor7 Factor8 Factor9 Factor10
keyterm cor keyterm cor keyterm cor keyterm cor keyterm cor
TA 0,63 question session 0,68 lecture 0,36 Monday 0,40 time 0,50
taname 0,59 Tuesday 0,43 really/very 0,35 class 0,36 whole 0,49
good 0,57 week 0,43 exercise 0,33 Thursday 0,34 function/work0,41
communicate0,28 teaching material 0,36 good 0,33 great 0,33 students 0,35
very 0,27 pause 0,34 function/work 0,31 amount -0,27 papershow 0,32
exercises 0,25 course 0,33 material 0,28 home assign. -0,27 fun 0,25
fine 0,33 data bar -0,33 home work -0,31
nice 0,30 nice -0,38 appropriate -0,32
weekly 0,29 Maple -0,39 complexity -0,38
• Factor10 - having a good time being a student at
the course.
For the analysis of the negative comments the
same outlier removal procedure as for the positive
comments was used. It resulted in removing 35 of
the negative comments.
Table 4 shows the most important terms in each
factor, for the negative comments. The factors can be
interpreted as follows:
• Factor1 - Maple as a tool to solve exercises.
• Factor2 - English speaking teaching assistants -
students pointed out that it was harder for them to
write assignments in English and/or to communi-
cate with English speaking teacher assistants.
• Factor3 - dissatisfaction with usage of textbook -
many students argued that examples presented in
the class were taken directly from the book.
• Factor4 - examples to support statements - some
students argue that it was hard to understand some
mathematical subjects without examples.
• Factor5 - not enough TAs for exercise hours
• Factor6 - grading of home assignments - some
students complained that TA’s grade home assign-
ments differently.
• Factor7 - frustrating course - students, that follow
the course are very diverse by their background.
For some of them the course is really frustrating.
• Factor8 - project workload - the course has 2
projects about application of the tools, learned
during the course, to the real world problems.
• Factor9 - last project - there were complaints that
the last project is much harder than the previous.
• Factor10 - course organization issues: classroom,
lecture room and their position on campus.
5.3 Regression Analysis
In order to investigate the relationship between the
quantitative scores and the qualitative feedback an or-
dinal logistic regression model was used. Students
satisfaction and dissatisfaction points can vary in dif-
ferent semesters, therefore it was decided to investi-
gate which factors were important in which semesters.
The number of observations in spring semesters (25-
30 comments) is not enough to perform multivariate
analysis. Therefore, univariate logistic regression was
used for each semester to investigate whether there is
an impact of each particular factor on how students
rate the course. Question A.1.8 (overall course qual-
ity) was used as the response variable.
Table 5 shows which positive factors have a sig-
nificant impact on the way students rate the course.
There were no factors, that had a significant impact on
the overall course score in spring 2011, the semester
TextMininginStudents'CourseEvaluations-RelationshipsbetweenOpen-endedCommentsandQuantitativeScores
569

Table 4: Rotated factor pattern for negative comments.
Factor1 Factor2 Factor3 Factor4 Factor5
keyterm cor keyterm cor keyterm cor keyterm cor keyterm cor
Maple 0,70 course 0,61 explain 0,61 teacher 0,36 help 0,60
tool 0,66 englishspeaking 0,49 book 0,56 statement 0,36 teacher 0,59
pity 0,57 think 0,47 stand 0,54 students 0,33 nature 0,57
solve 0,48 TA 0,40 convergence 0,45 better 0,32 often 0,43
possibility 0,41 should 0,39 new 0,41 example 0,31 exercise 0,39
convergence 0,38 understand 0,37 material 0,39 works 0,26 taname 0,36
exercise 0,38 mathematical 0,36 fully 0,36 similar 0,26 solution 0,34
whole 0,33 DTU 0,31 example 0,34 subjects -0,28 more 0,31
give 0,32 really 0,30 poor 0,32 fully -0,32 hand 0,30
follow 0,30 whole 0,29 read 0,30 difficult 0,29
exam 0,29 Fourier series 0,27 teachername 0,28 example 0,27
used 0,29 lecturing 0,26
Factor6 Factor7 Factor8 Factor9 Factor10
keyterm cor keyterm cor keyterm cor keyterm cor keyterm cor
TA 0,49 frustrating 0,48 used 0,49 harder 0,71 room 0,45
grade 0,44 avoid 0,45 difficult 0,45 go through 0,53 campus 0,44
higher 0,42 though 0,44 derivation 0,39 projects 0,51 group work 0,42
difference 0,36 course 0,43 view 0,38 bad 0,43 one 0,38
assignment 0,34 curriculum 0,38 workload 0,36 teaching 0,39 education 0,31
submit 0,33 review 0,38 read 0,34 works 0,39 count 0,31
though 0,32 go through 0,31 project task 0,31 semester 0,38 opposite 0,31
simple 0,27 need 0,31 too much 0,30 away 0,34 annoying 0,29
example 0,27 mathematics 0,31 points 0,30 very 0,32 problem solving 0,29
whole -0,28 things 0,30 week 0,30 week 0,32 held 0,27
Fourier series -0,33 start 0,28 good 0,27 assignments 0,28 closer 0,26
understand -0,34 enormous 0,27 time 0,25 building 0,26
mathematics -0,39 higher 0,25 very 0,29 mathematics -0,27
Table 5: significance of factors in univariate ordinal logis-
tic regression for question A.1.8 (overall course quality) vs.
factors extracted from positive comments.
F07S08F08 S09 F09 S10 F10 S11 F11 S12
F1
F2 **
F3 ** *
F4 **
F5 **
F6 ** *
F7
F8
F9 *
F10 * * **
* - significant at 10% significance level
** - significant at 5% significance level
when there was a drop in students satisfaction scores
(Figure 1). However, the next semester four fac-
tors: factor2 (teacher qualities), factor3 (weekly home
assignment), factor4 (textbook quality) and factor10
(having a good time being a student at the course) had
a significant impact on overall rating of the course. It
can imply that teachers reacted on results of evalua-
tion and made changes in the course and teaching.
Table 6 shows which of the negative factors had
significant impact on the way students rate the course.
For the spring 2011 semester three negative factors:
factor1 (Maple as a tool to solve exercises), factor5
(not enough TAs for exercise hours) and factor9 (last
project) had a significant impact. It should be noted
that the next semester (fall 2011) none of the negative
factors were significant.
Spring semesters tend to have lower rating than
preceding and subsequent fall semesters (figure 1). A
similar pattern is observed in the analysis of impact of
negative factors on overall course satisfaction: None
of the negative factors had a significant impact in fall
semesters, except fall 2009. Factor9 (last project) ap-
peared to have a significant impact on overall course
satisfaction score in 4 out of 10 semesters. In spring
2011, the new teacher changed the second project
completely, but the problem is not only in complexity
of the project but also in its placement in the busiest
time of the semester, close to the exams period.
Univariate analysis showed that different factors
CSEDU2013-5thInternationalConferenceonComputerSupportedEducation
570

Table 6: Significance of factors in univariate ordinal logis-
tic regression for question A.1.8 (overall course quality) vs.
factors extracted from negative comments.
F07S08F08 S09 F09 S10 F10 S11 F11 S12
F1 *
F2 ** * *
F3
F4 **
F5 ** **
F6 *
F7 ** *
F8 * **
F9 * ** ** *
F10
* - significant at 10% significance level
** - significant at 5% significance level
are correlated with the overall course quality score in
different semesters. It is not surprising, since each
year a new group of students follows the course,
teaching assistants are almost always new and teach-
ers can also make changes from semester to semester.
In order to analyze the relationships between the
students written feedback and other more specific
quantitative evaluations of the course, multivariate lo-
gistic regression analysis was used, controlling for
year and semester.
Table 7 shows which factors, extracted from the
positive comments, had a significant impact on the
different quantitative evaluation scores of the partic-
ular course characteristics (evaluation form A).
Fall semester students, who wrote positive feed-
back, rated questions A.1.3 (teaching material) and
A.1.6 (workload) significantly different from spring
semester students.
For the overall measure of satisfaction with the
course (A.1.8) only one positive factor - factor5 (pre-
sentation of material) had a significant impact, con-
trolling for the semester and year of teaching. There
was no factor that had an impact on A.1.4 (feedback
from teacher) quantitative score.
For the question A1.1 (learning a lot) 3 factors:
factor1 (overall course quality compared to other
courses), factor4 (textbook) and factor5 (presentation
of material) had a significant impact. Many students
appreciate blackboard derivations of theorems and
mathematical statements. The book contains illustra-
tive examples, that helps to understand the theory.
Factor1 (overall course quality compared to other
courses) together with factor6 (teaching assistant
communication) had a significant impact on how stu-
dents evaluated the teaching method (A.1.2.). It sup-
ports the common opinion that teaching assistants
play an important role. It is also supported by the fact
Table 7: Significance of factors in multivariate logistic re-
gressions for course specific questions (Form A) vs. factors
extracted from positive comments.
Factor A.1.1A.1.2A.1.3A.1.4A.1.5A.1.6A.1.7A.1.8
F1 ** ** *
F2 ** *
F3 *
F4 * ** **
F5 * **
F6 ** *
F7
F8 **
F9 **
F10
sem(F) * **
y07 ** *** * *
y08 *
y09 * ** ** **
y10 **
y11 ** *** ** **
* - significant at 10% significance level
** - significant at 5% significance level
*** - significant at 1% significance level
that factor6 together with factor3 (home assignments)
had a significant impact on how students evaluated the
teaching method (A.1.3).
There are 3 factors that had a significant effect
on how students rate the continuity between the dif-
ferent teaching activities (A.1.5): factor1 (overall
course quality compared to other courses), factor2
(teacher qualities) and factor8 (teaching during exer-
cise classes). The year, the course is performed, also
has a significant impact on A.1.5 score. It illustrates
the fact that teachers of the course are constantly
working on improvements of the teaching methods.
For the evaluation of course workload (A.1.6) high
textbook quality (factor4) and complexity of home as-
signments (factor9) had a significant impact, while
prerequisites (A.1.7) teacher qualities (factor2) and
high textbook quality (factor4) were important.
Table 8 shows which factors, extracted from the
negative comments, had a significant impact on the
different quantitative scores of course characteristics.
For the overall course quality score (A.1.8), two
negative factors appeared to be significant: fac-
tor4 (examples to supplement mathematic statements)
at 10% significance level and factor7 (frustrating
course) at 5% significance level.
Factor1 (Maple) and factor2 (English speaking
TAs) appeared to have no significant impact on eval-
uation of any of the course specific characteristics,
when controlling for the time the course were taken.
Factor3 (usage of textbook) is the only negative
factor that had a significant (10%) impact on how stu-
TextMininginStudents'CourseEvaluations-RelationshipsbetweenOpen-endedCommentsandQuantitativeScores
571

Table 8: Significance of factors in multivariate logistic re-
gressions for course specific questions (FormA) vs. factors
extracted from negative comments.
Factor A.1.1A.1.2A.1.3A.1.4A.1.5A.1.6A.1.7A.1.8
F1
F2
F3 ** *** *
F4 ** ** *
F5 ***
F6 * *
F7 ** * ** * **
F8 ***
F9 *
F10 *
sem(F)
y07 **
y08 **
y09 ** * * ** ** * **
y10 * **
y11 * *** ** **
* - significant at 10% significance level
** - significant at 5% significance level
*** - significant at 1% significance level
dents evaluate different teaching activities (A.1.5). It
also had a strongly significant impact on A.1.4 (feed-
back from teacher), together with general frustration
(factor7). Some of the students complained that ex-
amples on the lectures are taken directly from the
book, while for others it made reading of the text-
book was an easy repetition of the lectures. Question
A.1.5 is also rated differently in different years, that
illustrates teacher’s constant work on improvement of
teaching methods.
Factor5 (not enough teaching assistants) had a
significant effect only on how students evaluate the
teaching method (A.1.3) together with factor7 (frus-
trating course). In spring 2012 teachers tried to form
groups for exercise sessions according to students
study lines, to make groups more uniform. But so
far it does not have any effect.
For quantitative evaluation scores on question
A1.1 (learning a lot) factor6 (grading of home assign-
ments) and factor7 (frustrating course) have a signifi-
cant impact. Factor8 (project workload) had a signif-
icant effect only on how students evaluate the course
workload (A.1.6) together with factor4 (examples to
support statements).
For the rating of teaching method (A.1.2.) 5 neg-
ative factors had a significant effect: factor3 (usage
of textbook), factor6 (grading of home assignments),
factor7 (frustrating course), factor9 (last project) and
factor10 (course organization issues). The last two
had an effect only on teaching method evaluation.
Evaluation of course prerequisites (A.1.7) is signifi-
cantly effected only by one negative factor - factor4
(examples to supplement mathematic statements).
To summarize, factors, extracted from the nega-
tive comments, had more significant impact on how
students quantitatively evaluate different course qual-
ities, than factors extracted from positive comments.
The year, the course is taken, also had a significant
effect on rating of different course qualities.
6 DISCUSSION
The present study is a first step of analysis of relation-
ships between the quantitative and qualitative parts of
course evaluation. Further investigations should in-
clude analysis of the relationship between the com-
ments and questions the teacher satisfaction question-
naire. It is often reflected in comments, that teachers
and teacher assistants play an important role in stu-
dents satisfaction or dissatisfaction with a course.
Diversity of the students is also an interesting fac-
tor that should be taken into account for in future re-
search, in order to investigate whether student specific
characteristics such as age, gender, years of educa-
tion, study line, etc have relationship with the way
students evaluate teachers and courses. The diversity
of the students backgrounds, ranging from mathemat-
ical engineering students, to design and innovation
students, may also influence on the high dimensional-
ity of the factorial pattern. Thus it would be of interest
to adjust for the student background or to preprocess
the data by clustering students.
Regarding the text-mining method used in the
analysis, one of the drawbacks is that reference the
corpus used in the Likey key phrase extraction is a
corpus of very formal language of the European Par-
liament documentation, while student written com-
ments are usually informal, tend to have some slang
phrases and have a lot of course specific technical
terms, that get higher weight than other terms. An-
other thing is that the Likey method is a purely sta-
tistical tool, it does not take synonyms into account.
Usage of a more sophisticated main topic extraction
tool can improve the results.
7 CONCLUSIONS
The work makes an analysis of questionnaire data
from student-course evaluations from, in particularly
the analysis of text from open-ended students com-
ments ant their connection to the quantitative scores.
It was found that factor analysis can help to find
comments that are outliers, i.e. really differs from the
CSEDU2013-5thInternationalConferenceonComputerSupportedEducation
572

other in the style it is written or comments about some
specific issue that is not mentioned by any other re-
spondent. Furthermore, this method helps to find and
summarize the most important points of students sat-
isfaction or dissatisfaction.
It was shown that there is a relationships between
some of the factors, extracted from positive and from
negative comments, and students’ overall satisfaction
with the course, and that this relationship changes
with the time. It was also shown that different factors
have an impact on rating of different course charac-
teristics.
In order to make better responses on students dis-
satisfaction points and improve courses for the future
students, a deeper analysis than just averaging the
quantitative data from student evaluation, should be
done. Examining the students open-ended feedback
from evaluation can help to reveal patterns that can, if
properly read, be used to improve courses and teach-
ing quality for future students.
ACKNOWLEDGEMENTS
Timo Honkela and Mari-Sanna Paukkeri from De-
partment of Informatics and Mathematical Modeling,
Aalto University, Helsinki, Finland for helping under-
standing the text-mining methods.
REFERENCES
Abrami, P. C. (2001). Improving judgments about teach-
ing effectiveness using teacher rating forms., volume
[Special issue]. New Directions for Institutional Re-
search, chapter Theall, P.C. Abrami, and L.A. Mets
(Eds.). The student ratings debate: Are they valid?
How can we best use them?, pages 59–87.
Abrami, P. C., dApollonia, S., and Rosenfield, S. (2007).
The dimensionality of student ratings of instruction:
what we know and what we do not. Perry, R.P.,
Smart J.C., editors: effective teaching in higher ed-
ucation: research and practice. New York: Agathon
Press, pages 385–456.
Alhija, F. N. A. and Fresko, B. (2009). Student evaluation of
instruction: What can be learned from students’ writ-
ten comments? Studies in Educational Evaluation,
35(1):37–44.
Cohen, P. A. (1981). Student rating of instruction and stu-
dent achievement. Review of Educational Research,
51(3):281–309.
Damerau, F. (1993). Generating and evaluating domain-
oriented multi-word terms from text. Information Pro-
cessing and Management, 29:433447.
Feldman, K. A. (1989). The association between student
ratings of specific instructional dimensions and stu-
dent achievement: Refining and extending the syn-
thesis of data from multisection validity studies. Re-
search in Higher education, 30(6).
Greene, W. H. (2006). Econometric Analysis. Prentice Hall,
5th edition.
Hair, J. F., Black, W. C., Babin, B. J., Anderson, R. E.,
and Tatham, R. L. (2006). Multivariate Data Analysis.
Prentice Hall, 6th edition.
Hodge, V. and Austin, J. (2004). A survey of outlier detec-
tion methodologies. Artif. Intell. Rev., 22(2):85–126.
Hodges, L. C. and Stanton, K. (2007). Changing practices
in evaluating reaching. a practical guide to improved
faculty performance for promotion/tenure decisions.
Innovative Higher Education, 31(5):279–286.
Koehn, P. (2005). Europarl: A parallel corpus for statistical
machine translation. MT Summit, page 7986.
Lewis, K. G. (2001). Making sense of written student com-
ments. New Directions for Teaching and Learning,
87:25–32.
Likert, R. (1932). A technique for the measurement of atti-
tudes. Archives of Psychology, 140:155.
Manning, C. D. and Schutze, H. (1999). Foundations of
statistical natural language processing. MIT Press.
McKeachie, W. J. (1997). Student ratings: Their validity of
use. American Psychologist, 52:1218–1225.
Paukkeri, M.-S. and Honkela, T. (2010). Likey: Unsuper-
vised Language-Independent Keyphrase Extraction.
In Proceedings of the 5th International Workshop on
Semantic Evaluation (SemEval), pages 162–165, Up-
psala, Sweden. Association for Computational Lin-
guistics.
Paukkeri, M. S., Nieminen, I. T., Pll, M., and Honkela,
T. (2008). A language-independent approach to
keyphrase extraction and evaluation. In In Proceed-
ings of COLING.
Romero, C. and Ventura, S. (2007). Educational data min-
ing: A survey from 1995 to 2005. Expert Systems with
Applications, 33(1):135146.
Salton, G. and Buckley, C. (1988). Term-weighting ap-
proaches in automatic text retrieval. Information Pro-
cessing and Management, 24:513523.
Seldin, P. (1999). Changing practices in evaluating reach-
ing. a practical guide to improved faculty performance
for promotion/tenure decisions. Bolton, MA: Anker.
Sheehan, E. and DuPrey, T. (1999). Student evaluations of
university teaching. Journal of Instructional Psychol-
ogy, 26(3):135146.
Wright, R. (2006). Student evaluations of faculty: Concerns
raised in the literature, and possible solutions. College
Student Journal, 40(2):417–422.
TextMininginStudents'CourseEvaluations-RelationshipsbetweenOpen-endedCommentsandQuantitativeScores
573
