
Predicting Students’ Examination Performance with
Discovery-embedded Assessment using a Prototype Diagnostic Tool
Kai Pan Mark, Lilian L. P. Vrijmoed and Paula Hodgson
City University of Hong Kong, Kowloon Tong, Kowloon, Hong Kong
Keywords: Diagnostic Tool, Prediction of Examination Achievement, E-Social Networking.
Abstract: Early detection and provision of feedback on learners’ performance are essential mechanisms to allow
learners to take prompt action to improve their approach to learning. Although students may learn how they
perform in mid-term quizzes, the results cannot reflect how they might perform in the final examination.
However, quiz results with set answers cannot illustrate the comprehensive skills and knowledge that are
expected in university study. This paper reports on the use of a diagnostic tool to analyse the process of
students working on a discovery-embedded assessment task in the collaborative learning environment of a
microbiology course. The diagnostic tool identified that those learners who performed less well in the
assessment tasks also performed less well in the final examination. This tool can provide early detection of
those facing learning challenges in comprehensive assessment tasks, so that educators can provide
appropriate support.
1 INTRODUCTION
Learners nowadays have had a range of experiences
of using digital technology since they were very
young (Prensky, 2001). Although many of the
devices used have been for entertainment,
information retrieval and social networking, they
have also been widely used for educational
purposes. Technology has been widely used in
universities in Hong Kong, and all universities have
had institution-wide platforms that enable teaching
faculty to communicate and share resources with
their students. This allows educators to consider
alternative learning experiences so that they can be
better engaged and have more opportunities to
demonstrate intended learning outcomes for courses.
Using technology for assessment, such as online
quizzes, is becoming more popular, because these
can be used to measure breadth of knowledge and
can provide feedback quickly to students (Bierer et
al., 2008), and this undoubtedly provides timely
feedback to students (Brady, 2005; Nicol, 2007).
Although online quizzes may give teaching faculty
some indication of student performance, students
cannot demonstrate skills in explanation, analysis,
evaluation or creating new concepts through quizzes.
Teaching faculty therefore design assessment tasks
that facilitate the demonstration of higher-order
thinking by students, as required in university study.
Unlike with online quizzes, the initial challenge for
teaching faculty is the lack of resources to provide
timely feedback to individual students. Feedback
through peer assessment may be incorporated so that
students can provide comments and suggestions for
individuals or peer groups on their performance
(Hodgson and Chan, 2010). However, good
preparation and training of students is necessary if
reliable peer rating and feedback is to be expected
(Xiao and Lucking, 2008).
In considering alternative options for engaging
learners and providing feedback for collaborative
learning, Web 2.0 tools such as blogs, wikis and
forums are often used in university courses. These
social media support personalization, collaboration,
social networking, social presence and collective
wisdom when participants interact with one another
(Dabbagha and Kitsantas, 2012). Many different
successful cases of social media adoption have been
reported in the literature across different disciplines,
including business (Barczyk and Duncan, 2012),
medical and veterinary (Coe et al., 2012), and
science, technology, engineering, and maths
(STEM) education (Ahrama et al., 2011). The
Committee of Inquiry into the Changing Learner
Experience (2009) found that although learners are
361
Pan Mark K., Vrijmoed L. and Hodgson P..
Predicting Students’ Examination Performance with Discovery-embedded Assessment using a Prototype Diagnostic Tool.
DOI: 10.5220/0004389203610368
In Proceedings of the 5th International Conference on Computer Supported Education (CSEDU-2013), pages 361-368
ISBN: 978-989-8565-53-2
Copyright
c
2013 SCITEPRESS (Science and Technology Publications, Lda.)

expected to be participatory and deploy appropriate
technical competence in using the applications for
academic purposes, some may not have the essential
digital literacy or may lack cognitive capabilities
such as critical evaluation and therefore adopt a
casual approach to evaluating information.
Therefore, it is necessary for teaching faculty to
make early diagnosis of student learning behaviour.
Different technical solutions have been
developed to help teaching faculty to detect students
who encounter learning challenges at an early stage
so as to provide just-in-time supportive measures.
Patterns of individual student activity working
through the e-learning platform can be tracked
through the system log. Student behaviour is
determined by a number of quantitative indicators,
such as frequency of log-in, and frequency of
various online activities such as postings contributed
to online discussions, blogs and wikis. Jong et al.
(2007) analysed learners’ behaviour, including time
spent reading discussion postings, the number of
articles submitted and frequency of log-in. In some
sophisticated learning diagnostic systems, accuracy
of content contributed by learners is evaluated
(Hwang et al., forthcoming).
IT solutions can be implemented to analyse
learners’ behaviour and visualize interactions
between individuals and groups. Arnold and Paulus
(2010) identified a number of metrics that impact on
learning performance: the number of postings in
forums, modelling and feedback (i.e. replying to
postings), and interactions (i.e., replying to replies,
which pertains to various forms of collaboration).
One feasible solution is to measure and interpret
these metrics to construct a quantitative index to
identify students with learning challenges.
In addition, factors such as user-friendliness and
timeliness of analysis should be considered when
designing a diagnostic tool to predict student
performance. Perceived usefulness and perceived
ease of use are postulated as critical factors in the
Technology Acceptance Model (Davis, 1989), and
the latter determines the readiness of users to accept
adoption of the system. Timeliness of analysis is
equally important, because supportive actions should
be provided at an early stage. However, timeliness
may be compromised by the analytical accuracy of a
diagnostic tool. Lui et al. (2009) assert that
timeliness should be emphasized more than
accuracy, because decision making on types of
support provided can be estimated through the broad
prediction of levels of student performance attained.
Considering both the user-friendliness and
timeliness of a diagnostic tool, we report the
development of a prototype that can be used to
diagnose and predict learners’ performance. The
objectives of the prototype are to (1) evaluate learner
contributions in collaborative work, (2) analyse
learner engagement in the process during online
activities, (3) predict learner performance at the end
of the course through visual presentation of
diagrams, and (4) alert teaching faculty to take
action early for learners who may encounter learning
challenges.
2 DEVELOPMENT OF
DIAGNOSTIC TOOL:
AN ACTION DESIGN
RESEARCH APPROACH
Agile methodologies are commonly adopted as the
development model for providing ‘quick-and-dirty’
solutions because of rapid solution delivery, efficient
evaluation, instant modification and ease of
maintenance (Beck, 1999). Combining action
research and design science (Hevner and Chatterjee,
2010) methodologies, Action Design Research
(ADR) (Sein et al., 2011) provides the agility and
capability for extensive user input from different
stakeholders, in which an iterative process takes a
holistic view from the perspectives of educators,
technologists and stakeholders with dual roles, e.g.,
teaching staff with strong technology backgrounds.
It is essential to have iteration of modifications
based on feedback from various stakeholders, given
the exploratory nature of the development of the
prototype, in order to truly deliver a solution to solve
the problems faced by stakeholders.
Analysis, design and development of our
diagnostic tool follows the set of guidelines
postulated in the ADR approach. Discussion on the
four interconnected stages and seven underlying
principles, as suggested by Sein et al. (ibid.) are
presented in the subsections.
2.1 Stage 1: Problem Formulation
The first stage of ADR involves identification of
problems by the researchers, often from the
practitioners’ perspectives. Stage one involves two
principles, as described below.
Principle 1: Practice-inspired Research. The
research originates from a problem or an issue that
has practical value. This usually involves attempts to
solve problems happening in real life by developing
IT solutions.
CSEDU2013-5thInternationalConferenceonComputerSupportedEducation
362

In the case of teaching and learning in an
institutional context, large class size (often involving
more than 100 students) is at the root of many issues
that arise (Gleason, 2012). Providing timely and in-
depth formative feedback to individual students,
especially during the continuous assessment process,
becomes difficult for instructors (Cole and Spence,
2012). Moreover, it is extremely difficult to monitor
the progress of individual students’ learning.
Principle 2: Theory-ingrained Artefact. The
researchers then aim to structure the problem.
Afterwards, they identify solution possibilities and
suggest design guidelines to deliver the solution.
In this case, the problem is structured more
accurately: the development of a prototype
diagnostic tool to predict students’ examination
achievements. Most possibly, this prototype makes
use of social networking analysis techniques and
should be relatively easy for use. Results of the
diagnosis should be easy to read and interpret, even
for educators without a technical background.
2.2 Stage 2: Building, Intervention
and Evaluation
The second stage in ADR involves generating the
initial design of the IT artefact, i.e., a holistic view
on IT and its application for socio-economic
activities that extend beyond the IT solution itself
(Orlikowski and Lacono, 2001). This stage involves
three principles: guiding participation from different
stakeholders, and continuous evaluation and input
from these stakeholders.
Principle 3: Reciprocal Shaping. The
organizational and technical domains exert
inseparable influences on each other. This implies
that the organizational settings (e.g., culture and
practices) have a significant impact on the technical
design of solutions. Similarly, technical solutions
have a long-term impact on organizational culture
and practices.
In this case, departmental settings and subject-
specific settings play an important role in the design
of technical solutions. For example, in an academic
department with a strong technical background,
sophisticated functionalities offered by the system
would be dominant. On the other hand, educators’
usage experience (UX) would be more favoured than
‘geek’ functionalities without good UX.
Principle 4: Mutually Influential Roles. The
stakeholders in an ADR project should learn from
others with different roles. Stakeholders often carry
more than one identity, e.g., as a researcher and a
practitioner conducting front-line duties.
In the development of the prototype diagnostic tool,
stakeholders had different roles: a subject-domain
expert in microbiology, an educational practitioner,
an e-learning consultant, a technical developer, an
educational researcher and an information systems
researcher. Some researchers had multiple roles: the
subject-domain expert in microbiology was also an
educational practitioner and educational researcher,
while the e-learning consultant was also an
educational practitioner and information systems
researcher.
Principle 5: Authentic and Concurrent
Evaluation. Instead of evaluating software
development at fixed milestones under traditional
software engineering models, e.g., waterfall model
(Pressman, 2010), evaluation and modification of
the prototype should be ‘interwoven’ at every stage
of software development, carefully taking feedback
from different stakeholders.
Evaluation of this prototype has been conducted
continuously during the development cycle.
Typically, the user interface has been optimized to
cater for the needs of subject-domain experts in
microbiology, who are usually from non-IT
backgrounds by presenting controls and results in a
graphical format. The metric for evaluating the
social networking strength of students was fine-
tuned during development to provide more accurate
predictions, e.g., the effect of lurking behaviour in
the online activities (Weller et al., 2005).
2.3 Stage 3: Reflection and Learning
The third stage of ADR extends the solutions built in
the previous stage from a specific problem to a more
generalized context. It should be noted that this stage
is not linear with the previous stage but happens in
parallel with the previous two stages. One important
task in this stage is to modify the whole ADR
process and future directions continuously according
to the experience and lessons learned from the
previous two stages.
Principle 6: Guided Emergence. The deliverable
combines the continuous effort by all stakeholders
and reflects the design that iteratively consolidates
the input from concurrent evaluations in the previous
stages. The final deliverable, therefore, reflects the
organizational use, perspectives and stakeholders’
preferences.
During the development stage of this prototype,
different stakeholders provided continuous effort in
testing and evaluating, similar to the prototyping
model adopted in software engineering (Pressman,
2010). Extensive input having been received and
PredictingStudents'ExaminationPerformancewithDiscovery-embeddedAssessmentusingaPrototypeDiagnosticTool
363

reflected in the prototype, this was then ready for
trial on additional courses.
2.4 Stage 4: Formalization of Learning
The final stage of ADR formalizes the learning in
the whole ADR project and presents knowledge in
the form of general solutions to a wider set of
problems. Often, the experience and lessons learned
are presented to the researchers’ and the
practitioners’ community in the form of IT artefact
and research papers.
Principle 7: Generalized Outcomes. Sein et al.
(2011) explicitly recommend three deliverables in
this stage: (1) generalization of the problem
instance, (2) generalization of the solution instance,
and (3) derivation of design principles from the
design research outcomes (p.44). These are
presented in the form of technical solutions (e.g.,
systems), documents (e.g., best practice and
guidelines) and research papers.
In the context of this ADR project on diagnostic
tool development, the solutions are presented as (1)
a prototype that can be fitted into similar courses
that include similar teaching and learning activities;
(2) sharing in formal and informal sessions,
institutionally and externally; and (3) presentation of
research findings in conferences and journals.
The prototype diagnostic tool has been adopted
in one microbiology course. The tool should fulfil
the objectives as identified in the first stage of the
ADR process. It should be able to predict student
performance and provide a relatively easy-to-use
tool for educators. The next section presents the
background of this course.
3 BACKGROUND OF
MICROBIOLOGY COURSE
This study was conducted with 77 students in a first-
year course on microbiology. Among a variety of
assessment tasks in this course, a four-week
discovery-embedded assessment task was designed
to enhance the engagement of students in their
learning of microbiology and was weighted 20
percent of the coursework, compared with 55
percent for the final examination. In the task,
students were asked to identify activities or through
exploration and observation from their daily lives
that were connected with microbiology. They were
expected to work in groups to describe the
connection between the identified activities or
observations with the activity of microbes in
comprehensible English and evaluate the positive or
negative effects of the activities or observations in
relation to the microbes.
To complete the coursework, students had to
submit six cases, including three photos and three
video clips, each clip lasting no longer than 30
seconds. They had to write some notes (between 30
and 80 words) to describe the activity or
observation, stating the relationship between the
subject matter in each case with a brief description
of the outcome (positive or negative impact) of the
activity being observed. In addition to posting all
cases to a blog, students had to provide comments to
six peer submissions so as to build critical evaluative
skills and broaden the scope of their experience.
After the deadline for postings, having made
discoveries, observations from their daily lives and
critiquing peers on their submissions, the diagnostic
tool was used to examine the interactions between
students in the blog, and charts were generated to
identify active and less active students.
4 ANALYSIS IN AN
INTERACTIVE AND VISUAL
WAY THROUGH THE
PROTOTYPE DIAGNOSTIC
TOOL
To fulfil these objectives, the tool analysed
interactions between students in the online
collaborative activities and presented the analysis in
the form of an index and interactive maps.
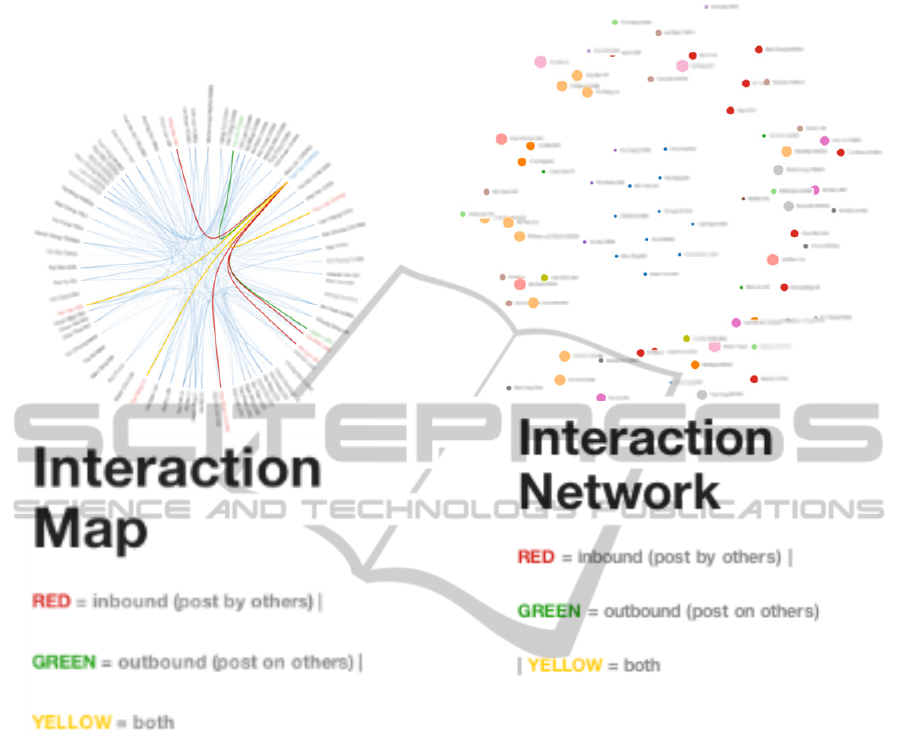
Figure 1 presents the networking diagram
showing the overall connectivity of students in the
online activities in the microbiology course. The
lines show the pattern of interactions between
students. The interconnection between individual
students in the online activities are displayed when
the node is clicked, showing the nature of
collaboration between students. All interactions
between students are displayed as light grey lines in
the system. Activities performed by an individual
student would be displayed when the mouse cursor
pointed to his/her name. A red line connecting two
students implies that the other student made a
comment to the student being analysed (inbound). A
green line denotes that the student being analysed
made a comment to the other student (outbound).
When two students had both inbound and outbound
activities, the line is displayed in yellow (bi-
directional). Student identities cannot be disclosed
CSEDU2013-5thInternationalConferenceonComputerSupportedEducation
364
due to the privacy legislation in Hong Kong.
Therefore, parts of student names have been blurred
in the figures shown here.
Figure 1: Connectivity of students on the microbiology
course.
Apart from showing the nature of connectivity,
the system can show the ‘intensity’ (i.e., number of
postings) of student participation. When an
individual node is clicked, the social network of the
student will be displayed. Figure 2 shows the initial
interaction network generated by the tool. The size
of a node indicates the intensity of student
participation in the online activities. The small nodes
at the middle indicate ‘disconnected’ students.
Different colours are used to indicate students with
similar intensity of participation.
Figure 3 shows a display of the direction and
nature of posts. The same colour notations (red,
green and yellow) are used to represent inbound,
outbound and bi-directional comments made in
Figure 1. Similarly, the size of each node indicates
the intensity of student participation in the online
activities.
Figure 2: Intensity of student participation.
Dawson (2010) acknowledges that monitoring
and visualizing the student online community would
be an effective way to identify “at risk” students.
Early and effective detection of these “at risk”
students allows educators to prepare better remedial
actions before it is too late for the final major
assessment task. The “disconnected” students (i.e.,
students who seldom take part in the online
collaborative activities) may represent those who are
less engaged in a course, and will probably be those
who require more attention from educators.
5 DIAGNOSTIC RESULT OF THE
MICROBIOLOGY COURSE
The metric adopted to evaluate the accuracy of the
diagnostic tool is the percentage of ‘at risk’ students
identified by the tool. These students we describe as
less engaged for the paper. Theoretically, the tool
PredictingStudents'ExaminationPerformancewithDiscovery-embeddedAssessmentusingaPrototypeDiagnosticTool
365
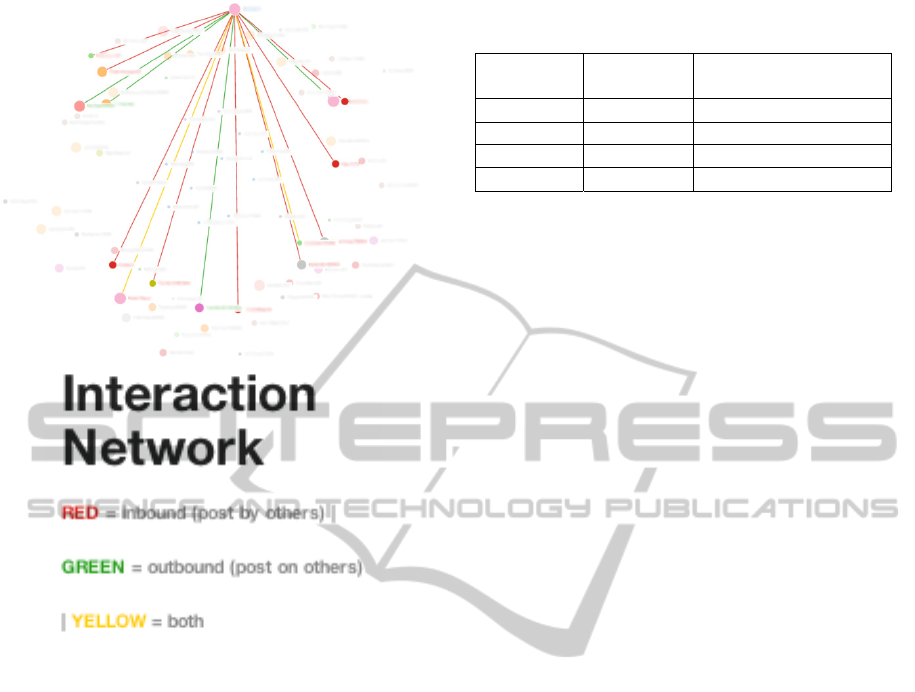
Figure 3: Direction and nature of posts contributed by
individual students.
should be able to predict those students who achieve
below the median score in assessment tasks if no
action is taken. The result of the final open-book
examination was used as the benchmark, as the
coursework component was related to the online
activities.
Although 77 students enrolled, two students
dropped out, and 75 enrolments were recorded at the
final examination. Examination results for the whole
class were divided into four quartiles in ascending
order of scores: Q1 (lowest 25%), Q2 (next 25%
below the median), Q3 (next 25% above the median)
and Q4 (top 25%). Fourteen out of the 37 (37.8%)
less engaged students identified by the tool
performed at or below the 50th percentile in the final
examination.
The purpose of the
prototype diagnostic tool was
to provide early diagnosis to educators so that timely
action could be taken to address students’ learning
difficulties. However it was not designed to provide
a very accurate prediction of student performance in
the final examination. Like many other forecasts,
Table 1: ‘At risk’ students as identified by the prototype
diagnostic tool in different quartiles.
Quartile
No. of
students
‘Less en
g
a
g
ed’
students identified
Q1 18 7
Q2 19 7
Q3 19 3
Q4 19 1
false alerts for some outlier cases cannot be avoided,
and four students were identified in Q3 and Q4 in
this case. Rapid prediction of student performance
who fell into Q1 and Q2 would be of significant
value to educators, because use of the tool has the
potential to reduce significantly the effort needed to
identify the less engaged students.
Interpreting the number of posts in the online
collaborative activities may provide a quantitative
indicator of student engagement and participation.
However, it does not provide comprehensive
information, because the quality of online postings is
not taken into account. For example, some postings
on interesting topics may attract more responses for
discussion. Therefore, it is necessary to evaluate
students’ contributions in a more comprehensive
way, including evaluating the original posts by
students, replies by others, and subsequent responses
between students.
6 DISCUSSION
The purpose of designing this system was to provide
an efficient way of identifying students with learning
needs under tight time and human resource
constraints, and to provide them with timely advice
and help. This tool can be used primarily for
diagnosis and should not be used solely to predict
examination performance.
Application of this diagnostic tool extended
beyond predicting the less engaged students to
tracing interactions of these students in the
associated social network in the study. It was
observed that the less engaged students had few
interactions and fewer students to interact with. This
implies that the social network of those students was
relatively closed. Educators can make use of the
interaction network map generated by the diagnostic
tool to trace the social network of the less engaged
students, as students in the same social network may
also be potentially ‘at risk’. They can proactively
make use of this tool to provide formative and
timely feedback to those students, and to help them
to overcome difficulties encountered in learning.
CSEDU2013-5thInternationalConferenceonComputerSupportedEducation
366

7 LIMITATIONS AND NEXT
STEPS
We acknowledge that there are a few limitations on
the existing version of the diagnostic tool. This
includes no screening for quality of content in the
postings, the tool providing only visual analysis of
the nature and intensity of postings between
students. The tool counts all postings; however, the
content of some postings may not have significant
value, e.g., postings such as ‘thank you’ or ‘I agree’
with no further explanation or justification. Second,
it does not analyse when postings are submitted. It
was observed that many postings were submitted
shortly before the cut-off time for the online
activities. Active learners may consider various
learning opportunities and show engagement across
the study period, and they would contribute postings
during the whole period of the online task.
Subsequently, students had multiple moments of
engagement that would allow them to think, reflect
on and review the discussion.
8 CONCLUSIONS
Teaching large classes is common in universities,
and educators are expected to provide timely
feedback. Automated computer-generated feedback
may be perceived as a plausible option. However,
educators may not be able to identify the less
engaged students before the marking of final term
papers. Emerging from the educational practitioner’s
needs, a diagnostic tool for predicting student
academic engagement was developed iteratively
using the ADR approach. The pilot run of the tool
showed the connections between students in the
online activities. It successfully predicted 37.8% of
the less engaged students who performed below the
median in the final examination. However, the use
of the diagnostic tool should provide timely
assistance to those students, and to further identify
other potential less engaged students through social
network analysis. Within the social network of the
course, there was a tendency for students producing
similar performances to collaborate and connect
with each other. This may be explained by the
traditional English proverb, ‘birds of a feather flock
together’, which is also exhibited in users’ blogging
activities. Li and Chignell (2010) postulate that
bloggers have a tendency to interact with other
bloggers (e.g., replying to and continuing
discussions) who share similar interests. By
engaging active learners, educators can consider
involving them to provide early assistance or
mentoring to the less engaged students.
The next steps towards improving this diagnostic
tool would include fine-tuning the metric for
analysis and automatic importation of collaborative
content from the learning management system. It is
essential to keep track of posting time to the system,
so that we can evaluate the effects of last-minute
postings. Modification of the existing evaluation
metrics would be needed. To further automate the
process of importing collaborative data, an
application programming interface (API) may be
developed to reduce manual data importing before
analysis.
ACKNOWLEDGEMENTS
This project is supported by City University of Hong
Kong Teaching Development Grant (Project No.
6000383)
REFERENCES
Ahrama, T., Karwowskia, W., and Amaba, B. (2011).
Collaborative systems engineering and social-
networking approach to design and modelling of
smarter products. Behaviour and Information
Technology, 30(1), 13–26. doi:
10.1080/0144929X.2010.490957.
Arnold, Nike, and Paulus, Trena (2010). Using a social
networking site for experiential learning: appropriating,
lurking, modeling and community building. The
Internet and Higher Education, 13(4), 188–96. doi:
10.1016/j.iheduc.2010.04.002.
Barczyk, Casimir C., and Duncan, Doris G. (2012). Social
networking media: an approach for the teaching of
international business. Journal of Teaching in
International Business, 23(2), 98–122. doi:
10.1080/08975930.2012.718703.
Beck, Kent (1999). Embracing change with extreme
programming. IEEE Computer, 32(10), 70–7. doi:
10.1109/2.796139.
Bierer, S. Beth, Dannefer, Elaine F., Taylor, Christine,
Hall, Phillip, and Hull, Alan L. (2008). Methods to
assess students’ acquisition, application and
integration of basic science knowledge in an
innovative competency-based curriculum. Medical
Teacher, 30(7), 171–7. doi:
10.1080/01421590802139740.
Brady, Anne-Marie (2005). Assessment of learning with
multiple-choice questions. Nurse Education in
Practice, 5(4), 238–42. doi:
10.1016/j.nepr.2004.12.005.
PredictingStudents'ExaminationPerformancewithDiscovery-embeddedAssessmentusingaPrototypeDiagnosticTool
367

Coe, Jason B., Weijs, Cynthia A., Muise, Amy,
Christofides, Emily, and Desmarais, Serge (2012).
Understanding veterinary students’ use of and attitudes
toward the social networking site, Facebook, to assist
in developing curricula to address online
professionalism. Journal of Veterinary Medical
Education, 39(3), 297–303. doi: 10.3138/jvme.0212-
016R.
Cole, Jonathan S., and Spence, Stephen W.T. (2012).
Using continuous assessment to promote student
engagement in a large class. European Journal of
Engineering Education, 37(5), 508–25. doi:
10.1080/03043797.2012.719002.
Committee of Inquiry into the Changing Learner
Experience. (2009). Higher education in a Web 2.0
world. Retrieved 13 Dec. 2012, from
http://www.jisc.ac.uk/media/documents/publications/h
eweb20rptv1.pdf.
Dabbagha, Nada, and Kitsantas, Anastasia (2012).
Personal learning environments, social media, and
self-regulated learning: a natural formula for
connecting formal and informal learning. The Internet
and Higher Education, 15(1), 3–8. doi:
10.1016/j.iheduc.2011.06.002.
Davis, Fred D. (1989). Perceived usefulness, perceived
ease of use, and user acceptance of information
technology. MIS Quarterly, 13(3), 319–40.
Dawson, Shane (2010). ‘Seeing’ the learning community:
an exploration of the development of a resource for
monitoring online student networking. British Journal
of Educational Psychology, 41(5), 736–52. doi:
10.1111/j.1467-8535.2009.00970.x.
Gleason, Jim (2012). Using technology-assisted
instruction and assessment to reduce the effect of class
size on student outcomes in undergraduate
mathematics courses. College Teaching, 60(3), 87–94.
doi: 10.1080/87567555.2011.637249.
Hevner, Alan R., and Chatterjee, Samir (2010). Design
Research in Information Systems: Theory and Practice
(vol. 22). New York, London: Springer.
Hodgson, Paula, and Chan, Lai Kuen (2010) Building
professional skills through peer group assessment. The
International Journal of Interdisciplinary Social
Sciences. vol. 5, issue 4, 409–18.
Jong, Bin-Shyan, Chan, Te-Yi, and Wu, Yu-Lung (2007).
Learning log explorer in e-learning diagnosis. IEEE
Transactions on Education, 50(3), 216–28. doi:
10.1109/TE.2007.900023.
Li, Jamy, and Chignell, Mark (2010). Birds of a feather:
how personality influences blog writing and reading.
International Journal of Human–Computer Studies,
68(9), 589–602. doi: 10.1016/j.ijhcs.2010.04.001.
Lui, Kimman, Chan, Keith C.C., and Mark, Kai-Pan
(2009). Association between web semantics and
geographical locations: evaluate internet information
consistency for marketing research. In M.M. Cruz-
Cunha, E.F. Oliveira, A.J. Tavares and L. G. Ferreira
(eds), Handbook of Research on Social Dimensions of
Semantic Technologies and Web Services (pp. 158–81).
Hershey, PA: IGI Global.
Nicol, David (2007). Eassessment by design: using
multiplechoice tests to good effect. Journal of
Further and Higher Education, 31(1), 53–64. doi:
10.1080/03098770601167922.
Orlikowski, Wanda J., and Lacono, C. Suzanne (2001).
Research commentary: desperately seeking the ‘IT’ in
IT research—a call to theorizing the IT artifact.
Information Systems Research, 12(2), 121–44.
Prensky, Marc (2001). Digital natives, digital immigrants.
On the Horizon, 9(5), 1–15.
Pressman, Roger S. (2010). Software Engineering: A
Practitioner’s Approach (7th edn). New York:
McGraw-Hill.
Sein, Maung K., Henfridsson, Ola, Purao, Sandeep, Rossi,
Matti, and Lindgren, Rikard (2011). Action design
research. MIS Quarterly, 35(1), 37–56.
Weller, Martin, Pegler, Chris, and Mason, Robin (2005).
Use of innovative technologies on an e-learning course.
The Internet and Higher Education, 8(1), 61–71. doi:
10.1016/j.iheduc.2004.10.001.
Xiao, Yun, and Lucking, Robert (2008). The impact of
two types of peer assessment on students’ performance
and satisfaction within a Wiki environment. The
Internet and Higher Education, 11(3–4), 186–93. doi:
10.1016/j.iheduc.2008.06.005.
CSEDU2013-5thInternationalConferenceonComputerSupportedEducation
368
