
A Single Performance Characteristic for the Evaluation
of Seeker Tracking Algorithms
Leo Doktorski, Eckart Michaelsen and Endre Repasi
Fraunhofer-IOSB, Gutleuthausstrasse, 1, 76275 Ettlingen, Germany
Abstract. This paper presents a single numerical performance characteristic for
the evaluation of seeker tracking algorithms. It concentrates on ship IR seeker
tracking algorithms. Assessing the threat from guided missiles needs a sound
evaluation of their performance. The main goal is to introduce a characteristic
which is able to assess the threat for ships depending on various scenario pa-
rameters. It is shown that for these applications such a single characteristic is
sufficient. In order to achieve this seven popular tracking algorithms are used
for this. Synthetic IR image sequences are generated to simulate a large set of
attack approaches and assemble sufficient statistics on the behavior of the algo-
rithms. The introduced characteristic can also be used for investigations on al-
gorithms themselves, e.g. for sensitivity analyses and parameter optimization of
a single algorithm, and for comparison of different algorithms.
1 Introduction and Related Work
Automated tracking is essential in a wide area of applications. In order to determine
the best tracking algorithm for a given application and to optimize the parameters of
the algorithm, comprehensive quantitative evaluation characteristics are required.
Different scenarios may require different characteristics, but in particular for optimi-
zation and comparison a single numeric characteristic is desirable.
Characterizing trackers on image sequences with multiple objects of interest, clut-
ter objects and complex background – such as in surveillance applications – is quite a
challenge. For those scenarios a lot of different metrics have been proposed. But
defining a single characteristic in those cases is particularly difficult (see e. g. [1, 2, 3,
10, 17]).
For simpler scenarios - single object of interest and relatively homogenous back-
ground – that is easier. For such applications usually simple tracking algorithms are
used. This relative simplicity should allow finding a single appropriate quantitative
characteristic of the tracking algorithm.
The application also dictates whether it is preferable to integrate the performance
characteristic over the whole video sequence or only on the last frame. E.g. for auto-
mated tracking of vehicles or people in a surveillance task the behavior of the tracker
should be averaged over the whole sequence. However, for a seeker head only the last
Doktorski L., Michaelsen E. and Repasi E..
A Single Performance Characteristic for the Evaluation of Seeker Tracking Algorithms.
DOI: 10.5220/0004391100030013
In Proceedings of the 4th International Workshop on Image Mining. Theory and Applications (IMTA-4-2013), pages 3-13
ISBN: 978-989-8565-50-1
Copyright
c
2013 SCITEPRESS (Science and Technology Publications, Lda.)

frame is of interest – intermediate detours do not alter the overall success. This idea
was implicitly used in [13, 14].
This paper concentrates on the protection of ships against infrared (IR) guided
missiles. This application requires assessing the behavior of an IR missile seeker in its
perception/action control loop in the scenario of interest. Today such threat assess-
ment is regarded very important and intensively researched [6, 7, 12, 11, 13, 14].
Quantitative, automatically acquired performance measures were not in the focus of
these works. Instead, for example in [13, 14] the tracker performance has been ana-
lyzed manually and only hit point positions were registered. Thus it is difficult to get
a representative statistic and to compare the results of these papers with results of
other authors. Additionally a method for automatic quantitative analysis of the effec-
tiveness of the countermeasures is needed.
Real data – i.e. videos from real flights of IR missiles against ships – are not
available. Alternatively, partially synthetic image sequences (based on real IR videos
of ships) can be used, where approaching is simulated by zooming. This also causes
high costs. Moreover, results based on such data cannot be compared and reproduced
by other authors. Synthetic data – i.e. rendered image sequences - for the characteri-
zation are standard in literature (see e. g. [13, 14, 16]).
This allows rendering the next image according to the tracker results and thus
simulating control actions based on previous images. Such procedure is called closed
loop simulation. So called “open loop simulation” renders one high resolution video
first. The size of the images is much bigger than the field of view (FOV) of the seek-
er. Seeker actions are modeled by simply choosing an appropriate section from each
image. This causes much less computational efforts for extensive experimenting and
allows simple repeating of the process with for example different start positions or
different algorithm parameters. Discussions on open and closed loop simulation can
be found in [13, 14].
2 Data and Algorithms
2.1 Sources of Synthetic Imagery
Open loop seeker simulation is used in this investigation. Inputs are synthetic se-
quences of 16-Bit images of a target ship with sea foreground and sky background.
The sequences were rendered using three simulation tools: SeaSimul (Fraunhofer-
IOSB-tool), ShipIR/NTCS (http://www.wrdavis.com) and POV-Ray (http://
www.povray.org). All these programs allow simulating 16-Bit sequences and syn-
chronously simulating binary sequences with the contour of the target, the so called
mask-sequences (See Fig. 1). These mask-sequences together with the knowledge
about the distance to the target are used as ground-truth information.
Preliminarily, the objective is to develop a numerical characteristic for seeker
simulations. Therefore simple sequences are simulated: without effects caused by
atmospheric transmission, sun radiation, vibration and so on. All sequences have 25
fps and 800*600 pixels with FOV 109.08x81.81 mrad. As starting distance 25 km
were chosen. The approach velocity was fixed to 300 m/sec.
4
Fig. 1. Example created by the SeaSimul program: one frame from the synthetic sequence and
from the corresponding mask-sequence.
2.2 Seeker Tracking Algorithms
Seven known seeker tracking algorithms [4, 5, 8, 9, 15] were implemented for charac-
terizing. A priory there are good arguments to assume that at least two of them (Cen-
troid and FixedCorrelation; see Table 1) cannot perform well for the considered
scenarios. The analysis below approved this fact.
Table 1. Infrared seeker algorithms and corresponding FOVs.
Algorithm Abbreviation FOV (mrad)
RisingSun RSun 6 x 6
Centroid Cent 16 x 8
BinaryCentroid BCent 16 x 8
ThresholdCentroid TCent 16 x 8
FixedCorrelation FCor 16 x 8
RefreshCorrelation RCor 16 x 8
AverageCorrelation ACor 16 x 8
The first one, the rising-sun reticle algorithm, simulates non-imaging system. Its
field of view (FOV) is a circle. Other algorithms simulate imaging systems with rec-
tangular FOVs.
2.3 Description of the Experiments
Each approach simulation is started at one of the frames (the starting frame) and ends
at the last frame corresponding to the distance of about 3 km. At that distance the
final homing algorithm is assumed to take over. Such special final homing algorithms
are not a topic of this contribution.
The simulation terminates on the last frame and it will be characterized there and
only there. So only the last frame will be used for construction of the characteristics.
The position of the seeker’s FOV (blue rectangle: see Fig. 2) is known. Its middle
point will be called hit point (HPT). This point and the real position of the target (the
corresponding mask) are used in the construction of all characteristics.
The number of pixels within the FOV (FOVArea) and the number of pixels on the
target within the FOV (IntersectionArea) can be registered.
5
Fig. 2. Three examples of the terminal position after simulation. The rectangle (circle) is the
seeker’s FOV.
On the last image a rectangle RLast is constructed including the most important
part of the ship. It is the circumscribing rectangle of the mask shrunk on all sides
while the number of target’s pixels in each “row” and in each “column” is smaller
than 10% of the complete rectangle’s length or height respectively (See Fig. 3.).
Fig. 3. A rectangle RLast includes the most important part of the ship.
Each simulation may also terminate prematurely either because of interior break
criteria of the algorithm or because the open-loop simulation tries to leave the image.
6

3 Used Characteristics
The construction of the performance characteristics is done in three steps.
3.1 Single Simulation Characteristics
If the simulation is terminated prematurely it will be counted as complete failure and
all five characteristics defined below get the value 0. Otherwise the following five
characteristics can be calculated. By these constructions we have used some ideas of
[11, 13, 14].
The first characteristic H (Hit) takes value 1 if HPT lies on the target and 0 oth-
erwise.
Further the feature CQ (Covering Quota) can be calculated:
CQ := IntersectionArea/ FOVArea.
(Compare with [11] where the performance is based on the amount of overlap be-
tween the ground-truth and tracker boxes. See also [1].)
It depends extremely on the contour of the target, on the seeker’s FOV, and on
HPT. Under all possible HPTs the Largest Covering Quota (LCQ) can be estab-
lished. The second characteristic NCQ (Normalized Covering Quota) is defined as
follows:
NCQ := CQ/LCQ.
It does not depend so much on these parameters.
The third characteristic HR (Hit Rectangle) gets the value 1 if HPT lies in the
RLast and 0 otherwise. The fourth and fifth characteristics PA1 and PA2 (Proba-
bility Assessments) are defined via formulas:
PA1 :=
Y
w
w
X
l
l
*2
*
*2
,
PA2 :=
)
2/2/
exp(
22
w
Y
l
X
.
Here l and w are the length and the width of the rectangle RLast. The vector (ΔX,
ΔY) is the difference between centers of the rectangle RLast and HPT (see Fig. 4).
(In [17] analogically distance is defined as
22
YX
and accordingly it does
not depend on the width and height of the target.)
7
Fig. 4. FOV with HPT and Rlast.
3.2 Volley’s Characteristics
Each simulation needs a lock-on position in the starting frame. As default value the
center of gravity of the target will be taken. Experiments indicated that small varia-
tions of the lock-on position can lead to large differences of HPTs and all the five
characteristics. In order to characterize the track algorithm this effect has to be re-
duced. One possibility to do this is starting several simulations with lock-on positions
in a regular grid around the default value. In this investigation 25 simulations are used
where the position is moving ±10 and ±20 pixels in horizontal and vertical directions.
Such a set of simulations is called a volley.
For each element of such volley all five simulation’s characteristics were regis-
tered. Corresponding averages AH, AHR, ANCQ, APA1 and APA2 (The first letter
A stands for Averages) were taken as characteristics of a volley. Note that all these
values lie between 0 and 1. Each of them can be interpreted as probability assessment
for the seeker’s homing phase to score a hit. It will be shown that it is sufficient to use
only one of them.
The first experiments registered the behavior of the characteristics AH, AHR,
ANCQ, APA1 and APA2 as functions of the starting distance. A series of volleys
was started from frame numbers 1, 51, 101, and so forth to the frame number 1751
(corresponding to distances between 25 km and 4 km). Fig. 4 shows exemplarily the
characteristics as function of starting frame number for RisingSun and ThresholdCen-
troid trackers.
It can be seen that all the characteristics are well correlated. This is a general ex-
perience from almost all our experiments. Particular good correlation is found be-
tween
the characteristics APA1, APA2 and ANCQ. Three situations can be distin-
guished:
1) Good situations (bad for the ship): all characteristics are nearly constant with
small standard deviations. In this case the correlation coefficient can be relatively
small (>0.25). This situation is characterized with relatively large values for large
distances to target (small frame numbers).
2) Bad situations (good for the ship): all characteristics increase if the starting dis-
tance decreases and have large standard deviations. In this case the correlation coeffi
8
Fig. 5. Typically dependences of the characteristics on the starting distance (km) for two algo-
rithms: RisingSun – above and ThresholdCentroid – below.
cients are greater than 0.6. This situation is characterized with relatively small values
for large distances to target.
3) Very bad situation (ideal for the ship): all characteristics are extremely small. In
this case the correlation coefficients are not interesting.
The characteristics AH and AHR are discrete. So they are not appropriate as an
objective function for optimization. The three other characteristics can be considered
as continuous. They are preferred. The calculation of the characteristic ANCQ is
more difficult to automate than that of the characteristics APA1 or APA2. Finally, the
characteristic APA2 is less sensitive than APA1 for small values of ΔX and ΔY.
In conclusion it can be stated that
The behavior of these five volley’s characteristics can be used to estimate the
quality of a track algorithm and to compare two algorithms or two simulations;
Because these characteristics are well correlated, it is sufficient and preferable to
use only one of them;
It is reasonable to use only the characteristic APA2 for further work.
3.3 Integrated Characteristic
Calculating diagrams as displayed in Fig. 5 causes considerable computation even for
9

APA2 only. But it is not necessary, because the values of APA2 for few large dis-
tances characterize the overall behavior well enough. On the other hand using the
value of APA2 for only one fixed distance may be error prone because of random
spikes in such curves. Three values of different starting distances, namely 20, 15, and
10 km were picked, and as proposed singular characteristic the averaged integrated
characteristic is defined as
F
basic:=(APA2(20)+APA2(15)+APA2(10))/3.
All following experiments were made with this characteristic.
4 Applicability of the Integrated Characteristic
The characteristic Fbasic can be used as well for investigation how the tracking algo-
rithms react on different scenario parameters (see the following section) as for estima-
tion of algorithms themselves and for optimization of their parameters. But we em-
phasize that the characteristic F
basic can also be used for a wide variety of other in-
vestigations.
4.1 Assessment of Algorithms
Here F
basic is used for the assessment of the seven algorithms. Three experimental
sequences were conducted using the three available rendering tools (see above) with
the same parameters and similar ships as targets. For each sequence and for each
track algorithm values of the characteristic F
basic were calculated. The results are
summarized in Table 2.
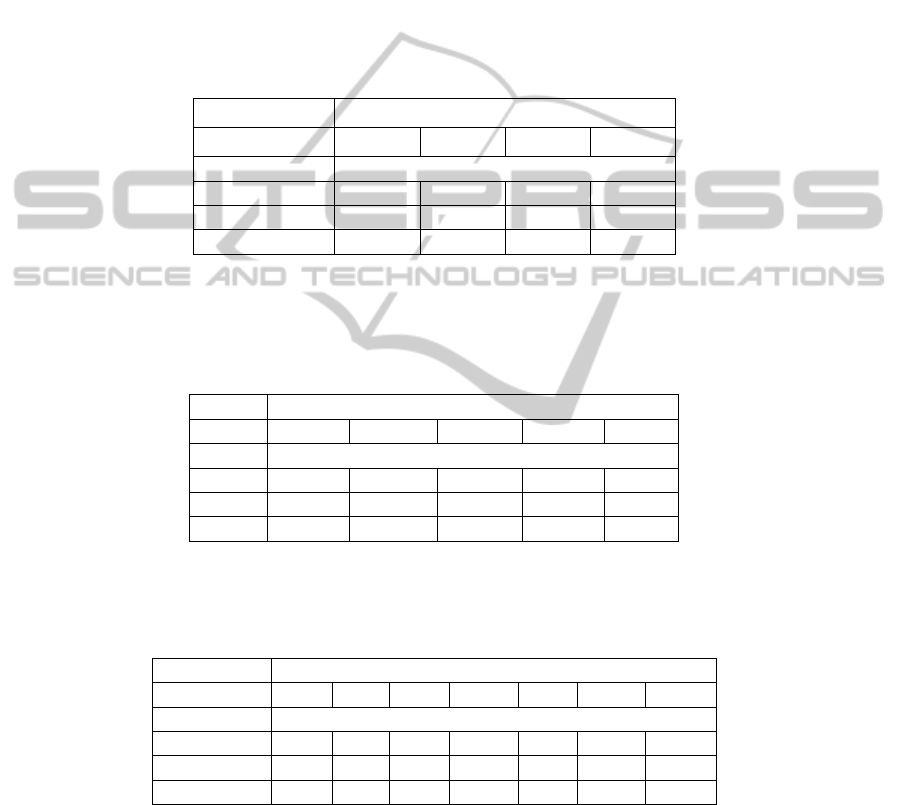
Table 2. Assessment of the algorithms.
Fbasic
Algorithm SeaSimul ShipIR POV-Ray
RSun 0.87 0.41 0.32
Cent 0 0 0.07
BCent 0.08 0 0.07
TCent 0.11 0 0.07
FCor 0.02 0.11 0.11
RCor 0.34 0.20 0.31
ACor 0.41 0.26 0.52
Characteristic Fbasic obviously arranges the algorithms in a similar order for all
three sequences. Four of the algorithms seem to be not useful at all. Recall that for
algorithms Centroid and FixedCorrelation this was expected. Only three algorithms
(RisingSun, RefreshCorrelation and AverageCorrelation) show acceptable values of
the characteristic Fbasic. Therefore only these were used for further investigations.
10
4.2 Assessment of Scene Parameters
Exemplarily, the influence of the frame rate and vibration were tested.
In order to find the impact of the frame rate on the performance of the algorithms
the tool SeaSimul was used to generate three image sequences with frame rate 5, 10
and 50 fps additionally to the sequence with the frame rate 25 used above. The values
of the characteristic
Fbasic for these sequences are summarized in Table 3. It turns out
they do not depend seriously on the frame rate. For further investigations this means
that the parameter ‘Frame rate’ in not very relevant. This can also help saving effort
for future experiments.
Table 3. Dependence on frame rate.
Frame rate
5
10 25
50
Algorithm
F
basic
RSun 0.83 0.83 0.87 0.86
RCor 0.35 0.34 0.34 0.35
ACor 0.36 0.39 0.41 0.43
In order to test the influence of the vibration a lot of sequences with different val-
ues for yaw, pitch and roll vibration separately were generated. The results for yaw
and roll vibrations are summarized in Tables 4 and 5 respectively.
Table 4. Dependence on yaw.
Yaw parameter
0 0.05 0.1 0.2 0.3
Alg.
F
basic
RSun 0.87 0.86 0.62 0.42 0.27
RCor 0.34 0.35 0.06 0 0
ACor 0.41 0.41 0.10 0 0
The algorithms that use correlation strongly react on yaw-vibration. The Rising-
Sun algorithm is more stable. The results for the pitch-vibration are similar.
Table 5. Dependence on roll.
Roll parameter
0 0.1 0.2 0.3 0.4 0.5 0.6
Alg.
F
basic
RSun 0.87 0.86 0.77 0.77 0.8 0.79 0.78
RCor 0.34 0.38 0.40 0.44 0.42 0.42 0.32
ACor 0.41 0.49 0.39 0.49 0.46 0.54 0.55
The roll-vibration is less important for the seekers algorithms because the target is
always near the center of the image.
11

5 Discussion and Conclusions
The experiments indicate that a small number of simulations cannot characterize track
algorithms properly, not even for a fixed starting frame. Very large numbers of simu-
lated approaches are needed. Open loop simulation on synthetic data opens the way to
perform such experiments with acceptable effort.
In order to characterize a seeker tracking algorithm with single characteristic five
different numeric characteristics have been introduced and investigated for a selected
number of scenarios. It was shown that they are tightly correlated. In the end only one
quantitative and continuous characteristic F
basic was constructed. It allows automatic
analysis of the tracking results.
Further experiments showed that it can be used for numeric characterization of
combinations of tracking algorithms and image sequences. Exemplarily, it was shown
how the different algorithms can be compared and how the influence of different
scenario parameters can be investigated. Important conclusions for the reduction of
the over-all run time of the simulation work were possible.
The scenario used here is admittedly limited. Such statements as “algorithm is
bad” may not be generalized too far. Maybe, the parameters of the algorithm should
be chosen differently or maybe for sequences of different nature other characteristic
values emerge. This does not concern the appropriateness of F
basic for assessing such
purposes.
Preliminary, the characteristic should be used as objective function for the optimi-
zation of parameters inside of the algorithms. The optimal setting of parameters is of
great interest and importance for further experiments. Only a quantitative and contin-
uous characteristic allows finding of such optimal setting.
As future work also the influence of such parameters like atmospheric transmission,
sun radiation, etc. will be investigated.
References
1. Anderson D. R., Moore J., Montgomery J., Chambliss M.: Infrared Seeker Performance
Metrics. SBIR A02-158: Phase I SBIR, Final Report (2003) http://www.dtic.mil/cgi-
bin/GetTRDoc?AD=ADA419746
2. Bernardin K., Stiefelhagen R.: Evaluating Multiple Object Tracking Performance: The
CLEAR MOT Metrics. EURASIP J. on Image and Video Processing (2008)
3. Edward K. K., Matthew P. D., Michael B. H.: An Information Theoretic Approach for
Tracker Performance Evaluation. Computer Vision, 2009 IEEE 12th International Confer-
ence on 2009, (2009) 1523–1529
4. Gerlach H.: Digitale Bildfolgenauswertung zum Wiederfinden von Objekten in natürlicher
Umgebung. FGAN-FIM, Karlsruhe, Final Report (1979)
5. Hudson R. D.: Infrared System Engineering. John Wiley & Sons, New York, (1969)
6. de Jong W., Dam F. A., Kunz G. J., Schleijpen R. M. A.: IR Seeker Simulator and IR
Scene Generation to Evaluate IR Decoy Effectiveness. Proc. SPIE 5615, (2004) 100-11
7. de Jong W., van den Broek S. P., van der Nol R.: IR Seeker Simulator to Evaluate IR De-
coy Effectiveness. Proc. SPIE 4718, (2002) 164–172
12

8. Legault R.: Reticle and Image Analyses. Chap. 17 in The Infrared Handbook, W. L. Wolfe,
G. J. Zissis, Eds., Office of Naval Research, Department of the Navy, Washington, DC
(1989)
9. Nasburg R. E.: Tracking and Control Systems. Chap. 5 in Electro-Optical Systems Design,
Analysis, and Testing, M. C. Dudznik, Ed., Vol. 4, Infrared Information Analysis Center,
Environmental Research Institute of Michigan, Ann Harbor, Michigan, USA (1993)
10. Needham C.J., Boyle D.: Performance Evaluation Metrics and Statistics for Positional
Tracker Evaluation. Proc. of the Computer Vision Systems: Third International Confer-
ence, ICVS 2003, 2626, Graz, Austria (2003) 278–289
11. Lavailee P. D., Lightfoot J. A., Chambliss M. A., Kimbel C., Griffin J. R.: Methodology
for Evaluating Autonomous IR Tracker Performance. 2002 Ground Targets Modeling and
Validation Conference Houghton, MI, August 5-8, (2002)
12. Schleijpen H. M. A.: Evaluation of Infrared-Signature Suppression of Ships. Proc. SPIE
2742, (1996) 245–254
13. Schleijpen R. H. M. A.: Toolset for Evaluating Infrared Countermeasures and Signature
Reduction for Ships. Proc. SPIE 7836, (2010)
14. Schoemaker R., Schleijpen R.: Evaluation Tools for the Effectiveness of Infrared Counter-
measures and Signature Reduction for Ships. Proc. SPIE 7662, (2010)
15. Suzuki K.: Analysis of Rising-Sun Reticle. Opt. Eng. 18(3), (1979) 350–351
16. Vaitekunas D. A.: IR Susceptibility of Naval Ships Using ShipIR/NTCS. Proc. SPIE 7662,
(2010)
17. Yujue L., Jinglong Y.: Performance Evaluation of Imaging Seeker Tracking Algorithm
Based on Multi-Features. International Symposium on Photoelectronic Detection and Imag-
ing 2011: Advances in Infrared Imaging and Applications. Proc. SPIE, 8193, (2011)
81932A–81932A-7
13
