
Detection and Identification of Neurons in Images of
Microscopic Brain Sections
Igor Gurevich, Artem Myagkov, Yuri Sidorov, Yulia Trusova and Vera Yashina
Dorodnicyn Computing Centre, Russian Academy of Sciences
40 Vavilov str., 119333 Moscow, Russian Federation
Abstract. This paper presents a new combined mathematical method, which
were proposed, implemented, and experimentally tested for extracting
information necessary for modeling and, in future, predicting Parkinson’s
disease. The method was developed for extraction “neurons” from microscopic
images of brain slices of experimental animals. Then it was adapted for
different types of initial data, because unfortunately the quality of initial images
depends on skills of the specialist who has done an experiment. Now the
method allows one to detect and identify as neurons a set of small informative
extended objects with well distinguished (by brightness) oval inclusions. The
result is a binary image of the contours of detected objects and their inclusions
and a list of characteristics calculated for each detected object. The method is
based on the joint application of image processing methods, methods of
mathematical morphology, methods of segmentation, and the methods of
classification of microscopic images. The method was applied to the following
areas of brain: the substantia nigra pars compacta and the arcuate nucleus of
hypothalamus.
1 Introduction
One of the most important problems of neurosciences is the development of
experimental models of socially important neurodegenerative diseases, in particular,
those associated with the death of dopaminergic (DAergic) neurons. The degeneration
of the latter in the human nigrostriatal system leads to the development of Parkinson’s
disease (PD) [2]. These models are designed for the development of new methods and
technologies for the diagnosis and treatment of such diseases. The models could be
developed much faster and would be economically more effective, with reduced time
and material expenses for morphological studies. The latter can be reached by the
automation and optimization of the methods for processing and analysis of
experimental data. In particular, the automation of the analysis of images of neurons
and their dendrons obtained from the microscope (MINs) makes it possible to reduce
material costs by an order and the time costs, by two orders [7].
In spite of the fact that interest to the problem of analysis of biomedical images,
including MINs, is being constantly growing, there have been very few successful
attempts to automatize the process (or its stages) (see, for example, [3, 9, 14]). The
detection and tracing of neurons in two dimensional microscopic images of brain
Gurevich I., Myagkov A., Sidorov Y., Trusova Y. and Yashina V..
Detection and Identification of Neurons in Images of Microscopic Brain Sections.
DOI: 10.5220/0004396001270136
In Proceedings of the 4th International Workshop on Image Mining. Theory and Applications (IMTA-4-2013), pages 127-136
ISBN: 978-989-8565-50-1
Copyright
c
2013 SCITEPRESS (Science and Technology Publications, Lda.)

slices is complicated by the following factors [9]: (a) MINs contain, in addition to
neurons, objects that are not neurons (particles of dirt, staining errors, tissue folds,
blood vessels, and other artifacts); (b) neurons in MINs may strongly differ from each
other both in size and shape; (c) neurons may be damaged during the preparation of
slices; this fact affects their shape and, hence, leads to a large number of cells of
different types on a slice; and (d) neurons may stick together or may be overlapped.
On the whole, one should admit that the concept of a neuron as a visual object is not
clearly defined, and there is no universal list of contextual, logical, geometrical,
qualitative, and quantitative conditions and characteristics that would allow one to
standardize the description/definition of this visual object.
As a rule, the detection and tracing of a neuron in histological microscopic images
involves the following main stages: preprocessing, segmentation, and classification.
The need for the preprocessing of a MIN is attributed to the presence of noise, low
resolution of a MIN, and the contrast non-uniformity due to error in staining the
slices. To improve the quality of MINs, one usually applies standard operations of
image processing such as smoothing, inverse convolution, morphological filtration,
and some other operations [12].
In the publications devoted to the automatic or semiautomatic detection of neurons
in MINs, one mainly uses, for segmentation, algorithms based on thresholding (for
example, [3, 10]), morphological operations (for example, [4]), Potts models (for
example, [13]), and watershed methods (for example, [15]) or active contour models
(for example, [5, 9]). The further classification is carried out, for example, with the
use of Bayesian procedures, principal component analysis, or machine learning
methods (for example, [1]).
An important stage in the analysis of the MINs of brain slices is the morphological
characterization of the detected neurons. In recent years, a wide set of specific
morphological parameters has been defined for the efficient mathematical
characterization of the morphology of neurons, including their nuclei and dendrons
(see, for example, [11]).
A survey of the methods and systems of analysis and recognition of MINs for
solving the problems of automation of diagnosis and the prediction of the clinical
course of neurodegenerative diseases has been published by the authors of the present
paper in [6].
The mathematical apparatus developed by the authors is based on the combined
application of the methods of mathematical theory of image analysis and
mathematical theory of pattern recognition, mathematical morphology, descriptive
image algebras, information theory, and the methods of mathematical statistics. The
methods developed allow one to efficiently detect and extract informative objects in
microscopic images of brain slices (under restrictions imposed on the shape, size,
topology, and the smoothness characteristics of the boundaries of objects [7, 8]).
2 Statement of the Problem
The problem consists in detecting the contours and calculating the morphofunctional
characteristics of neurons for constructing a PD model that represents differences
128
between the parameters of DAergic neurons in the test and control groups
(experimental animals from the test group were subjected to neurotoxin).
As a source of experimental data for constructing a PD model, we used digital
microscopic images of DAergic neurons and the fibers of brain slices of experimental
animals (with a resolution of 0.0117µm2/pixel2).
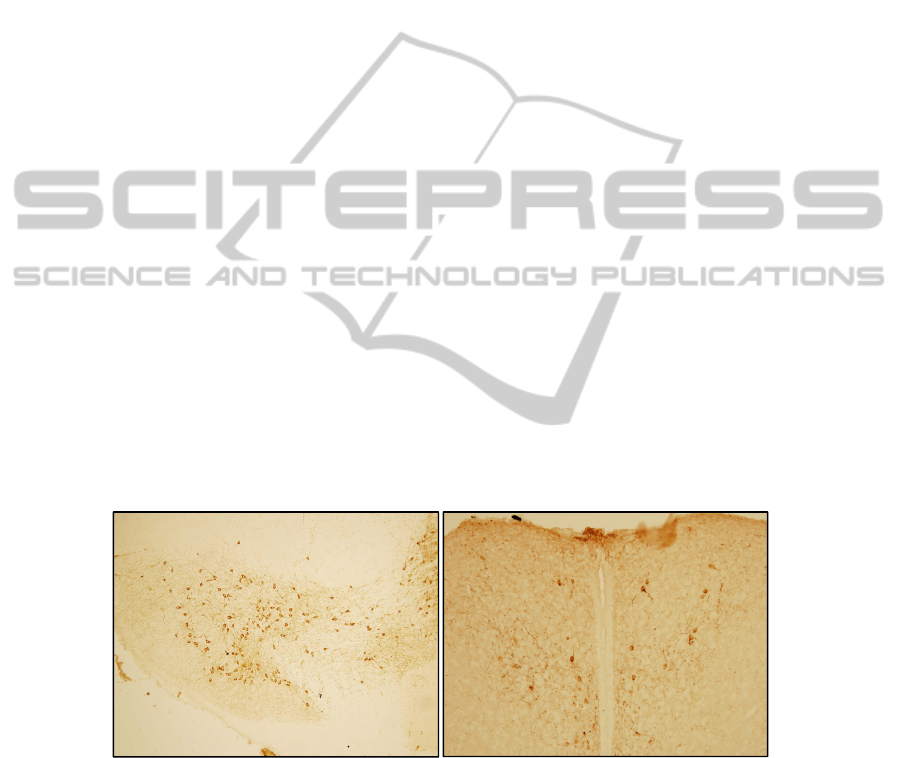
First of all, DAergic neurons are found on frontal serial slices of the substantia
nigra pars compacta (SNC) with a thickness of 20 µm (fig. 1, left figure). They
represent a key link in the regulation of motoric behavior. A progressive degeneration
of these neurons leads to the development of PD.
DAergic neurons represent dark oval cells with light nucleus. The shape of
DAergic neurons may be rather arbitrary; however, in many cases one can observe a
convex soma surrounding a nucleus. The mean diameter of DAergic neurons ranges
from 10 to 20 µm. The nuclei are of oval shape, with a minimum
diameter of 6–12
µm and a maximum diameter of 9–15 µm. The relative size of the body (soma) and
the nucleus vary strongly (one may observe either a very
thin soma around the
nucleus or a relatively small nucleus compared with the area of the soma). MINs
contain a large number of fibers around a cell, which
may mask the cell, forming an
intense background around a neuron.
In addition to the factors, listed in the Introduction, that impede the processing of
MINs, one should take into account that (a) MINs contain regions of brain with a
different number of neurons per unit area, and (b) microscopic images of different
brain slices differ strongly in contrast and brightness.
DAergic neurons are found on frontal serial slices of the arcuate nucleus of
hypothalamus (AN) with a thickness of 20 µm (fig. 1, right figure). The DAergic
neurons in this part of brain are the same as in SNC area, but the initial images of
slices have significant differences: 1) the background of AN images is brighter than
the background of SNC images; 2) neurons located in AN slices can have no visible
cores; 3) average number of AN neurons per slice is in several times smaller than
there are in SNC area; 4) neurons located in AN slices are distributed rarely than in
SNC slices and mutual contacts between neurons in AN area are practically excluded.
Fig. 1. Examples of images of neurons and their dendrons obtained from the microscope: a)
SNC area (left figure); b) AN area (right figure).
129

3 Automated Detection and Identification of Neurons in
Microscopic Images of Stained Brain Slices
The theoretical basis of the development of a new combined method for the analysis
of MINs is the descriptive approach to image analysis and understanding [8].
According to this approach, a mathematical method for the analysis of MINs is
represented as a special algorithmic scheme.
The method is designed for detecting a set of small informative extended objects
with well-distinguished (by brightness) oval inclusions in microscopic images of
frontal slices of the SNC and AN and calculating their morphometric characteristics.
The result is a binary image of the contours of selected objects and a list of
characteristics calculated for each detected object. The method is based on the
combined application of image processing methods, methods of mathematical
morphology, methods of segmentation, and methods of classification of microscopic
images.
The main feature of the method is that, after preprocessing of images, an iterative
analysis of microscopic images is carried out with a view to distinguishing various
classes of objects, that involves five procedures: (1) objects different from neurons are
eliminated at the stage of application of the classifier; (2) a special class of objects-
stuck-together neurons- is distinguished after the classification; the analysis of these
neurons reduces to the construction of boundaries between two neurons; (3)
segmentation ensures the separation of “good” neurons (neurons with regular shape);
(4) analysis of neurons with thin soma whose boundary has been partially erased and
the nucleus is in contact with the background; and (5) elimination of the dendrons of
neurons.
The combined method involves the following main steps: (1) preprocessing of
MINs: (1.1) filtration of MINs by an unsharp mask, (1.2) normalization of MINs,
(1.3) morphological closing by reconstruction, and (1.4) binarization of MINs; (2)
analysis of MINs: (2.1) segmentation of MINs, (2.2) classification of detected objects,
(2.3) tracing neurons, (2.4) tracing the boundaries of neurons, (2.5) cutting off the
dendrons of the neurons, and (2.6) construction of the boundaries of detected neurons;
and (3) morphological characterization of neurons.
The algorithmic scheme for analysis of AN slices is almost the same: 1) the step
1.4 of MINs binarization is applied with other values of parameters; 2) the step 2.2 of
object classification is based on another method of learning classifier.
The algorithmic scheme that implements the detection and identification of objects
involves the following stages:
1. Preprocessing of MINs:
1.1) Filtration of MINs by an unsharp mask: the goal of this procedure is to
increase the sharpness of the MINs, which allows one to increase the accuracy of
tracing closely located neurons at further stages; the input data is a color MIN, and the
output data is a sharper color MIN.
A copy of the initial image is subjected to blurring (standard Gaussian blurring). If
the difference between the mask and the original exceeds a certain
threshold, the
images are subtracted. The threshold is needed to avoid undesirable details such as
noise in a digital image. The method ends with a pixel-by-pixel addition of the initial
and obtained images.
130

Unsharp masking increases the local contrast of an image in the regions that
initially contained sharp variations in color gradation; this allows one to keep the
boundaries between neurons.
1.2) Normalization: the aim of this procedure is a transition to a grayscale
representation of MINs to normalize the difference in the staining of preparations; the
input data are a color MIN with increased sharpness, and the output data is a
grayscale MIN.
The formula for the transition from a color to a grayscale MIN is standard, because
all three channels of the original image carry equal information necessary for the
further operation of the method. To pass from a color to a grayscale image, one
should apply the following formula for calculating the gray level at every point of this
image: gray= 0.299*R+ 0.587*G+0.114*B.
1.3) Filtration of MINs with the use of morphological closing by reconstruction;
the aim of this procedure is to suppress dark noise objects that are smaller than
neurons; the input data is a color MIN, and the output data is a grayscale MIN.
The applying of a morphological filter is motivated by the fact that the initial MINs
contain noisy objects that neither belong to the objects of the background nor
represent the goal objects. Noise in the images is produced due to the parts of neurons
(a part of the neuron shell) that do not completely fall into the slice, or due to the
terminals that fall into the slice. The noise objects in the image distort the results of
classification; moreover, they may affect the shape of the selected objects in case of
superimposition.
For the morphological processing of images, we chose a filter “closing by
reconstruction” because of the applying of this filter preserves the boundaries of the
objects subjected to filtration.
After the morphological filtration, large objects of the foreground that can easily be
detected against the background remain on the grayscale image. However, large noisy
objects may also exist among the remaining objects. This problem is solved at the
subsequent steps of the method.
1.4) Binarization; the aim of this procedure is a transition from a grayscale MIN to
a binary MIN followed by the segmentation of the objects; the input data is the
processed grayscale MIN, and the output data is the binary MIN with the goal objects,
which will be checked for membership in the “neuron” class.
The binarization of an image is performed by a thresholding algorithm with
adaptive threshold. The adaptive threshold is chosen by Otsu’s method [12]. After
that a threshold rule is applied to the grayscale image: all pixels of the original image
whose brightness function is above the threshold are assigned a brightness value of
255, and the remaining pixels are assigned a value of 0.
The binarization of AN images is performed by a thresholding algorithm with
adaptive threshold multiplied by some normalizing constant, because of the brightness
of the background. The constant (0.74) was found during the experiments.
The pixels with a brightness value of 0 on the binary image obtained are
considered to be neuron like objects, while the pixels with brightness 255 are assumed
to belong to the background.
2. Analysis of MINs:
2.1.2) Elimination of objects according to the shape and size of neurons; the aim of
this procedure is to eliminate redundant objects by their size (a) from above with a
very high threshold, in order to remove large areas that are certainly not neurons,
131

while retaining fragments corresponding to stuck together neurons, and (b) from
below with a small lower threshold, in order to remove undoubted noise; the input
data are the extracted connected components, and the output data is a shortened list of
connected components.
2.1.3) Preparation of areas with extracted objects for classification; the aim of this
procedure is the construction of the minimal bounding square for each connected
component; the input data is a binary MIN and the list of connected components, and
the output data is the list of minimal bounding squares.
2.2) Classification of extracted objects; the aim of this procedure is the distribution
of detected objects into two classes (“neurons” and “other objects”); the input data is
the list of squares that contain connected components, and the output data are two lists
of squares (the class of “neurons” and the class of “other objects”).
The problem of recognition of neurons is solved by a classifier based on the
calculation of the distances from some special points of objects (the search of these
points is done during classifier teaching process) to the objects’ edge in fixed
direction and on the features based on such distances.
The classifier is applied with various resolutions to square fragments of a MIN that
contain connected region chosen at the previous step. This approach allows one to
determine the presence of a single or several neurons in a single connected region.
The accuracy of the trained classifier on a test sample was 5% (for AN - 7%) -
error of the first type (neurons assigned to the class of “other objects”) or 15% (for
AN - 20%) - error of the second type (“non-neurons” identified as “neurons”). The
accuracy of the classifier can be improved by increasing the learning sample and by
bootstrap estimates to choose background objects.
2.3) Tracing “neurons”:
2.3.1) Elimination of “other objects”; the aim of this procedure is to remove
connected components corresponding to “other objects” according to the
classification performed; the input data are the minimum size squares bounding “other
objects” and the processed connected components, and the output data is a shortened
list of connected components.
All the connected components are eliminated according to the list of minimum size
squares bounding “other objects”.
2.3.2) Checking the number of extracted “neurons” in a connected component; the
aim of this procedure is to calculate the number of neurons in one connected
component; the input data are the minimum size squares bounding neurons and the
shortened list of connected components, and the output data is the number of
extracted neurons in each connected component.
2.4) Tracing the boundaries of neurons:
2.4.1) Splitting stuck-together neurons; the aim of this procedure is the
construction of a boundary between stuck-together neurons; the input data is the
number of extracted neurons in each connected component and the binary MIN, and
the output data is a new list of connected components.
When a connected component contains several neurons, stuck-together neurons are
separated. The separation was proceed as follows. One “non-neuron” connected
component suitable in size is taken. The amount of “white color” regions completely
covering by connected component is calculated in the next step. If the amount of such
regions is more than one than the median perpendiculars for line connected its centers
132

conducted between these regions. These perpendiculars will be the part of new
neurons boundaries.
After the boundary of new candidate for “neuron” is highlighted the minimum size
square bounding it and the classifier is running.
2.4.2) The construction of the minimum convex hull around a connected
component; the aim of this procedure is to construct the minimum convex hull, which
allows one to detect both “good” neurons and neurons with thin soma and vanishes
after preprocessing of a MIN; the input data is the shortened list of connected
components, and the output data are the minimum convex hulls of the connected
components.
2.4.3) Obtaining a traced boundary of a connected region; the aim of this procedure
is to obtain the boundary of neurons; the input data is a new list of connected
components, and the output data are the preliminary boundaries of neurons.
2.4.4) Checking the coincidence of the exact boundary and the minimal convex
hull; the aim of this procedure is to obtain the exact boundaries of neurons: (2.4.4.1)
when a region of the convex hull differs substantially from the traced boundary of a
connected component, the region of the convex hull is taken as the boundary of a
neuron; (2.4.4.2) when the region of the convex hull and the traced boundary either
coincide or differ insignificantly, the boundary of the connected component is taken
as the boundary of a neuron; the input data are the preliminary boundaries of neurons
and the minimal convex hulls, and the output data are the exact boundaries of
neurons.
2.5) Cutting off the dendrons of neurons; the aim of this procedure is to eliminate
redundant parts of objects identified as “neurons”; the input data are the exact
boundaries of neurons, and the output data are the exact boundaries of neurons
without dendrons.
2.6) Construction of the boundaries of the nuclei of extracted neurons; the aim of
this procedure is to remove the pixels belonging to the connected region from the
domain enclosed inside the boundary; the remaining pixels belong to the nucleus by
definition; the input data are new exact boundaries of neurons and a new list of
connected components, and the output data are the exact boundaries of nuclei.
3. Morphological characterization of neurons.
3.1) Determination of the necessary feature space; the aim of this procedure is to
determine a parametric model for the characterization of neurons. Biological experts
consider the mean brightness, perimeter, area, form factor, optical density, and
amount as the main parameters of the model.
3.2) The characteristics are calculated for individual neurons and their averaged
values by slices and series of slices; the input data is a binary MIN with the
boundaries of objects and the original colored MIN, and the output data are the values
of features and parametric models of neurons.
4 Experimental Testing of the Method Developed
The method of analysis of MINs developed is convergent, stable with respect to small
variations in the initial data, and has quadratic computational complexity. The method
is software implemented and is used for the automation, filling, and analysis of
133
preclinical models of PD by experimental data at the Kol’tsov Institute of
Developmental Biology, Russian Academy of Sciences (Moscow, Russian
Federation).
Experimental testing was carried out on 58 brain slices of the same animal. The
accuracy of the results was estimated by verifying whether the distributions of neuron
characteristics detected automatically coincide with those detected manually by the
Kolmogorov–Smirnov criterion (the zero hypothesis).
The accuracy of the results was also estimated by comparing the mean
multifunctional characteristics obtained under the automatic and manual tracing of
neurons on randomly chosen brain slices (we took five brain slices). The averaged
values of the characteristics of objects traced in the automatic and manual modes are
shown in Table 1 (for SNC case) and in Table 2 (for AN case). These tables present
also the correlation between the characteristics calculated in the manual and automatic
modes. The results confirm that the automatic tracing of neurons is close to the
manual tracing: the difference in the brightness and the area of the selected region is
within admissible limits, while the difference in the perimeters and the shape factors
of objects is attributed to the fact that it is very difficult to draw the exact boundary
manually.
During the experimental investigations, we confirmed the following characteristics
of the algorithms developed. 1. The algorithms guarantee the analysis and recognition
of the images of neurons on two dimensional brain slices of experimental animals. 2.
According to the statistical estimate of the Kolmogorov–Smirnov criterion, the
accuracy of the automatic analysis of neuron images is comparable with the accuracy
of visual analysis of neuron images, which is carried out when studying PD without
computer-aided analysis of images.
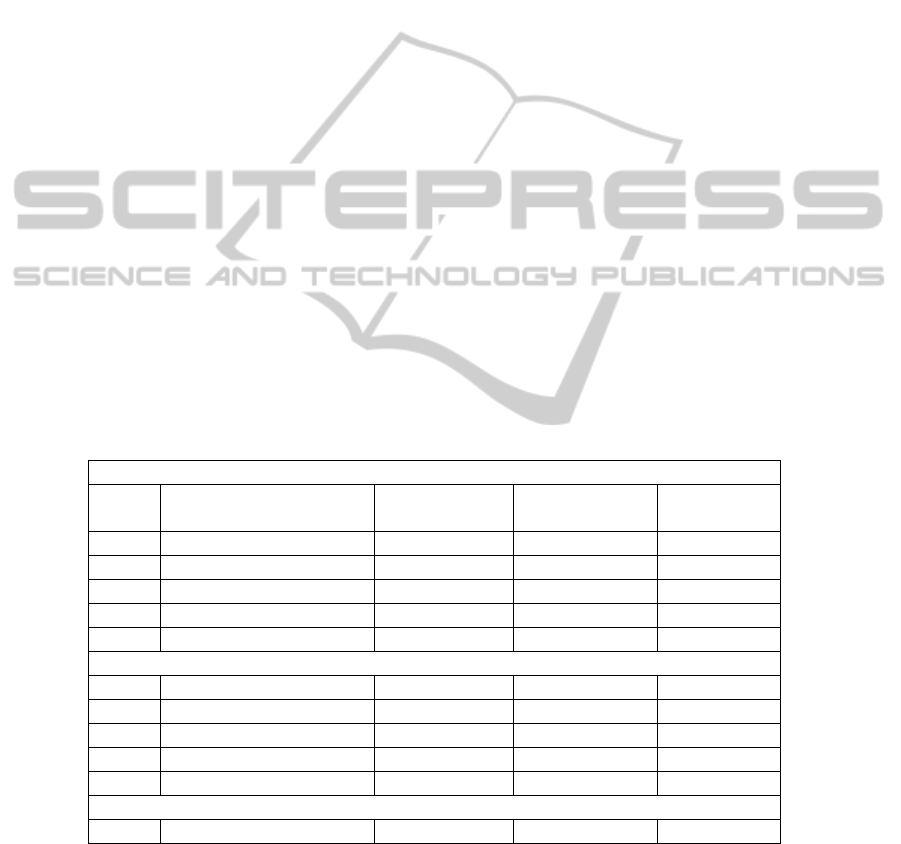
Table 1. Comparison of the characteristics of objects detected automatically and manually in
SNC.
Manual detection
Image Mean brightness
(0...255)
Area (mm
2
) Perimeter
(mm)
Shape factor
1 149,7 2,355 5,09 -0,06
2 145,9 3,046 6,08 -0,02
3 149,8 2,815 5,77 -0,03
4 146,4 2,756 5,31 -0,02
5 150,0 2,493 5,23 -0,02
Automatic detection
1 149,1 2,403 5,42 -0,05
2 145,2 3,166 6,69 -0,03
3 148,1 2,848 5,66 -0,03
4 146,6 2,813 5,11 -0,04
5 148,4 2,508 5,37 -0,03
Correlation between the manual and automatic modes
0,95 0,99 0,87 0,78
134
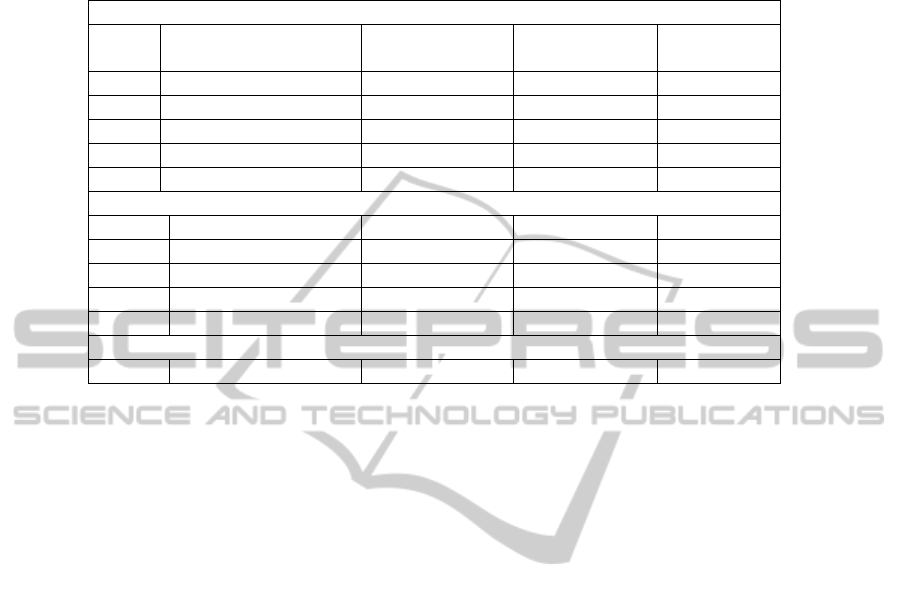
Table 2. Comparison of the characteristics of objects detected automatically and manually in
AN.
Manual detection
Image Mean brightness
(0...255)
Area (mm
2
) Perimeter
(mm)
Shape factor
1 122,1 2,239 4,79 -0,06
2 112,7 3,691 4,32 -0,03
3 117,0 2,512 6,15 -0,03
4 123,4 3,254 4,67 -0,02
5 122,7 2,417 4,30 -0,04
Automatic detection
1 119,7 2,432 4,89 -0,05
2 111,0 4,843 5,13 -0,03
3 118,7 2,712 6,15 -0,02
4 123,1 3,373 4,47 -0,04
5 121,1 2,313 4,51 -0,04
Correlation between the manual and automatic modes
0,93 0,95 0,86 0,75
5 Conclusions
We have developed a new mathematical method and a software designed for
extracting and characterizing DAergic neurons in microscopic images of brain slices
in the SNC and in AN. The problem of detecting neurons in the images of SNC and
AN slices has been posed by scientists from the Laboratory of Hormonal Regulations
at the Kol’tsov Institute of Developmental Biology, Russian Academy of Sciences.
They also supplied images for processing and analysis. The experimental testing of
the method has been carried out jointly. At present, we study the possibility of
improving the mathematical and functional characteristics of the method by using
combinatorial recognition algorithms that admit the input of spatial information and
essentially employ contextual and logical conditions and constraints.
Acknowledgements
This work was supported in part by the Russian Foundation for Basic Research
(projects nos. 11-01-00990, 12-07-31123) and by the Presidium of the Russian
Academy of Sciences within the program “Fundamental Science to Medicine” as well
as within the program “Information, Control, and Intelligent Technologies and
Systems” (project no. 204).
135

References
1. Alavi, A., Cavanagh, B., Tuxworth, G., Meedeniya, A., Mackay-sim, A.: Automated
classification of dopaminergic neurons in the rodent brain. In: Proceedings of International
Joint Conference on Neural Networks, Atlanta, Georgia, USA, June 14-19 (2009) 81-88
2. Albin, R. L., Young, А. В., Penney, J. В.: The functional anatomy of basal ganglia
disorders. In: Trends Neurosci., 12 (1989) 366-375
3. Benali, A., Leefken, I., Eysel, U. T., Weiler, E.: A computerized image analysis system for
quantitative analysis of cells in histological brain sections. In: Journal of Neuroscience
Methods, 125(1-2) (2003) 33-43
4. Dias, A. V., Picanço-Diniz, C. W., Lotufo, R. A., Garçon, S.: Morphological segmentation
of neurons and axon terminals in rat visual cortex. In: Perception, 27 (ECVP Abstract
Supplement) (1998)
5. Fok, Y.-L., Chan, J., Chin, R. T.: Automated Analysis of Nerve-Cell Images Using Active
Contour Models. In: IEEE Transactions on Medical Imaging, 15(3) (1996) 353-368
6. Gurevich, I., Beloozerov, V., Myagkov, A., Sidorov, Yu., Trusova, Yu.: Systems of Neuron
Image Recognition for Solving Problems of Automated Diagnoses of Neurodegenerative
Diseases. In: Pattern Recognition and Image Analysis: Advances in Mathematical Theory
and Applications, 21(3) (2011) 392-397
7. Gurevich, I. B., Kozina, E. A., Myagkov, A. A., Ugryumov, M. V., Yashina, V. V.:
Automating Extraction and Analysis of Dopaminergic Axon Terminals in Images of Frontal
Slices of the Striatum. In: Pattern Recognition and Image Analysis: Advances in
Mathematical Theory and Applications, 20(3) (2010) 349-359
8. Gurevich, I. B., Yashina, V. V.: Descriptive Approach to Image Analysis: Image Models.
In: Pattern Recognition and Image Analysis: Advances in Mathematical Theory and
Applications, 18(4) (2008) 518-541
9. Inglis, A., Cruz, L., Roe, D. L., Stanley, H. E., Rosene, D. L., Urbanc, B.: Automated
identification of neurons and their locations. In: Journal of Microscopy, 230(3) (2008) 339-
352
10. Masseroli, M., Bollea, A., Forloni, G.: Quantitative morphology and shape classification of
neurons by computerized image analysis. In: Computer Methods and Programs in
Biomedicine, 41(2) (1993) 89-99
11. Meijering, E.: Neuron Tracing in Perspective. In: Cytometry. Part A, 77(7) (2010) 693-704
12. Otsu, N.: A Threshold Selection Method from Gray-Level Histograms. In: IEEE
Transactions on systems, man, and cybernetics, 9(1) (1975): 62-66
13. Peng, S., Urbanc, B., Cruz, L., Hyman, B.T., Stanley, H.E.: Neuron Recognition by Parallel
Potts Segmentation. In: Proceedings of the National Academy of Sciences of the United
States of America, 100(7) (2003) 3847-3852.
14. Sciarabba, M., Serrao, G., Bauer, D., Arnaboldi, F., Borghese, N. A.: Automatic Detection
of Neurons in Large Cortical Slices. In: Journal of Neuroscience Methods, 182 (2009) 123-
140
15. Wang, Y.-Y., Sun, Y.-N., Chou-Ching, K., Ju, M.-S.: Nerve Cell Segmentation via Multi-
Scale Gradient Watershed Hierarchies. In: Conference proceedings: Annual International
Conference of the IEEE Engineering in Medicine and Biology Society (2006) 6698-6701
136
