
Case Study: Condition Assessment of a Photovoltaic Power Plant using
Change-point Analysis
Steffen Dienst
1
, Johannes Schmidt
2
and Stefan K
¨
uhne
1
1
Institute of Computer Science, University of Leipzig, Leipzig, Germany
2
Institute for Applied Informatics (InfAI) e.V., Leipzig, Germany
Keywords:
Data Mining, Renewable Energy, Condition Monitoring, Photovoltaics, Multivariate Time Series.
Abstract:
Today, the operation of sustainable power plants mainly relies on visualization of power production. Measure-
ment data of such power plants are often discarded. We show the idle potential of such data by applying a
state of the art algorithm to recognize malfunctions in a photovoltaic power plant. Up to now, these failures
could only be found by manual inspection of the power plant every six weeks. Our results show a substantial
financial benefit: power outages of power plant components due to fuse failures often can be recognized within
days. This fact results in a reduction of financial losses up to at least 63% by being able to schedule repairs
faster.
1 INTRODUCTION
Germany is currently changing the national electricity
production from fossil and nuclear energy to renew-
able energy. This process led to a massive increase of
installed sustainable power plants in Germany within
the last years. According to (Wirth, 2013) there are
currently about 1.200.000 photovoltaic (pv) power
plants in operation in Germany, two thirds of them are
operated by individuals. Since these power plants are
operated by thousands of individuals with a varying
degree of understanding of underlying technical pro-
cesses and mechanisms, there is a necessity of better
tool support.
Typically several sensors are installed which pro-
vide a wide range of measurement data. According to
our experience as well as published case studies like
(Moore and Post, 2008) or (Oozeki et al., 2010), oper-
ators often just visualize the daily gain of the plant to
get an impression of the amount of energy produced.
Even dedicated software systems for monitoring re-
newable power plants, for example as described in
(Papadakis et al., 2005), are often limited to features
like storing and visualizing measurement data. Anal-
ysis algorithms used in practice often are just simple
threshold calculations. Therefore, any malfunctions
in the PV power plant that does not lead to an immedi-
ate total power loss may go unnoticed for a long time.
Such failure conditions might be broken pv modules,
broken cables to individual modules, reduced power
output from inverters etc. Specialized data analysis
software is not widely use in the context of pv power
plant operation, so data often is discarded.
We argue that this data can be used as-is to tell the
operators more about the state of their power plants
and thereby boost the economic gain without any ad-
ditional investments, for example in sensors. We want
to show how to use available algorithms applicable
to pv plant monitoring to detect and thereby miti-
gate the economic losses originating from these fail-
ures. To do so, we are mainly interested in algorithms
that need as little configuration settings as possible to
be able to apply them automatically to many power
plants without customization overheads.
Section 2 presents the subject of this case study: a
pv power plant with two-axis trackers, and the prob-
lems observed when operating this power plant. Sec-
tion 3 shows our reasoning for selecting an applicable
algorithm from the scientific literature and explains
our application to the problem at hand. The last sec-
tion 4 will present our findings as well as a discussion.
2 CASE STUDY: TWO AXIS
TRACKER
We have access to the measurement data in 2012 of
a PV power plant with an installed peak power of
2.15MW. It consists of two separate fields. Each field
159
Dienst S., Schmidt J. and Kühne S..
Case Study: Condition Assessment of a Photovoltaic Power Plant using Change-point Analysis.
DOI: 10.5220/0004406801590164
In Proceedings of the 2nd International Conference on Smart Grids and Green IT Systems (SMARTGREENS-2013), pages 159-164
ISBN: 978-989-8565-55-6
Copyright
c
2013 SCITEPRESS (Science and Technology Publications, Lda.)
contains one inverter, which is responsible for con-
verting direct current (DC) power produced by PV
modules into alternating current (AC) power (which
gets fed into the electrical grid). One inverter has two
internal inverter subsystems, the other one has four.
Each inverter subsystem has four distinct inputs for
DC power (in total 24 inputs).
The PV modules in the two fields are installed on
431 two-axis trackers, that means, the modules are
not mounted on rigid stands but get moved throughout
the day to stay perpendicular to the sun at all times.
For a demonstration of their working principle refer
to (Abdallah and Nijmeh, 2004). Trackers combine
their individual power outputs in so called combiner
boxes which feed their outputs into DC inputs of the
inverter subsystems. That means, the measurements
available in the inverters are the sum of groups of 12
to 24 individual trackers.
Trackers are mechanical devices, meaning they
tend to fail or work sub optimally due to wind, dust
or bird droppings. The most serious failures are fuses
failues. In contrast to a mere reduction of power pro-
duction, if a fuse is open, this tracker will not produce
any power at all. Our dataset contains the dates of
routine six-weekly inspections and the names of the
trackers with failed fuses. If a fuse failes within this
inspection interval it goes unnoticed until six weeks
later.
2.1 Problem Statement
There are no hardware sensors installed on the track-
ers that would allow us to learn about their individual
state of operation remotely. The only data we have
about the condition of any tracker is the accumulated
generated power fed into the inverters (as measured
within the inverters), one insolation sensor per field
and maintenance data that shows the dates of fuse re-
pairs per tracker. So, the problem can be stated as the
following: how can we recognize malfunctions in in-
dividual trackers just by using data we can measure in
an inverter?
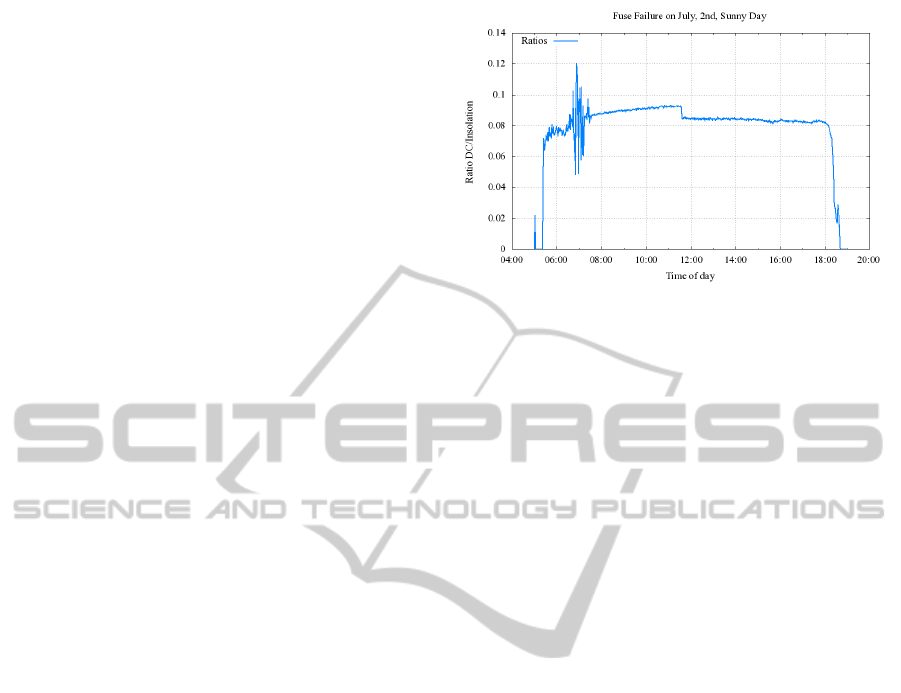
Figure 1 shows a plot of the DC power input of
a sunny day showing the effects for a fuse failure
around noon. This line chart shows the ratio of in-
solation power to DC current as measured on one DC
input string. After sunrise, around 7am, there were
some clouds which lead to different insolations at the
PV modules and the insolation sensor. These dif-
ferences result in an increased volatility in the chart.
Starting from 7:30am, the rest of the day is sunny.
Around 11am the plot shows the effect of a failed
tracker fuse: the ratio drops visibly. Henceforth the
power production of this string is reduced.
Figure 1: Plot of the DC currents curve of one inverter input,
showing a failing fuse around noon on a cloud free day.
3 METHODOLOGY
We reviewed literature about data mining algorithms
(Gaber et al., 2005), time series analysis (Fu, 2011)
and process control statistics (Venkatasubramanian
et al., 2003) to identify appropriate algorithms that
can help to gain insight about the state of the trackers
described in the use case in section 2. We identified
three major groups of algorithms appropriate for our
problem:
Simulation Models create a model/simulation of the
inner operations and use its predictions to identify
deviations of behaviour from the predictions, like
(Perpian, 2009).
Anomaly Recognition find anomalous behaviour by
various metrics. For an overview we recommend
(Chandola et al., 2012).
Statistical Time Series Analysis apply statistical
measures to time series to distinguish between
normal and anormal behaviour (Hill and Lewicki,
2005).
Creating a model for the whole PV power plant
proved to be not feasible as well as potentially dif-
ficult to transfer to other scenarios. Anomaly recog-
nition, especially configuration free algorithms as
demonstrated in (Keogh et al., 2005), showed some
potential in our pre-study. The effects of fuse fail-
ures and repairs on the shape of the measurement data
curves are very similar to the effects of a cloudy sky.
Both lead to sudden jumps in the power output of
each pv module. Anomaly recognition algorithms,
at least unparametrized instances, tend to mark too
many days of data with bad weather as to be useful
for finding fuse failures and repairs.
We looked for appropriate algorithms in the re-
search field of statistical time series analysis and set-
SMARTGREENS2013-2ndInternationalConferenceonSmartGridsandGreenITSystems
160

tled on change-point analysis as a promising tool for
the problem at hand.
3.1 Change-point Analysis
Change-points describe discrete points in a time series
where the mean of the values changes, i.e. the mean
prior to the change-point is significantly (according to
a given confidence value) higher or lower than after
it. This technique is useful for finding changes at an
unknown point in time. It was described as early as
1971 by (Hinkley, 1971).
Literature discusses a variety of metrics that can
be used to find change-points. One of the most
straight forward metric is taking the global maximum
or minimum of the cumulative sum of differences be-
tween the values of the time series from its mean
value. We used the algorithm described by (Wayne,
2000) to find change-points in the hourly ratio time
series as described in the last section. As we did not
enhance the algorithm itself but rather focus on its ap-
plication to our use case, we will not give a thorough
description of it but refer to the detailled description
of the author (Wayne, 2000).
The only parameter we varied in our implementa-
tion of the change-point algorithm is the minimal con-
fidence. It determines the probability that the change-
point found is not just due to chance.
3.2 Data Preparation
The data recorded by the inverter represents natural
processes, that is, it depends on the sun light available
at any time. This fact means, we have to deal with
volatile time series. On a sunny day, the power pro-
duction of every given tracker follows a smooth curve
(figure 2) while on cloudy or rainy days, the shape of
the curve is ragged. Furthermore, the power produc-
tion is not stationary; its value depends on the sun’s
position and therefore on the time of day. We had
to find a derived metric that has to have two essen-
tial properties: it has to be stationary (see (Hill and
Lewicki, 2005) for details) and it has to be robust in
spite of different weather conditions.
Our dataset contains direct currents measured on
each inverter input, as described in section 2. Also,
each PV field has a single insolation sensors. These
sensors measure the insolation power of the sun on an
area of one square meter. Each sensor, DC as well as
insolation, is averaged every minute, giving 1440 data
points per day. For each DC input, we derive a time
series by dividing the current value by the insolation
value. As the ratio between insolation and absorbed
power should be constant, these derived time series
Figure 2: Zoomed plot of DC/insolation ratios on a sunny
day, showing the change over the day.
are expected to be constant and therefore stationary.
Figure 2 shows that the ratio is not constant but
rather changes throughout the day. The bend of this
curve changes over the year, too. To mitigate this
non-stationarity property, we do not look for change-
points within these intra-day ratios themselves, but
rather on time series derived by taking the average
per hour. That means, for each DC input of each in-
verter, we get get 8 different time series, one for each
hour from 9am to 4pm (ensuring we have sun shine
for every day of the year during this time of day). The
results are several new time series (one per hour of
the sun day, visualized in figure 3) that have just one
data point per calendar day. These series are station-
ary and can thus be passed into the change-point al-
gorithm used in this case study.
As the raw ratios tend to vary a lot, we also con-
sidered to use not only these values as-is but also
their derived ranked values. To get this data, we sort
all unique values and gave them an index each, ef-
fectively enumerating all distinct values. This proce-
dure is recommended, if data contain outliers (Draper,
1988).
The data preparation process comprises in sum-
mary:
1. ∀ DC sensors find the closest insolation sensor
2. Calculate ratios
DC
i
Insolation
j
, i = 1..24, j = 1..2 (up
to 24 DC inputs per inverter, up to two insolation
sensors per PV field)
3. Derive time series from these ratios by averaging
the ratios per hour between sunrise and sunset
4. Order each time series in ascending order and use
the ranks of each value in place of the raw value
4 EVALUATION
Since a change-point just designates a change in the
CaseStudy:ConditionAssessmentofaPhotovoltaicPowerPlantusingChange-pointAnalysis
161

average of a time series, the algorithm does not distin-
guish between increases and decreases of the mean.
This property allows us to evaluate the feasibility of
applying the change-point algorithm to our problem
of finding open fuses by looking not for these failure
events but rather for repairs. We do not know when
each fuse failed exactly, but we do know the repair
times. Because of the symmetric behaviour of our al-
gorithm, we can use the results of finding fuse repairs
to estimate the time required to find fuse failures.
We ran the change-point analysis for each ratio of
DC and insolation for the two month period around
repair times. We varied the number of days after a
fuse repair event from 1 to 21 days. Regular mainte-
nance of the PV power plant in our use case is sched-
uled for every six weeks, so we assume that in average
after 21 days (50% of 6 weeks) a failed fuse will be
found manually. We tested different minimal confi-
dences for the changepoints (0.80, 0.90, 0.95, 0.99)
and ran on raw as well as on ranked ratios.
From an algorithmic point of view, our problem
is an information retrieval problem: We know when
fuses were repaired and we are trying to find these
events using only the measurement data available.
To evaluate the quality of the results, two metrics
are typically used: precision and recall (Makhoul
et al., 1999). Precision, in our case, is the ratio of
|
repair events f ound
|
|
all repair events
|
. If the algorithm would mark more
false events than correct repair events, the ratio would
be close to zero. If, on the other hand, approximately
all repair events are found, the ratio would be close
to one. Recall is the fraction of relevant events of all
events returned. Here, recall tells us, what fraction of
all fuse repairs the algorithm can correctly be identify.
Because we only know about repair times of fuses,
we are not able to determine in every instance whether
a change-point that looks like a repair is valid or not.
It could be due to another repair or mere coincidence
(a tracker that gets unstuck by itself). Therefore, in
the results chapter and in the result tables in the ap-
pendix we only provide the recall values and not the
precision.
4.1 Results
Our annotated dataset comprises 41 different fuse re-
pairs in 2012. Each repair affected one up to six fuses
per DC input of an inverter in a given day. The al-
gorithm performed best on the derived time series of
ranked ratios in the hours 1pm to 2pm. We are able to
find 36 out of the 41 repair events when assuming a
minimal confidence of 0.95, 1000 bootstrap samples
and a maximal recursion depth of 2. The algorithm
marks all events where more than one fuse were re-
paired at the same time. If only one fuse (out of up
to 24) was repaired, we can still identify 22 out of 27
distinct events. Finding single repairs of single fuses
is the most important case, because we are interested
in applying the algorithm to fuse failures which hap-
pen individually. The recall for ranked ratios in this
case is higher than for raw ratios (0.81 versus 0.59),
please see the details in the result table 1 .
Figure 3 shows a visualization of the results of the
algorithm on one fuse repair in October 9
th
. It shows
the ranked ratios for the time interval June to Novem-
ber and the sliding average of these ratios as a human
readable indicator. The red vertical lines are change-
points automatically marked by the algorithm. We
can see the fuse repair in October (the ratios jump up)
as well as at least two suspected fuse failures in July.
For economic reasons operators are interested in
being notified about failures as quickly as possible.
We had a look at how many days the algorithm needs
to mark a change-point after the occurrence happens.
In this case, the results are the other way around: Run-
ning the algorithm on raw ratios finds single fuse re-
pair events quicker (5.31 days) than on the ranked ra-
tios (9.26 days). The detailed results can be found in
table 1. The table shows, dependent on the confidence
value and the hour of the day, how many days on av-
erage after a fuse got repaired did the algorithm mark
the repair day and what is the recall (percentage of
fuse repairs found).
As we wrote in section 4, we can’t give precision
values or the F1 measure (Sundheim, 1992), because
we don’t have data about every single repair that oc-
curred in this PV power plant in 2012. We only know
about fuse repair dates. If the algorithm marks a data
point as a change-point with a positive change of the
mean, it could be a repair we do not know about, a
tracker that gets unstuck by itself, or it could be due to
too few bootstrap samples or too low minimum con-
fidence.
It is probably not possible to reduce the number
of days needed to recognize failures/repairs signifi-
cantly. The reason is the reduced recognition power of
Figure 3: Plot of ranks of the DC/insolation ratios, showing
one repair on Oct. 9
th
as well as several potential failures.
Parameters used: confidence=0.99, maxlevel=2.
SMARTGREENS2013-2ndInternationalConferenceonSmartGridsandGreenITSystems
162

Table 1: What is the recall per hour and confidence and how many days does it take to find one open fuse (using ranked or
raw ratios)?
X
X
X
X
X
X
Hour
Confidence
0.80 0.90 0.95 0.99
ranked raw ranked raw ranked raw ranked raw
recall days recall days recall days recall days recall days recall days recall days recall days
9 0.70 0.44 10.78 12.58 0.67 0.37 11.81 13.80 0.67 0.33 12.30 13.89 0.56 0.22 14.04 14.00
10 0.70 0.33 9.93 10.33 0.70 0.33 10.48 10.44 0.63 0.33 12.04 11.11 0.59 0.33 13.85 11.78
11 0.85 0.41 8.56 4.91 0.81 0.37 9.70 4.20 0.74 0.37 11.37 4.60 0.67 0.37 13.74 5.10
12 0.81 0.74 8.52 5.50 0.81 0.63 9.48 5.12 0.81 0.56 10.15 5.87 0.78 0.48 12.33 5.31
13 0.85 0.67 7.30 4.89 0.85 0.59 7.96 4.38 0.81 0.59 9.26 5.31 0.81 0.59 11.41 5.94
14 0.85 0.63 7.48 4.82 0.81 0.63 8.93 5.41 0.78 0.52 9.63 5.71 0.74 0.41 11.89 4.36
15 0.89 0.70 6.89 5.68 0.85 0.63 7.81 5.18 0.81 0.59 8.89 5.13 0.81 0.56 10.04 4.93
16 0.89 0.59 7.89 6.75 0.81 0.56 8.89 7.07 0.81 0.56 9.52 7.87 0.74 0.48 11.33 8.38
the cusum metric within the change-point algorithm
we used, see figure 1 in (Robbins et al., 2011) for de-
tails. Change-points are generally easier to find in the
middle of a time windows than on its boundaries.
4.2 Economic Gains
We have reason to believe that the algorithm used
gives equally sound results for fuse failures as it does
for fuse repairs. The economic gains are twofold: We
reduce the outage time per failed fuse/tracker and we
need less time to find the failed fuse.
At least 81% of all single fuse failures can be rec-
ognized automatically after in average 9.26 days (us-
ing 0.95 confidence). Assuming that our results do
apply to fuse failures, we could reduce power losses
by up to 63.1% (0.81·(7 weeks - 9.26 days)=26 days
earlier than by regular inspection) if the fuses get re-
paired at the day of failure recognition.
Furthermore, the technician can be advised to in-
spect only a subset of all trackers. If a potential fail-
ure is detected on the measurements of one DC cur-
rent input, then it will be possible to send a technician
directly to the part of the PV power plant where the
trackers are located that feed their power into this in-
put. As there are 12-24 trackers connected to each
DC input, only between 2.8% and 5.6% (
12
431
to
24
431
)
of the PV power plant has to be inspected, reducing
the expenditure of time by up to 97.2%.
We did not include the recognition time for the
cases where more than one fuse was repaired at the
same time, because we have reasons to believe that
each fuse failes individually, not in bulk. Multiple
fuses failing on the same day on trackers connected
to the same DC input seem unlikely. Given this as-
sumption we can only take the single fuse cases as an
estimation for the economic loss reduction that seems
plausible.
4.3 Related Work
There are several groups working on applying state
of the art machine learning algorithms on the task of
identifying machine failures. These groups use for
example support vector machines (Widodo and Yang,
2007), neural networks (Saravanan et al., 2010), mod-
eling of the machine inner workings (Toliyat et al.,
2012) or wavelet decompositions (Peng and Chu,
2004). On the domain of monitoring pv plants there
are works on predicting failing power electronics
(Middendorf et al., 2011) and (Guenther et al., May).
A system based on a combination of dynamic re-
gression and neural networks for anomaly recognition
specifically on pv power plant data was presented by
(Sanz-Bobi et al., 2012). The authors of this pv spe-
cific paper do not give numeric results for the recog-
nition power of their method.
All these sophisticated analysis methods require
elaborate data preparation, models of the working
principles of the machines that get monitored, as well
as fine tuned parameter sets to give sufficient results.
Our attempt, on the other hand, strives to use as lit-
tle parameters as possible to be usable by domain ex-
perts in pv monitoring, not machine learning special-
ists. Other monitoring solutions also often on training
data, needing a perfectly working power plant. We
do not have such a time range. The algorithm used in
this case study has to work reasonably well without
reference/training data.
4.4 Outlook
We strive to apply the algorithm used in this paper
to find fuse failures throughout 2013. After a change-
point designating a failing fuse is found we will verify
if this is indeed the case. This procedure will allow us
to collect reliable data about the precision and there-
fore of the applicability of the change-point algorithm
to our problem as stated initially in section 2.1.
ACKNOWLEDGEMENTS
This work presented in this paper was undertaken as
part of the project EUMONIS
1
(01IS10033K and
1
http://www.eumonis.org
CaseStudy:ConditionAssessmentofaPhotovoltaicPowerPlantusingChange-pointAnalysis
163

01IS10033D), funded by the German Federal Min-
istry of Education and Research.
REFERENCES
Abdallah, S. and Nijmeh, S. (2004). Two axes sun track-
ing system with plc control. Energy Conversion and
Management, 45(1112):1931 – 1939.
Chandola, V., Banerjee, A., and Kumar, V. (2012).
Anomaly detection for discrete sequences: A survey.
Knowledge and Data Engineering, IEEE Transactions
on, 24(5):823 –839.
Draper, D. (1988). Rank-based robust analysis of linear
models. i. exposition and review. Statistical Science,
3(2):pp. 239–257.
Fu, T.-c. (2011). A review on time series data min-
ing. Engineering Applications of Artificial Intelli-
gence, 24(1):164 – 181.
Gaber, M. M., Zaslavsky, A., and Krishnaswamy, S. (2005).
”mining data streams: a review”. SIGMOD Rec.,
34(2):18–26.
Guenther, J., Rothe, M., Hefer, J., Middendorf, A., and
Lang, K. (May). Condition monitoring system
adapted for photovoltaic power converter. In Environ-
ment and Electrical Engineering (EEEIC), 2011 10th
International Conference on, pages 1–4.
Hill, T. and Lewicki, P. (2005). Statistics: Methods and
Applications. StatSoft, Inc.
Hinkley, D. V. (1971). Inference about the change-point
from cumulative sum tests. Biometrika, 58(3):pp.
509–523.
Keogh, E., Lin, J., and Fu, A. (2005). Hot sax: efficiently
finding the most unusual time series subsequence. In
Data Mining, Fifth IEEE International Conference on,
page 8 pp.
Makhoul, J., Kubala, F., Schwartz, R., and Weischedel, R.
(1999). Performance measures for information extrac-
tion. In In Proceedings of DARPA Broadcast News
Workshop, pages 249–252.
Middendorf, A., Nissen, N., Guttowski, S., and Lang, K.
(2011). Electronics condition monitoring for improv-
ing sustainability of power electronics. In Seliger,
G., Khraisheh, M. M., and Jawahir, I., editors, Ad-
vances in Sustainable Manufacturing, pages 171–175.
Springer Berlin Heidelberg.
Moore, L. M. and Post, H. N. (2008). Five years of oper-
ating experience at a large, utility-scale photovoltaic
generating plant. Progress in Photovoltaics: Research
and Applications, 16(3):249–259.
Oozeki, T., Yamada, T., Otani, K., Takashima, T., and Kato,
K. (2010). An analysis of reliability in the early stages
of photovoltaic systems in japan. Progress in Photo-
voltaics: Research and Applications, 18(5):363–370.
Papadakis, K., Koutroulis, E., and Kalaitzakis, K. (2005).
A server database system for remote monitoring and
operational evaluation of renewable energy sources
plants. Renewable Energy, 30(11):1649 – 1669.
Peng, Z. and Chu, F. (2004). Application of the wavelet
transform in machine condition monitoring and fault
diagnostics: a review with bibliography. Mechanical
Systems and Signal Processing, 18(2):199 – 221.
Perpian, O. (2009). Statistical analysis of the performance
and simulation of a two-axis tracking pv system. Solar
Energy, 83(11):2074 – 2085.
Robbins, M., Gallagher, C., Lund, R., and Aue, A. (2011).
Mean shift testing in correlated data. Journal of Time
Series Analysis, 32(5):498–511.
Sanz-Bobi, M. A., Roque, A. M. S., de Marcos, A., and
Bada, M. (2012). Intelligent system for a remote di-
agnosis of a photovoltaic solar power plant. Journal
of Physics: Conference Series, 364(1):012119.
Saravanan, N., Siddabattuni, V. K., and Ramachandran, K.
(2010). Fault diagnosis of spur bevel gear box us-
ing artificial neural network (ann), and proximal sup-
port vector machine (psvm). Applied Soft Computing,
10(1):344 – 360.
Sundheim, B. M. (1992). Overview of the fourth message
understanding evaluation and conference. In Proceed-
ings of the 4th conference on Message understanding,
MUC4 ’92, pages 3–21, Stroudsburg, PA, USA. As-
sociation for Computational Linguistics.
Toliyat, H. A., Nandi, S., Choi, S., and Meshgin-Kelk,
H. (2012). Electric Machines: Modeling, Condition
Monitoring, and Fault Diagnosis. CRC Press.
Venkatasubramanian, V., Rengaswamy, R., Kavuri, S. N.,
and Yin, K. (2003). A review of process fault de-
tection and diagnosis: Part iii: Process history based
methods. Computers and Chemical Engineering,
27(3):327 – 346.
Wayne, T. A. (2000). Change-point analysis: A power-
ful new tool for detecting changes. CTAN: http://
www.variation.com/cpa/tech/changepoint.html.
Widodo, A. and Yang, B.-S. (2007). Support vector ma-
chine in machine condition monitoring and fault di-
agnosis. Mechanical Systems and Signal Processing,
21(6):2560 – 2574.
Wirth, H. (2013). Aktuelle Fakten zur Photovoltaik
in Deutschland. http://www.ise.fraunhofer.de/de/
veroeffentlichungen/veroeffentlichungen-pdf-dateien/
studien-und-konzeptpapiere/aktuelle-fakten-zur-photo
voltaik-in-deutschland.pdf.
SMARTGREENS2013-2ndInternationalConferenceonSmartGridsandGreenITSystems
164
