
Monitoring and Visualising a Neighbourhood Area Sub-Grid
Zoya Pourmirza and John M. Brooke
School of Computer Science,The University of Manchester, Oxford Road, Manchester, U.K.
Keywords: Smart Grid, Communication Network, Neighbourhood Area, Monitoring, Sensor Network, Software
Architecture, Visualisation Tool.
Abstract: In this paper we analyse the architecture and technologies for monitoring the Neighbourhood Area Network
(NAN) of the Smart Grid. We consider the role of sensor networks in providing information about the
environment of the NAN, for example to monitor temperature and movement of vehicles and people, which
can provide useful information about changes in the loading of the NAN. The two main contributions of
this research are as follows. Firstly, we develop a software architecture for an ICT network of the Smart
Grid which could integrate information from sensors from various levels of the grid. Currently no such
architecture has been implemented for collecting data and providing the basis of Decision Support Tools
(DSTs) for the NAN level of the grid. Secondly, we have developed a visualisation interface for the human
operator of the grid, as the basis for such DSTs, which overlays the information from the sensors and the
measurements of the electrical performance of the NAN on a GIS-based view of the NAN. We describe an
actual implementation of this design currently being installed in the sub-Grid supplying the University of
Manchester which is of comparable size and complexity to urban NANs.
1 INTRODUCTION
The intelligent electrical networks called Smart Gids
incorporate communcations and information
technology to service the generation, transmission
and finally the distribution networks of the power
grid. To reflect this structure the ICT network of the
Smart Grid is divided into three networks. These
networks can be considered as the Wide Area
Network (WAN), Neighbourhood Area Network
(NAN) and Home Area Network (HAN). The lack
of research on the monitoring and predictive real-
time system control in the NAN leads us to focus on
this specific level of the Smart Grid.
We have designed and implemented a software
architecture for the ICT in the NAN. It integrates
data from smart meters for controlling building
data, wireless sensors for monitoring the
environment and devices which measure the
electrical behaviour of the power network. Finally,
based on our software architecture, a visualisation
tool has been developed which provides a basis for
Decision Support Tools (DSTs) that can be used to
plan and operate the Grid at the NAN level.
The remainder of this paper is organised as
follows: Section 2 discusses about the usage of the
sensor network in the Smart Grid. Section 3
proposes a software architecture for the ICT section
of the NAN. Section 4 presents a visualization tool
for the NAN. Finally section 5 summarizes our
contributions and presents ideas for future work.
2 THE ROLE OF SENSORNETS
Power Grids have historically been centrally
controlled, with the NAN and HAN levels being
essentially passive. Detailed monitoring at this level
has therefore not been a priority. As the Grid
evolves to a higher degree of localised control, the
types of sensors and computational units should
become more lightweight and widely deployed. We
gather two types of real-time information, firstly
measurements of the electric network itself and
secondly measurements of the environment of the
NAN. The first type of information enables the
detection of abnormal behaviour which can identify
faulty components before their failure leads to more
widespread failures of the system. The second type
enables predictions of future demand to be made
based on environmental variables that influence
local demand.
127
Pourmirza Z. and M. Brooke J..
Monitoring and Visualising a Neighbourhood Area Sub-Grid.
DOI: 10.5220/0004409101270131
In Proceedings of the 2nd International Conference on Smart Grids and Green IT Systems (SMARTGREENS-2013), pages 127-131
ISBN: 978-989-8565-55-6
Copyright
c
2013 SCITEPRESS (Science and Technology Publications, Lda.)

We choose to monitor the NAN by a WSN. We
selected TinyOS (Levis et al., 2005) sensors as a
prototype to evaluate the architectural proposal by
simulation. Accordingly, TOSSIM (Levis and Lee,
2003) the WSN simulator for the TinyOS sensors
has been selected to simulate the network. TOSSIM
has some advantages over the other WSN simulators
which will be discussed later. A range of
applications of the WSN in Distribution Networks
(of which NANs are an example) are identified in
(Pourmirza and Brooke, 2012b). The ones we are
particularly interested in are local weather condition
monitoring and lighting in order to find the relation
between these parameters and electricity
consumption.
3 MONITORING A SUB-GRID
ON A UNIVERSITY CAMPUS
In designing an ICT architecture for the NAN sub-
Grid, we choose to componentize the NAN system
into interacting sub-systems. This architecture has
various advantages such as preventing single point
of failure, dealing with a potential information flood
caused by the centralized system, and applying finer
grained monitoring and control at the level that was
blind previously. Additionally, utilising cluster
based communication and componentizing the ICT
network monitoring and the NAN results in a
scalable architecture that can cope with future
implementations and additions to the system.
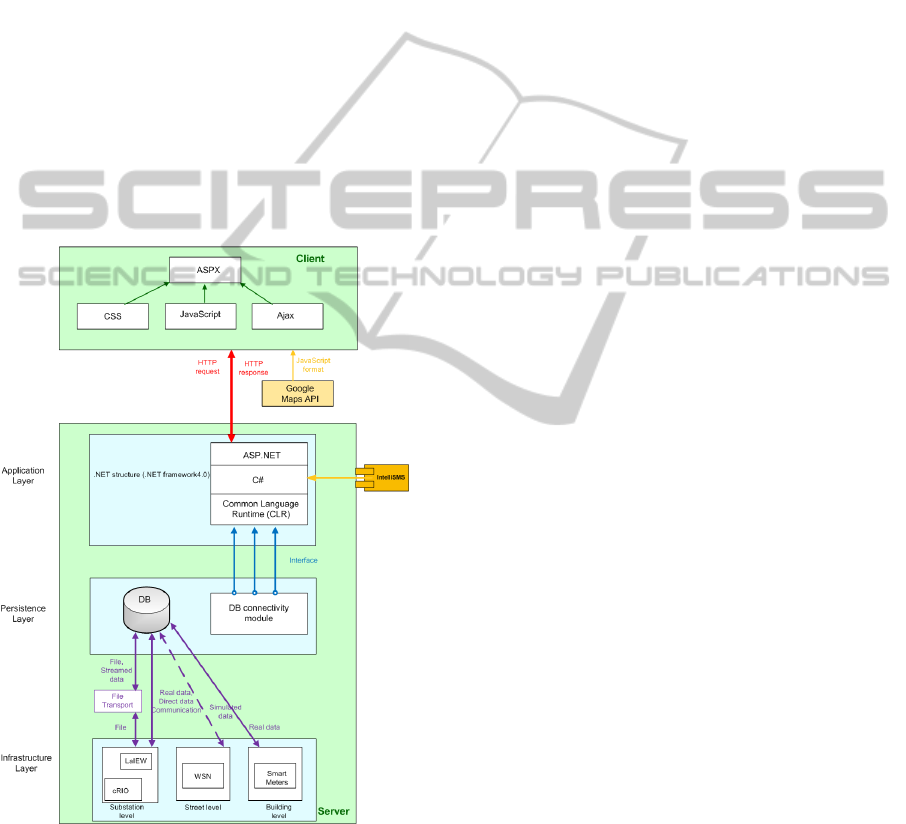
This design is currently being implemented on
University of Manchester campus. The ICT
architecture for this project (Figure 1) is based on
the network architecture described in more detail in
(Pourmirza and Brooke, 2013). It contains a server
side and a client side. The server side itself has 3
layers which are infrastructure layer, persistence
layer, and application layer. The infrastructure layer
is itself componentized into three monitoring levels,
each relating to a specific section of the NAN in the
distribution sub-Grid. The monitoring system
implemented at the building level utilises smart
meters, which are used to monitor the Home Area
Network level data. These devices are located in all
the buildings (our HAN level) in our campus test
bed, transmitting data every 30 minutes. They are
already connected to the power network and
communicate by wired connections.
The monitoring system implemented at the street
level is a wireless sensor network (WSN) which is
used to monitor the environmental data such as
temperature, light, and humidity, which are being
logged every second. These environmental data are
important for understanding and controlling the
power grid since they can provide information that
can be used to anticipate demand and improve
control actions
. These sensors run on batteries. The
battery life with a 1% duty cycle would be 6 months
(Kling, 2003). These sensors are able to alert when
they run low on battery power. Since these sensors
are grouped into clusters and have direct
communication to their cluster head the routing will
not be affected while changing the battery.
The final level of the monitoring is the substation
level monitoring. The devices used for this level are
reconfigurable real-time control and acquisition
systems called compact RIOs. 16 cRIOs are located
in each substation in our campus test bed logging
data from the electrical network four times a second.
They are connected to the power network and are
able to transmit data through wired and wireless
communication. Electrical network attributes such
as three-phase voltage, current, active power, power
factor can be monitored at this level which can be
used for fault identification, power quality analysis,
and many more applications.
At the moment the building level and the
substation level metering devices are implemented
in a real test bed, already producing live data. The
street level monitoring devices are not available yet,
thus we have used WSN simulation called TOSSIM
to simulate the data at this level. The advantage of
TOSSIM is that it enables the users to take their
implementation and run it on an actual sensor when
these are available. Thus we can test our prototype
network in the laboratory based environment and
also in a real physical environment. To achieve this,
TinyDB (Madden et al., 2005) which is a WSN
query processing engine, was extended to extract
environmental data from the electrical Grid
(Pourmirza and Brooke, 2012a). The difference
between TinyDB and a traditional DB is that, instead
of passively receiving and archiving data, we can
also receive real-time data in response to our
queries. The three monitoring levels discussed in the
infrastructure level will transmit their data to the
next layer of the architecture called the persistence
layer.
The persistence layer contains a local data base
which stores all the data received from the
infrastructure layer, and a database connectivity
module which use an interface to connect to the next
layer which is the application layer. The backup
strategy embedded in this level will enhance the
preservation of the data. Moreover it will
accommodate the ever-increasing volume of data
SMARTGREENS2013-2ndInternationalConferenceonSmartGridsandGreenITSystems
128
produced by infrastructure layer.
The application layer is a NET application which
is able to connect to the outside world, and send
HTTP request and respond to the client side. It can
use some component in case of emergency to send
alerts to the engineers in the field and grid operator
behind the screen in the control room.
On the client side we have used technologies
such as ASPX, CSS, JavaScript, Ajax, and Google
Maps API to visualise the collected data so it can be
viewed by the grid operator.
According to our knowledge this is the first
software architecture introduced for the NAN in the
distribution sub-Grid which could integrate various
level of monitoring from building level to the street
level and finally the substation level, and apply
monitoring and control over the collected data at
such level.
In the next section we will describe how this
visualisation tool operates.
Figure 1: The developed software architecture.
4 THE VISUALIZATION TOOL
FOR A NAN
While Smart Grid systems provide for automated
control of the electrical networks, human operators
are still essential players for certain monitoring and
control tasks. We have developed a visualisation
tool to enhance human understanding of
performance of the electrical network. This tool
operates at the application layer of our architecture
and provides a basis for the development of
Decision Support Tools for planning and operating
the network.
4.1 Related Work
Visualisation is an eminent method for managing
and displaying the data, which has been employed in
different engineering fields. As an example in water
distribution grids, visualisation has been used to
provide a graphical user interface that enables the
display of dynamic information and prediction of the
future state of the grid. This information can be
displayed via a Google maps based web interface
(Haines et al., 2009, Stoianov et al., 2007). The
Google map visualisation techniques can also be
applied to other networked systems, such smart
electrical grid.
A recent study by (Nga et al., 2012) proposed a
visualisation technique exploiting Google maps and
other techniques to display the data of the
distribution network in the Smart Grid. The research
mentioned above has provided a tool for monitoring
the AMI and SCADA devices. These can only
monitor and display the data of the critical areas of
the distribution grid, whereas our proposed
visualisation tool goes beyond that and can visualise
the data from all over the distribution grid.
Furthermore, our tool is able to visualise both the
electrical grid data, and also environmental data
from WSNs at street and building level. Thus all the
data collected from the infrastructure layer can be
visualised by our developed visualisation tool.
4.2 A GIS-enhanced Visualisation Tool
Our visualisation tool overlays the electrical grid and
environmental information on a map using Google
map API (Application Programming Interface). This
research is being implemented on the medium
voltage power network of the University of
Manchester campus test bed, enabling the
visualisation tool to be developed using real
equipment, real data, and the feedback from
professionals in the field. Figure 2 illustrates the
additional functionalities added to the tool as first
described in (Pourmirza and Brooke, 2012a) such as
security authentication, fault detection and alarming
MonitoringandVisualisingaNeighbourhoodAreaSub-Grid
129

system. Moreover, we have added visualisation of
the data from the smart meters, deployed in our test
bed, to the data collected from the cRIO devices in
the substations. The figure below displays data over
a period of one week. The x-axis presents the time,
here the days of a week, and y-axis represents the
power consumed by the selected smart meter. The
peak (week days) and off-peak (weekend) are
illustrated.
Figure 2: The developed visualisation tool.
4.3 Data Flow Diagram
The Figure 3 illustrates the level 1 Data Flow
Diagram (DFD) which illustrates the flow of data
and highlights the main functions carried out by the
system.
When the application is started, the Google map
GIS information will be loaded and the program will
show the map view of our test bed. Then the user
can follow three main actions. The main action is to
select the desired metering device and send request
for login to the database. After entering the correct
login information the user can extract the data from
the database and select the data table of interest for
the desired period of time and then view the data in a
new window. It can also plot the data graph.
Showing the data on a data graph enhances better
comprehension of the behaviour of the data. After
visualising the data, it will determine if any of these
data are over the defined threshold. If the threshold
is exceeded then the tool will send an alert to any
operators who have subscribed to it. For sending the
alert it will follow two main actions. Firstly in order
to send the passive alert it will highlight the over
threshold data for the operator behind the screen.
Secondly in order to send the active alert it will send
text messages to the engineers in the field by using
IntelliSMS component. It will inform them about the
actual fault and time and location of it.
In addition there are two other flows that the user
can follow. S/he can check the schematic view of the
test bed and locate the desired metering devices on
schematic map. The final flow is to start the
TinyDB, in order to generate the environmental data
and then send these data to the WSN simulator.
Finally the user can select the WSN simulator on the
visualisation tool and visualise the environmental
data collected from the street level. All these
collected data can then be used as an input for
control algorithms of the grid.
5 SUMMARY AND FUTURE
WORK
This research was undertaken to design an ICT
architecture for the neighbourhood area of the Smart
Grid (NAN), to analyse the various communication
technology, and to find the most appropriate choices
for this specific section of the grid. The present
study justifies the need for having a sensor network
alongside the power grid, and determines its possible
applications in the future grid.
This paper described how we have designed and
implemented a software architecture which is
partially applied to the real test bed in the electrical
network sub-Grids. We explain how we collect real
data and how we use simulation to tune the
implementation of the architecture on a real test bed.
The main concern of this research is that it will
enable information to be gathered from the working
of a real system operating a sub-Grid level where
monitoring has not previously been deployed.
The key contribution of our work is that it can
deliver the information from the building levels,
environmental conditions, and finally from the
power grid below 33 kV which remains unknown
until now. According to our knowledge there is no
previous architecture that could integrate all the
information as a whole system for this level of the
electrical Grid and present them via visualisation
tool. This tool acts an essential component in
operation and planning of the system.
In future, more work needs to be done to add
Web Services to this architecture and to add more
functionality to the visualisation tool. For example,
automatically detecting the failure of nodes and
alerting the field engineers. Finally, a further stage
of this research is to investigate control strategies,
for the NAN level of the Grid, to further the
decentralised control of the whole Grid.
SMARTGREENS2013-2ndInternationalConferenceonSmartGridsandGreenITSystems
130
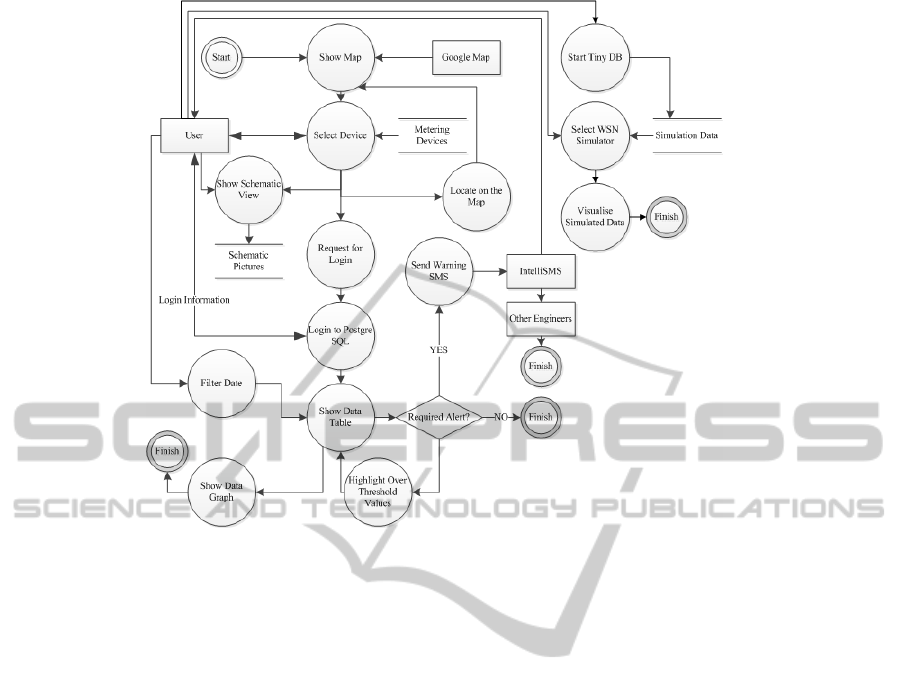
Figure 3: The DFD diagram.
REFERENCES
Haines, R., Khan, K. & Brooke, J. 2009. Bringing
simulation to engineers in the field: a Web 2.0
approach. The Royal Society, 2635-2644.
Kling, R. 2003. Intel Research mote. Santa Clara, USA:
Intel Corporation Research.
Levis, P. & Lee, N. 2003. TOSSIM: A Simulator for
TinyOS Networks. University of Berkeley.
Levis, P., Madden, S., Polastre, J., Szewczyk, R.,
Whitehouse, K., Woo, A., Gay, D., Hill, J., Welsh, M.,
Brewer, E. & Culler, D. 2005. TinyOS: An Operating
System for Sensor Networks Ambient Intelligence.
Springer Berlin Heidelberg.
Madden, S. R., Franklin, M. J., Hellerstein, J. M. & Hong,
W. 2005. TinyDB: An Acquisitional Query Processing
System for Sensor Networks. ACM Transactions on
Database Systems, 30, 122–173.
Nga, D. V., See, O. H., Quang, D. N., Xuen, C. Y. &
Chee, L. L. 2012. Visualization Techniques in Smart
Grid. Smart Grid and Renewable Energy, 3, 175-185.
Pourmirza, Z. & Brooke, J. 2012a. An Experimental
Communication Architecture for Monitoring and
Control of Sub-Grids. In: SMARTGREENS 2012 - 1st
International Conference on Smart Grids and Green
IT Systems, 2012a Porto, Portugal. SCITEPRESS –
Science and Technology Publications, 67-72.
Pourmirza, Z. & Brooke, J. M. 2012b. The Monitoring
Network Architecture in the Neighbourhood Area of
the Smart Grid. Salford Postgraduate Annual Research
Conference (SPARC). Salford, UK.
Pourmirza, Z. & Brooke, J. M. 2013. The Wireless Sensor
Network and Local Computational Unit in the
Neighbourhood Area Network of the Smart Grid. In:
International Conference on Sensor Networks
(SENSORNETS), 2013 Barcelona, Spain.
SCITEPRESS – Science and Technology Publications,
84-88.
Stoianov, I., Nachman, L., Madden, S. & Tokmouline, T.
2007. PIPENETa wireless sensor network for pipeline
monitoring. In: Proceedings of the 6th international
conference on Information processing in sensor
networks, 2007 Cambridge, Massachusetts, USA.
1236396: ACM, 264-273.
MonitoringandVisualisingaNeighbourhoodAreaSub-Grid
131
