
SourceMiner
A Multi-perspective Software Visualization Environment
Glauco de F. Carneiro
1
and Manoel Gomes de Mendonça
2
1
Computer Science Department, Salvador University (UNIFACS), Bahia, Salvador, Brazil
2
Computer Science Department, Federal University of Bahia (UFBA), Salvador, Bahia, Brazil
Keywords: Software Visualization, Software Comprehension, Multiple View Environments.
Abstract: In spite of the available resources provided by modern IDEs, program understanding remains as a very
difficult and important task in software engineering. This paper presents a software visualization
environment named SourceMiner. Implemented as an Eclipse plug-in to enhance software comprehension
activities, SourceMiner is an extensible, interactive and coordinated multi-perspective environment. It is
multi-perspective because it provides sets of views that allow programmers to look at the software from
different points of view. It is coordinated because views are linked to each other, and consistently respond to
the actions executed by the programmers on the environment. It is interactive in the sense that programmers
can dynamically configure visual scenarios to better support the building of mental models. It is extensible
because its architecture was designed to facilitate the inclusion of new views to the environment. This paper
describes the principles behind the design of SourceMiner, and discusses how it has been used to support
software comprehension activities such as the identification of code smells and the characterization of
object-oriented software systems.
1 INTRODUCTION
Many researchers have pointed out the important
role that visualization plays in interactive data
analysis and information exploration (Baldonado et
al., 2000); (Becks and Seeling, 2004). Humans have
the natural ability to track and detect visual patterns
and this ability can be exploited to improve software
comprehension. Software visualization (also known
as SoftVis) is a means to provide perceivable cues to
several aspects of software systems in order to
reveal patterns and behaviours that would otherwise
remain hidden to the programmer (Storey, 2006).
The design and use of software visualization
environments should take into account three
important issues. The first is that software is
eminently complex, hindering many of the software
comprehension activities. The second, described by
Lehman´s second law (Lehman and Belady, 1985),
is that software evolves as it is subject to
modifications over time. It is difficult to follow
those changes and more resources are needed to
understand them. The third is that software is
intangible, having no physical shape (Ball and Eick,
1996). Considering that humans acquire more
information through vision than through all the other
senses combined (Ware, 04), the comprehension is
affected by the lack of visual presence that
characterizes software as an entity. This difficulty is
increased by the complexity and constant evolution
of software systems.
Common software engineering tasks, such as the
identification of code smells, usually require
analyzing the software from multiple perspectives
(Carneiro et al., 2010). Moreover, to be effective,
software visualization environments must provide
complementary perspectives which together can
support diverse software engineering tasks. Each
perspective should present the software from a
certain point of view that focuses on the
comprehension of specific software properties. If
these properties are complex, the perspective itself
may require multiple views. A single visual
metaphor may not be sufficient to portray the
relevant peculiarities of such properties.
Multiple coordinated views can facilitate
comparison (Heer and Shneiderman, 2012). The
usage of multiple views is very difficult if the views
are not coordinated among themselves and with the
environment in which they operate. It is confusing,
for example, if two views have different meanings
25
de F. Carneiro G. and Gomes de Mendonça M..
SourceMiner - A Multi-perspective Software Visualization Environment.
DOI: 10.5220/0004420400250036
In Proceedings of the 15th International Conference on Enterprise Information Systems (ICEIS-2013), pages 25-36
ISBN: 978-989-8565-60-0
Copyright
c
2013 SCITEPRESS (Science and Technology Publications, Lda.)

for the same visual attribute (e.g., node color). Also,
visual elements from different views should be
linked to each other when they represent the same
software entity. The selection or change in one such
element of a view must be reflected in the others.
One should also be able to easily navigate between
visual elements from different views. And actions in
these visual elements should have consistent
response over all the views. Although, view
coordination is a requirement for the use of multiple
views in information visualization (Baldonado et al.,
2000); (Heer and Shneiderman, 2012), and well used
in modern IDEs, it is still a concept that needs to be
better explored in software visualization
environments (Storey, 2006).
Views are based on visual metaphors that must
match the data and task at hand. Graphs, for
example, are very useful to visualize relational data,
but do not scale well if the number of entities and
relations grows. Information visualization and
software visualization researchers have proposed
many metaphors to visually present data.
Unfortunately, it is not yet clear what sets of visual
metaphors are best suited for most software
engineering tasks. For this reason, a software
visualization environment should facilitate the
inclusion of new visual metaphors to its workbench.
The purpose of this extensibility should be more
than simply facilitating the growth of the number of
views in an environment. It should aid
experimentation and support the identification of
which sets of views can be effectively combined for
common software engineering tasks.
Software visualization environments must also
be highly interactive. Good visualization needs to
exploit the visual and cognitive systems of human
beings. Programmers need to interact with the
environment in order to configure the visual scenario
to best fit their needs. They need widgets to filter,
zoom, navigate and browse through visual
metaphors. These mechanisms should support users
in adjusting visual scenarios in aspects such as
information content, visual mapping, and view
configuration.
The use of multiple views in SourceMiner better
handles the diversity of attributes, user profiles, and
levels of abstraction needed in software
visualization. It enables users to configure and
effectively combine views to bring out correlations
and or disparities that might otherwise remain
hidden in the code. The use of multiple views splits
complex data into more manageable chunks of
information, and this information can be further
filtered and explored through interaction with the
different visual scenarios.
This paper presents SourceMiner, a software
visualization environment that provides a set of easy
to comprehend, complementary, coordinated and
highly interactive views. It uses code as its main
data source and was implemented as an Eclipse
plug-in to interactively visualize Java projects,
complementing the native views and resources
provided by the Eclipse IDE. It provides
programmers with several ways to interact with the
views: filters to visually present information that
match filtering criteria, semantic and geometric
zooming to better adjust the views to the canvas,
arranging them in accordance with the preference of
the programmer, and transparent navigation from the
visual representation to the source code.
The rest of this paper is organized as follows.
Section 2 motivates the work with a scenario of use
of an IDE with and without SourceMiner. Section 3
introduces information visualization concepts that
are relevant to the design of multiple view
environments. Section 4 presents a conceptual model
for multiple view environments. Section 5 presents
SourceMiner architecture and design. Section 6
describes SourceMiner perspectives and their
respective views. Section 7 presents examples of use
of SourceMiner. And, Section 8 has the final
remarks of the paper.
2 CURRENT VERSUS PROPOSED
SCENARIO
This section motivates the integration of extensible
software visualization environments into modern
IDEs. It first describes an example of the use of the
Eclipse IDE. In the sequence, it illustrates how a
software visualization environment can improve this
use.
Modern IDEs are very sophisticated, but in spite
of the resources they provide, program
understanding remains a very difficult task,
especially on large and complex software systems.
Typically, different types of information are required
for executing software engineering tasks, such as
fixing errors, changing or adding new features, or
improving the code and design.
Consider the information about the code
structure presented by the Eclipse´s package
explorer (package-file-class-methods and attributes
hierarchy) as an example. This information is useful
but limited. The package explorer alone is
insufficient to support most development or
maintenance tasks. One has to combine it with other
ICEIS2013-15thInternationalConferenceonEnterpriseInformationSystems
26
views. Moreover, the package explorer itself could
be augmented with more information. It does not
present data related to software metrics, such as code
size or complexity for example. In fact, most of the
modern IDEs do not yet have specific views to show
this type of property. This is very useful information
and it is desirable to expand the IDEs with them.
The question is how to do that. There are many
forms in which an IDE can be visually enriched.
Eclipse itself provides a comprehensive
infrastructure to develop such features. A possible
approach is to extend this infrastructure further to
support common information visualization
functionalities (Baldonado et al., 2000); (Card et al.,
1999), on top of that enrich the IDE with diverse but
integrated software visualization resources, and
finally evaluate them in different software
engineering tasks.
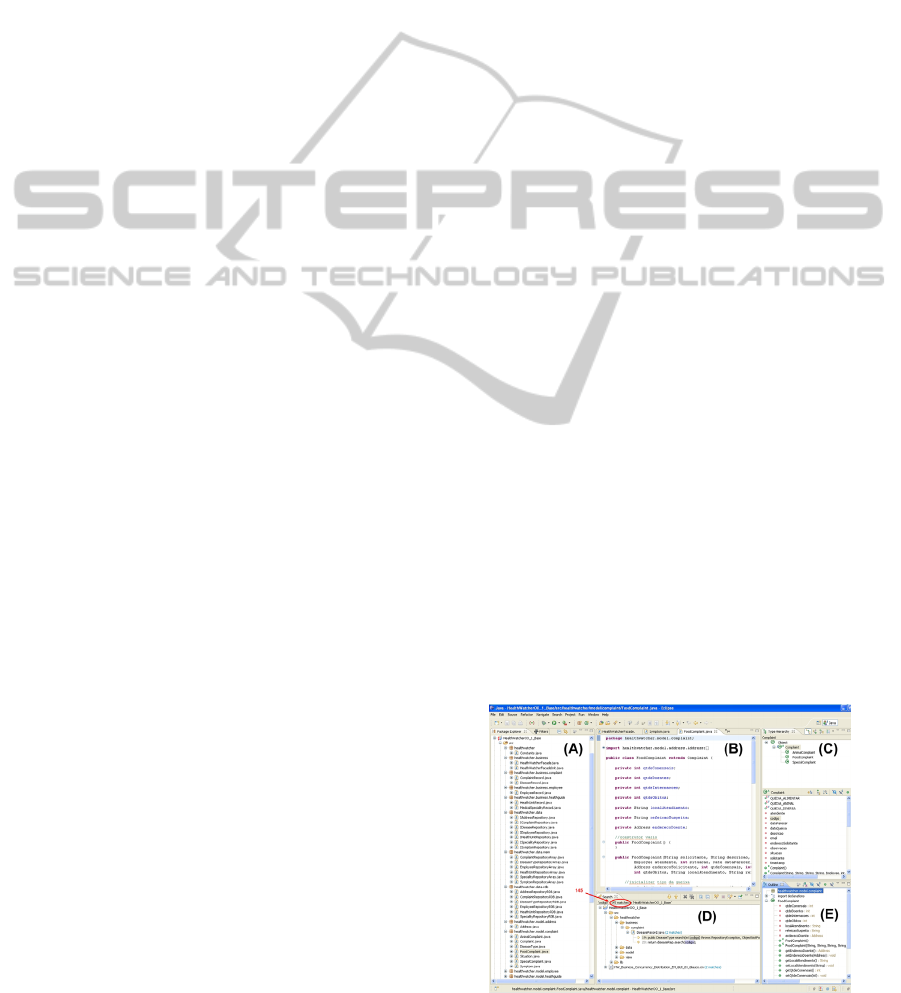
In order to discuss some of the limitation of
modern IDEs, Figure 1 shows a snapshot example of
the Eclipse IDE on a typical software engineering
task. This snapshot was taken from a real world case
study on the detection of bad smells. During the
execution of this task, the Package Explorer view
(Part A) may include hundreds of nodes just after a
few navigational clicks through project files and
classes. Hierarchical relationships, in this case, are
no longer visible without manually scrolling through
the tree. In part thanks to how easy Eclipse makes
navigating over structural relations, the number of
open files in the editor (Part B) can also increase
quickly, making the instances of the editor a poor
representation of the files currently relevant to the
task. The search in Eclipse for references to a class
within the project (Part D) can return hundreds of
items and there is no convenient way to search only
for those elements related to the task at hand.
Instead, the search results (145 in our example)
require manual inspection, if someone wants to find
the elements of interest. Even the Outline view (Part
E), that shows only the structure of the current file,
can be overloaded with dozens of elements that
might not be relevant to the task.
Modern IDEs also need to better explore
interaction resources as mentioned earlier in this
paper. The work presented here addresses these
issues from a software visualization perspective. It
enhances the IDE with an extensible software
visualization environment. Its views are integrated
among themselves and with the IDE.
In order to illustrate the solution, Figure 2 shows
a screenshot of SourceMiner. The arrows indicate
how a specific class of a Java software system called
HealthWatcher (Greenwood et al., 2007) is
portrayed in multiple views. The editor (in Part B)
shows part of the source code of the class and the
Package Explorer (Part A) shows the structure
comprised of packages, classes, methods and
attributes using a traditional structural view. These
are native views of the Eclipse IDE. The Parts D, E
and F show three different views of SourceMiner.
Like the Package Explorer, the view in Part D
represents the package-class-method perspective of
the system. However, it does so using treemaps
(Shneirderman, 1992), a hierarchical visualization
metaphor that represents all packages, classes and
methods of a project as nested rectangles.
Programmers do not need to scroll to see any
element of the structure because they are all there.
The view in Part E represents an inheritance
hierarchy perspective of the project using a
polymetric view (Lanza and Marinescu, 2006).
Eclipse does not have a native view to portray the
inheritance hierarchy of the software system. The
view in Part F represents a coupling perspective of
the system using a grid (chessboard like) view to
indicate the most coupled modules of the software
project.
Views D, E and F are directly affected by the
view in Part C. This filtering view enables users to
apply filtering criteria to views D-F simultaneously.
In the example, a user typed the string
HealthWatcherFacade as a class name filtering
option to highlight occurrences that match the typed
string in all views. This is an example of the data
transformation interaction level discussed earlier, a
filtering resource that is not natively available in
modern IDEs.
The goal here was to highlight that the proposed
approach portrays the software from several
perspectives, enhancing IDE native views and
resources. And, that it does so with a fully integrated
set of views that support several levels of
interactions, as it will be discussed next.
Figure 1: Eclipse IDE on a Typical Task.
SourceMiner-AMulti-perspectiveSoftwareVisualizationEnvironment
27
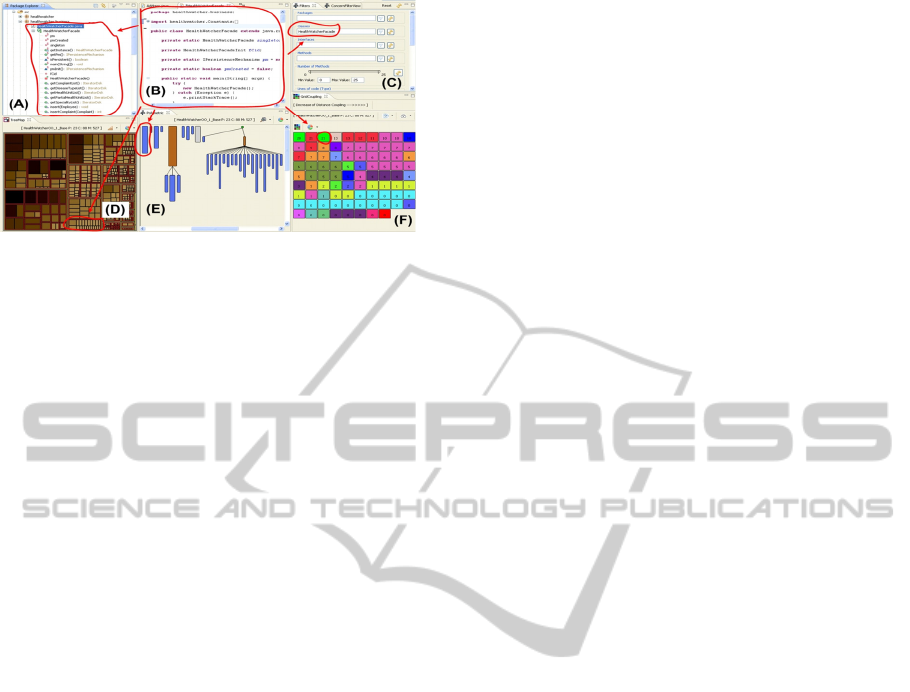
Figure 2: An Example of Use of SourceMiner.
3 INFOVIZ CONCEPTS
Software visualization is a specialization of
information visualization. For this reason, a
reference model for a Multi-Perspective
Environment (MVE) must use concepts drawn from
the InfoVis field. Information visualization
researchers identified three main levels of
interactions in multi-perspective environments (Card
et al., 1999). The first, and most common, is
interface interaction for view configuration. It is
related to how the visual elements are configured
and arranged in the visual scenario.
The second level of interaction deals with the
dynamic mapping between the real attributes (of the
software, in our case) and the visual attributes that
are used to represent them on the canvas. Users
should be able to configure the way software
properties such as size or complexity will be
represented on the views. The third level consists in
dynamically filtering and selecting the data to be
represented on the canvas. Selective data
visualization is very useful to locate relevant
information, to restrict visualization to interesting
portions of the data and to control the level of detail
at which the information is presented. Too much
data may hinder visual scene interpretation, and too
little neglects potentially important information.
As mentioned before, information visualization
systems usually require this process to be highly
interactive. In it, the user should be able to change
the selected data to be presented on the canvas,
modify the mapping between real and visual
attributes, and alter the way views are rendered on
the canvas (zooming or panning over it). To be
effective, the response time between these
interactions and reassembling the views should be as
short as possible.
Multiple Perspectives and Multiple Views. A
view is a particular visual representation of a data
set. Complex data sets typically require multiple
views, each revealing a different aspect of the data.
Multiple view systems have been proposed to
support the investigation of a wide range of
information visualization topics. The reference
model proposed by Card and colleagues is adapted
in this paper to explicitly emphasize the use of
multiple views on software visualization.
Distinct views should be used if they reveal
dissimilar aspects of the conceptual entity presented.
In complex domains, such as software engineering,
no single all-inclusive view is likely to lead to
insight. In this context, multiple view systems
portray complementary information that supports
complementary cognitive processes. One view can
be used to constrain possible (mis)interpretations in
the use of another. In fact, multiple views encourage
users to construct a deeper understanding of the
analyzed data.
Multiple views must be consistently designed to
provide integration and coordination among
themselves. Users should be able to select a subset
of views in a coordinated fashion to perform a task
(Baldonado et al., 2000). The visualization
environment should support the interactive
exploration of views to uncover facts or
relationships that otherwise would remain hidden
(Baldonado et al., 2000). Each single view should
have affordances (e.g. selection capabilities or
navigation functionalities such as panning and
zooming). These affordances should be tied together
so that actions in one view have an effect in another
view (Baldonado et al., 2000). These observations
are expressed as three important concepts proposed
by information visualization researchers and adopted
in our work: a) navigational slaving – multiple
views systems should enable that actions in one
view are automatically propagated to the others
(Shneiderman and Plaisant, 2009); b) linking –
multiple views systems should connect data in one
view with data in the other views (Shneiderman and
Plaisant, 2009); c) brushing – multiple views
systems should enable that corresponding data items
in different views are highlighted simultaneously
(Shneiderman and Plaisant, 2009).
4 A CONCEPTUAL MODEL
FOR MULTIPLE VIEW
SOFTWARE VISUALIZATION
Many software visualization projects have been
conceived as standalone systems, but we consider
IDEs as the ideal substrata on which a Multiple
ICEIS2013-15thInternationalConferenceonEnterpriseInformationSystems
28
View Environment (MVE) should reside. Integrating
software visualization environments into IDEs is a
natural way to support software comprehension
activities. In fact, current IDEs already offer several
resources to support software comprehension. Most
of them offer at least a syntax directed editor that
uses pretty printing and colour textual representation
of the code, as well as some sort of hierarchical
representation of the project structure. Usually,
several other views present valuable information to
programmers, representing the software from many
different perspectives (e.g., the package explorer of
Eclipse and outliner). They also provide different
ways of searching, navigating and browsing
software entities. A natural consequence of using an
IDE as an MVE substratum is that programmers will
be able to interchangeably and concurrently access
source code, the views originally provided by the
IDE and the views from the MVE (Lintern et al.,
2003).
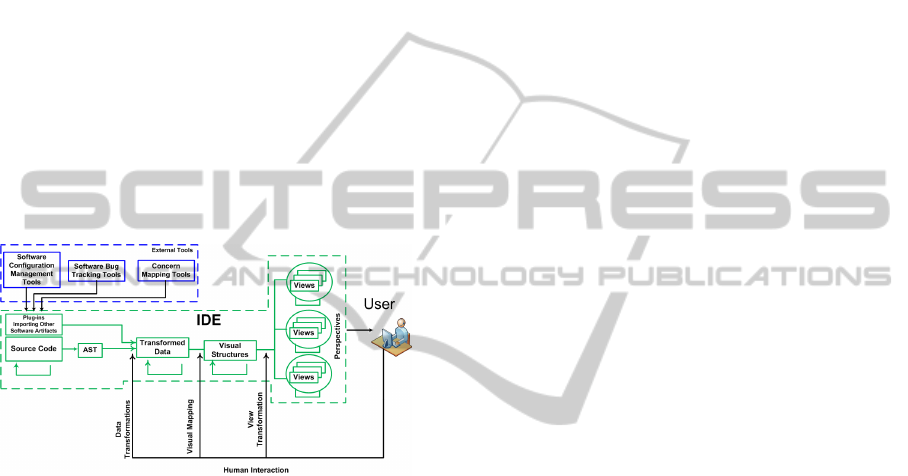
Figure 3: A Reference Model for SoftViz.
Figure 3 illustrates how we adapted the Card et al.
reference model to the software engineering domain.
The goal here is to provide a set of coordinated and
cross-referenced views integrated to a modern IDE.
Similarly to the original, the adapted model also has
three main interaction levels: data transformations,
visual mapping and view transformation
interactions.
The multiple views are used to represent
different properties of the software. For example,
one can build a visualization of module inheritance
and another of module coupling. Different
representations can also be employed to portray the
same property in various ways. For example, module
coupling can be represented by interactive graphs or
relationship matrices. In this case, each
representation should emphasize a different aspect
of the property under analysis or should have
complementary affordances to facilitate the visual
interpretation of the portrayed information. In order
to be precise, we use the expression multiform
visualization when referring to different views
(forms) being used to describe the same software
property. Also, as discussed previously in this paper,
multiple views should be coordinated so an action
taken in one view should be reflected on all the other
views of the environment. In this scenario, we use
the expression multiple coordinated views as
opposed to simply multiple views
Figure 2 emphasizes view coordination in the
model. The feedback arrows around the views
indicate this fact. The use of multiple coordinated
views and multiform representations are suitable to
support programmers in exploring over complex
information spaces (Wu and Storey, 2000); (Graham
and Kennedy, 2008). The idea of having multiple
coordinated views strives for visually combining
different aspects of data in different displays (Becks
and Seeling, 2004). In software engineering,
multiple views are intended to help raising the level
of abstraction and reduce the amount of information
required to perform recurrent software engineering
tasks, especially when they are coordinated and
cross referenced (Storey, 2006).
The model also emphasizes that the IDE is the
main data source of a software system. The data
available at the IDE is accessed, transformed,
mapped to visual structures and rendered as views.
Current IDEs allow for easy extraction of source
code information from native resources such as the
software system Abstract Syntax Tree (AST).
Additional information – such as concern maps,
churning information and defect data – can be
captured from external data sources and used to
enrich the views (Carneiro and Mendonça, 2013), as
shown on the top-left box of Figure 3.
5 A MULTIPLE VISUALIZATION
ENVIRONMENT
FOR THE ECLIPSE IDE
The challenge of building and coordinating multiple
views and multiform systems far exceeds the
challenge of building a single view system. Figure 4
presents the layers and the modules of SourceMiner.
This high level architecture is divided into a two
layers. The Rendering and Visualization (RV) Layer
is responsible for rendering the views provided by
SourceMiner. The Core Visualization Environment
(CVE) is responsible to capturing information from
the IDE and structuring it for the RV Layer. It also
coordinates all views among themselves and the
IDE. The following subsections describe the
functionalities provided by each of these layers.
SourceMiner-AMulti-perspectiveSoftwareVisualizationEnvironment
29
The Core Visualization Environment (CVE) is
the kernel of SourceMiner. It is responsible for
extracting data from a project source code using the
resources provided by the Eclipse Java Development
Tool (JDT) to this end. JDT provides fundamental
information on software entities avoiding the
creation of such functionality from scratch. This
made it possible to focus most of our efforts on how
to extend the environment with views, coordination
and interaction resources, and it is a clear advantage
of using an open IDE as a substratum for a MVE.
Besides extracting and structuring data about the
software system under analysis, the CVE provides
services of coordination among views, filters the
data to be presented in the views and logs the
primitive operations performed by the users while
they use the environment. The CVE uses IDE
resources to coordinate the environment with the
IDE itself. The next subsections present the modules
that comprise the CVE layer.
The Rendering and Visualization (RV) layer is
responsible for rendering the views in SourceMiner.
To accomplish this task, this layer relies on the
services provided by the Core Visualization
Environment (CVE). The modules that comprise the
RV layer are the Views, the Filtering Views and the
Decorator modules. The following subsections
describe these modules.
6 PERSPECTIVES AND VIEWS
IN SOURCEMINER
Currently SourceMiner has three classes of views or
perspectives: the package class method,
inheritance hierarchy and coupling views. As
described earlier, a perspective is a set of views that
represent the same type of software properties. The
combined use of these perspectives provides a broad
range of information to programmers when
executing software engineering tasks.
We considered several metaphors from the
InfoVis and we ended-up adopting the following
ones: (i) treemaps (Shneirderman, 1992) for the
package-class-method perspective; (ii) polymetric
views (Lanza and Marinescu, 2006) for the
inheritance hierarchy perspective; and (iii) several
views for the coupling perspective, namely, class
and package node-link-based dependency graphs,
grids and spiral egocentric graphs, and methods,
classes and package relationship matrices.
All SourceMiner views were implemented from
scratch. Two of them, the grid and spiral egocentric
graph, are novel contributions. The others were not
proposed by the authors, but completely re-
implemented by us according to our software
visualization needs.
The Package Class Method View. Structural
information like the package-class-method structure
plays an important role in software comprehension
activities (Storey, 2006). Most of the IDEs provide
at least one view that portrays the PCM structure.
One such example is the Package Explorer in the
Eclipse IDE. This traditional view does not scale
well and usually present only the structure per se.
There is room for enriching such views with other
visual clues such as colors, position and the size of
figure elements. These cues can be used to represent
important software properties such as size, version,
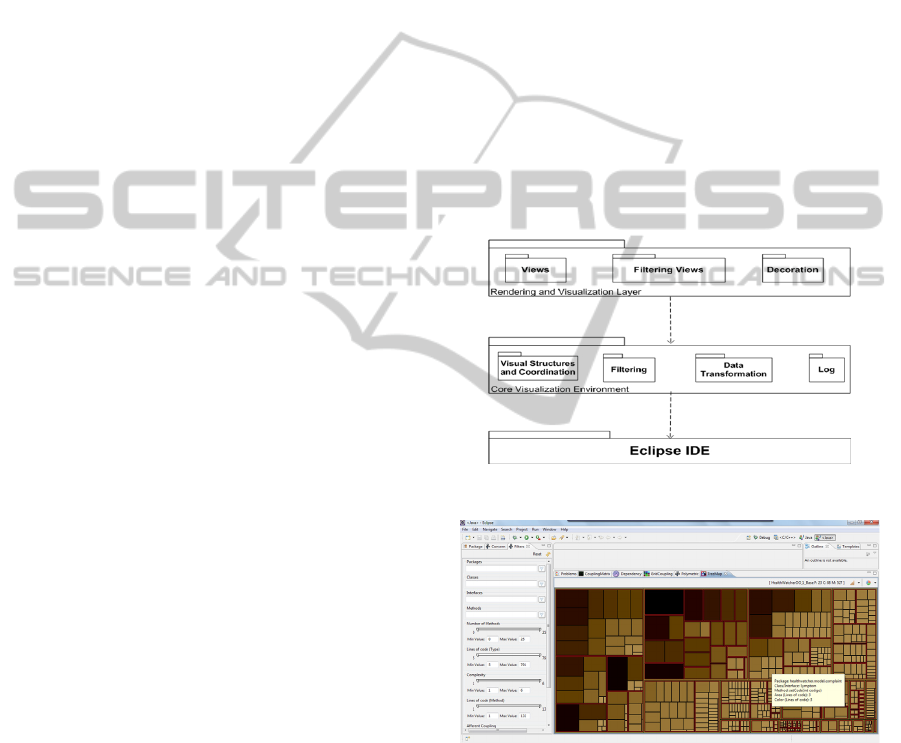
churning, and element type. We selected Treemaps
as an alternative visual metaphor to create a PCM
view in SourceMiner. Treemaps are 2D
visualizations that map a tree structure using
recursively nested rectangles (Shneirderman, 1992).
Figure 4: SourceMiner Layers.
Figure 5: Treemaps in SourceMiner.
They are a very effective way of representing
large hierarchies. And, besides the hierarchy itself,
they can show other data attributes using the
rectangle size (area) and color. Each rectangle of the
treemap portrays a node of the represented the PCM
hierarchy. The structure is scalable and facilitates
the discovery of patterns and outliers. It makes it
easy to spot outliers in terms of module size and
number of sub‐modules, for example. An example of
ICEIS2013-15thInternationalConferenceonEnterpriseInformationSystems
30
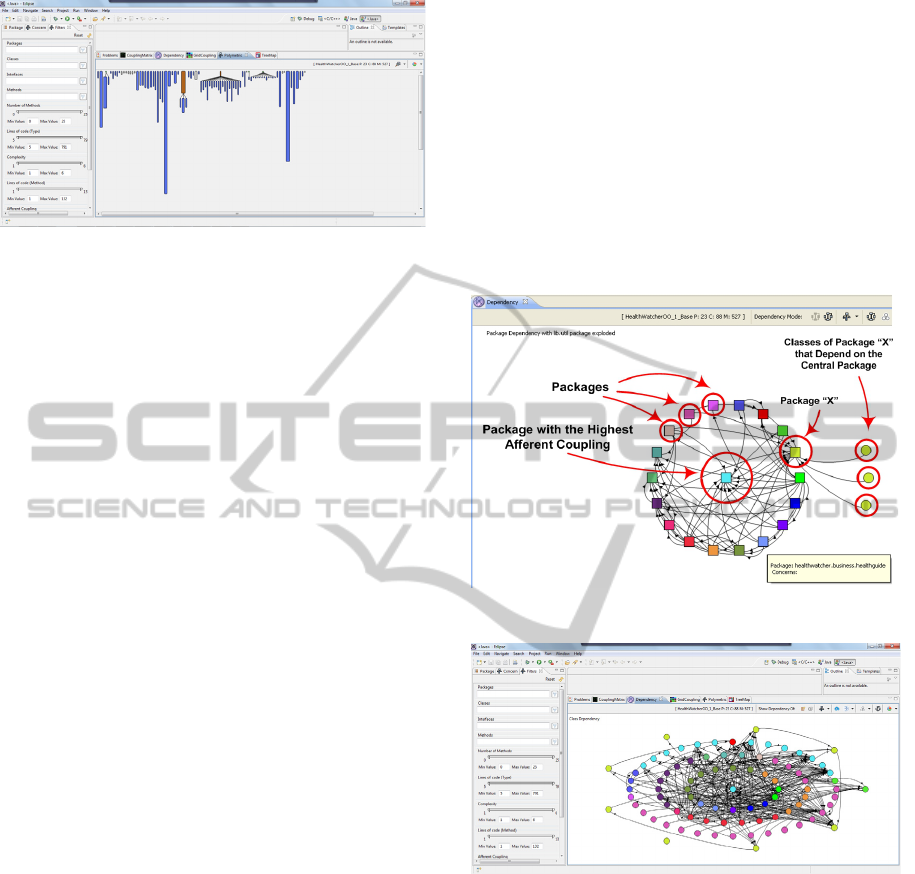
Figure 6: Polymetric in SourceMiner.
treemap in SourceMiner is portrayed in Figure 5.
As with any SourceMiner view, users can apply
filtering criteria to eliminate elements from the
treemap PCM view. The views provide direct access
to their corresponding source code. For that, the user
has just to control-click on a graphical element. The
RV layer will then request that the Integration and
Coordination Module on the CVE Layer activates
the Eclipse Editor for the corresponding source code
element (method, class or interface).
The Inheritance Hierarchy View. The
polymetric view (Lanza and Ducasse, 2003) was
selected to portray the inheritance hierarchy of a
software system. It portrays inheritance relationships
between the software entities (class/interface) as a
forest of round rectangles. Originally proposed for
this very purpose, polymetric views help to
understand the structure and detect problems of a
software system in the initial phases of a reverse
engineering process (Lanza and Ducasse, 2003). As
can be seen in Figure 6, the view is a two-
dimensional display that uses rectangles to represent
software entities, such as classes and interfaces, and
edges to represent inheritance relationships between
them. The dimensions of the rectangles are used to
represent properties of the entities. In SourceMiner,
the width corresponds to the number of methods
while the height to the number of lines of code of a
class or interface. The color is used for decoration
just like discussed before. A geometric zoom is
available to better display the polymetric view in
accordance with the number of elements on the
canvas. A semantic zoom can also be used to
navigate over specific sub-trees of a portrayed
hierarchy.
The Coupling Views. Portraying coupling
relationships is significantly more complex than the
two previous perspectives. There are many types of
coupling relationships: classes extend classes, call
methods, use fields, implement interfaces, just to
name a few. One may also be interested in other
types of information, such as coupling direction or
strength. Also, some views are good to portrait
detailed information, but for this very reason they do
not scale well. As a result, one single view cannot
efficiently support all coupling visualization goals.
SourceMiner provides three sets of coupling views:
graph-based coupling views, matrix-based coupling
views and grid/egocentric-based coupling views. All
these views are represented in Figures 3-9 in
(Carneiro and Mendonça, 2013). They illustrate the
use of the multiform visualization concept, i.e.,
many views are used to represent the same type of
property.
Figure 7: Package Dependency in SourceMiner.
Figure 8: Class Dependency in SourceMiner.
Figure 7 conveys a package graph coupling view. It
uses square nodes to highlight this fact. As seen in
the figure, any of the peripheral package nodes can
be selected to have its composing classes revealed as
round nodes. In this case, SourceMiner only shows
the classes that justify the coupling relations with the
central node.
The node-link-based graph in Figure 8 clearly
exhibits a high amount of visual clutter as a result of
edge congestion. We decided to implement matrix
views as an option to the graph views. They have a
cleaner and more uncluttered layout. In
SourceMiner, a matrix of rows and columns are
configured to show different levels of coupling
SourceMiner-AMulti-perspectiveSoftwareVisualizationEnvironment
31
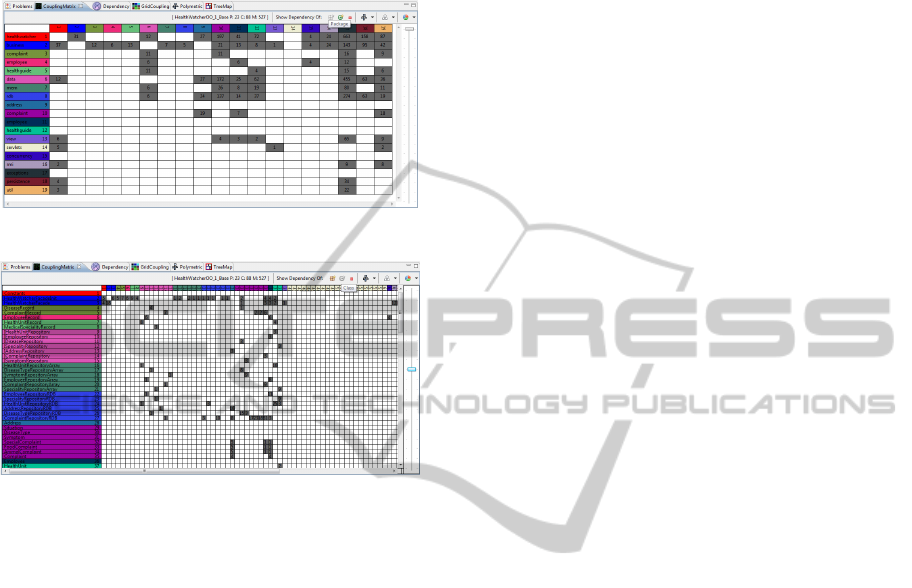
relationships between software elements (package,
classes and methods). Figure 9 portrays an example
of a package dependency matrix and Figure 10
shows an example for classes.
Figure 9: Package Dependency Matrix in SourceMiner.
Figure 10: Class Dependency Matrix in SourceMiner.
SourceMiner also allows for semantic zooming over
the matrices. This is achieved by double clicking on
a gray cell. This action brings out a new coupling
matrix that semantically details the selected
dependency. For example, by clicking on a package
dependency cell of Figure 9, the user will obtain a
class dependency matrix involving all classes that
originated the selected dependency as portrayed in
Figure 10. This type of action also works from class
to method dependency matrices. The transition is
bidirectional, meaning that the user can backtrack to
the original matrix by simply right clicking on the
view canvas.
The grid view conveyed in Figure 6 in (Carneiro
and Mendonça, 2013) was especially conceived and
implemented for SourceMiner. The goal of this view
is to specifically focus on the strength of
dependency between modules of a software system,
i.e. the number of syntactic references from a
module to another. This is quite different from the
previous two views which focused on the degree of
dependencies. The grid is a chessboard-like view
that plots all classes of the system as rectangles
arranged in decreasing order of dependency strength
value (DSV). The rectangle representing the class
with the highest DSV is placed on the top left corner
of the grid. The DSV of a class is the sum of the
values of the dependencies between this class and all
the others. Colors are used for decoration of grids in
the same way as discussed earlier for the other
views.
7 SOURCEMINER IN PRACTICE
This section illustrates the use of SourceMiner in a
typical software comprehension activity: the
identification of code smells. It was conducted as an
observational study in which SourceMiner was used
to identify code smells in an in-vitro setting. We also
briefly describe two ongoing works using
SourceMiner in industrial settings. The first is a case
study in which professional programmers used
SourceMiner to characterize a heavily used web
development framework. The second is a case study
in which SourceMiner was used to analyze how a set
of similar java-web applications are being developed
in a public administration organization. The three
situations reveal initial evidences that the execution
of the described activities would be harder or even
impossible to do through the use of a single view.
The first study illustrates how SourceMiner aids
the identification of code smells. It consisted of an
observational study (Carneiro et al., 2010), where
developers identified a set of well-known code
smells on an open source system called Mobile
Media. Participants were asked to identify the
following code smells using SourceMiner: God
Class (GC) (Lanza and Marinescu, 2006), Divergent
Change (DC) (Fowler, 1999) and Feature Envy (FE)
(Lanza and Marinescu, 2006).
The following descriptions of the code smells
summarize the ones presented to the study
participants. Feature Envy (FE) occurs when a piece
of code seems more interested in a class other than
the one it actually is in (Fowler, 1999). This code
smell can be seen as a misplaced piece of concern
code, i.e., code which does not implement the main
concern of its class. Hence, the concern realized by
this misplaced code is probably located mainly in a
different class. God Class (GC) is characterized by
non-cohesiveness of behavior and the tendency of a
class to attract more and more features (Riel, 1996).
In a different perspective, we can look at GC as
classes that implement too many concerns and, so,
have too many responsibilities. It violates the idea
that a class should capture only one key abstraction,
and breaks the principle of separation of concerns.
Divergent Change (DC) occurs when one class
commonly changes in different ways for different
reasons (Fowler, 1999). Depending on the number of
ICEIS2013-15thInternationalConferenceonEnterpriseInformationSystems
32
responsibilities of a given class, it can suffer
unrelated changes. The fact that a class suffers many
kinds of changes can be associated with a symptom
of concern tangling. In other words, a class that
presents mixed concerns is likely to be changed for
different reasons.
In the context of the study, programmers were
asked to detect these code smells using SourceMiner
over the five versions of Mobile Media. They were
not allowed to access the source code neither
perform any search directly on it.
Two important results came out of it. First,
SourceMiner provided useful support to identify the
code smells. Second, based on the programmers
observed actions, we uncovered strategies for smell
detection supported by the use of SourceMiner.
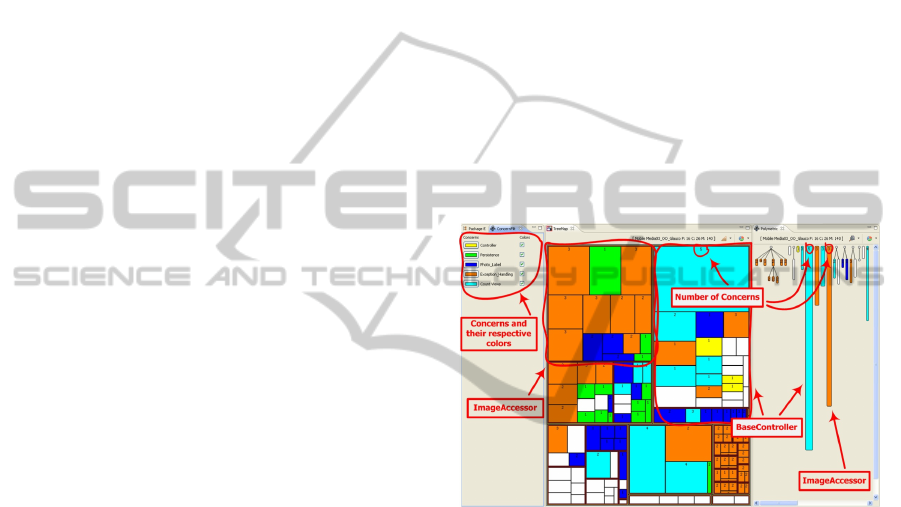
Participants that identified God Class made
synergistic use of the treemap and polymetric views
with concern decoration. Based on the log files, we
uncovered that participants first configured the
views to visually represent all concerns. They latter
used the package-class-method structure to spot the
classes and interfaces that were candidate outliers in
terms of size and the realization of many concerns.
Additionally, the polymetric view was also used to
identify outliers. An interesting result was that all
participants successfully identified BaseController
as a God Class of Mobile Media (MM) using this
strategy.
Figure 11 portrays a scenario of MM version 3
where BaseController and ImageAccessor clearly
stand out as God Class candidates. In Figure 4,
BaseController is the largest rectangle as indicated
by the arrows in Treemap and Polymetric View.
Moreover, it contains methods with different
concerns (colors). The same is true for the class
ImageAccessor, also indicated by arrows in the
figure.
In the case of the Feature Envy, the grid and the
spiral views were used to spot the code smell.
Considering that these views present classes and
interfaces in decreasing dependency order, the grid
view was used to first present classes with higher
dependency weight. In this view, the user selected
the BaseController class (Figure 11) and then double
clicked on it so that the spiral view could display its
dependency relationships. Using these two sets of
views, it is possible to easily spot BaseController as
Feature Envy candidate as presented in Figure 15 in
(Carneiro and Mendonça, 2013). This class stands
out due to its interest in other classes.
An uncovered strategy to identify Divergent
Change candidates was the combined use of the
Treemap and Polymetric views to spot classes that
may have been frequently changed for different
reasons.
A concern is tangled when it is mixed with other
concerns within a module which can easily be
observed in the treemaps. Moreover, if the
ascendants of a given class realize different
concerns, this class is change prone, a characteristic
that can be observed in the polymetric view. This is
again the case of the BaseController class in MM
version 3 as illustrated in Figure 15 in (Carneiro and
Mendonça , 2013).
The results that came out from this study present
initial evidences that SourceMiner can play an
important role in software characterization and, in
this particular case, helped to detect God Class,
Divergent Class and Feature Envy code smells.
The second study describes how SourceMiner
helped programmers to characterize the
Demoiselle framework (Demoiselle, 2013).
Figure 11: Identifying Outlier Classes.
This study was run with two members of the
Demoiselle core team at SERPRO. Initially, the
members of the Demoiselle core team, aided by a
SourceMiner expert, identified and mapped to the
source code a set of 13 concerns they considered
most relevant to the framework comprehension.
These concerns were mapped to the source code
using the ConcernMapper plug-in (Robillard and
Murphy, 2007). Afterwards, this information was
imported into SourceMiner. Part A of Figure 12
shows the concerns mapped during the study.
The second part of the second study consisted in
characterizing some concerns in terms of
modularity, including their level of scattering and
tangling. The Demoiselle core team had the goal to
change the dependency injection implementation of
the framework from AspectJ to the Java
Specification Recommendation JSR 299. The
concerns of interest for this activity were injection,
JDBC, JPA, Hibernate and Persistence Controller.
SourceMiner-AMulti-perspectiveSoftwareVisualizationEnvironment
33
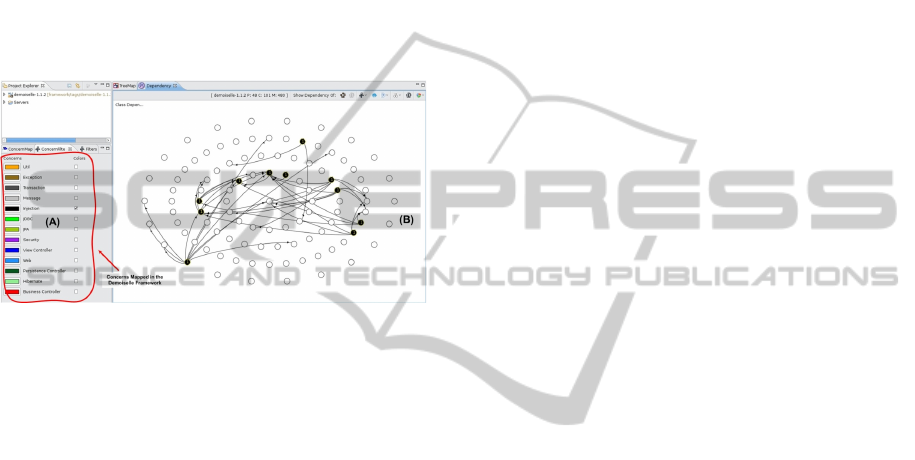
The following important results that came out of this
study: (i) the specialists could visually realize the
way concerns were related among themselves. As an
example, part B of Figure 12 shows classes that are
affected by the concern dependency injection using
the class dependency graph. Based on this view, the
specialists were able to identify classes that have any
relationship with the dependency injection concern
and which other concerns affected these same
classes; (ii) considering the results presented before,
the specialists were then able to plan and execute the
change of the dependency injection technology
without any major incident.
Figure 12: Identifying Outlier Classes.
The third study describes the use of SourceMiner to
support the characterization of Java web-based
systems developed in an organization. The
organization where the case study took place is a
Brazilian public company which has its own
development sites settled in different cities. The sites
develop software systems to their internal clients.
The central office provides a core Java web-based
system upon which all sites develops web
applications.
SourceMiner was used to analyze to which
extent the applications followed the original
structure of the core java web-based system and in
which cases it did modify or did not follow it. The
idea was to use SourceMiner to detect such
occurrences and to support the decision to develop
applications in the company using a framework such
as the one mentioned before.
Two versions of the core Java web-based system
and three applications developed using them were
analyzed. The applications 1 and 2 were developed
using the first version of the core java web-based
system, while application 3 used the second version.
We compared the applications using the three
perspectives from SourceMiner: package class
method, inheritance and coupling.
The analysis indicated that the approach adopted
in the organization is not suitable for code reuse and
contributes to degenerate the original architecture of
the core Java basic project. Figures 17 and 18 in
(Carneiro and Mendonça, 2013) show an example of
a utility class that increased from 701 lines of code
and 47 methods in the first version core system to
2089 lines of code and 160 methods in the derived
application. This increase is due to new utility
functionalities that were added by the application
development team. These utility functionalities
should have been requested from the core system
development team, or at the very least fed back to
them, by the application development team, in order
to make them available to other applications. In
interviews, we found that as the software systems
developed in different sites evolve, they tend to
include functionalities that originally were to be
provided by the basic project. That revealed a clear
flaw of this approach of application derivation.
8 RELATED WORKS
Software visualization has been extensively studied
as a means to support software engineers to build
mental models of software systems (Diehl, 2007);
(Storey et al., 1999); (Koschke, 2003). Software has
been visualized at various levels of detail, from the
module granularity seen in Rigi (Müller and
Klashinsky, 2008) to the individual lines of code
depicted in SeeSoft (Eick et al., 1992).
Many interesting and novel metaphors have been
proposed, but much debate and study are still needed
to validate them. Consider software visualization
techniques that use 3D representations as an
example. These techniques attempt to make more
efficient use of the available screen space and apply
intuitive metaphors to represent data (Teyseyre and
Campo, 2009). In spite of their positive points, they
also have negative points such as user adaptation
and cognition overload. The interaction with 3D
presentations and possibly the use of special devices
demand considerable adaptation efforts to these
technologies (Teyseyre and Campo, 2009). These
trade-off scenarios are common for any family of
visualization metaphors. For this reason, it is useful
that software visualization infrastructures provide
means of extensibility and resources to empirically
evaluate its use and effectiveness in software
engineering tasks, as we have implemented in
SourceMiner.
While there are many works on the use of novel
metaphors, there is not that many on the
combination of metaphors in multiple views
environments. Rigi was one of the pioneers in this
aspect (Müller and Klashinsky, 2008). It uses
ICEIS2013-15thInternationalConferenceonEnterpriseInformationSystems
34

multiple views in a reverse engineering
environment. It is extensible in the sense that new
visualization techniques can be included in the
environment through the use of Rigi Command
Language (RCL), which is based on the Tcl/Tk
scripting language. Several tools were implemented
on top of it, where SHriMP is probably the most
known (Storey and Müller, 1995). They all employ
multiform visualization using module relationships
as their main software analysis perspective.
Mature open standard IDEs, such as Eclipse, are
nowadays the substratum of many software
engineering tool implementations. However, the
number of software visualization tools that explore it
is still relatively small (Malnati, 2012); (Callendar,
2012). Among the main initiatives to move software
visualization closer to practitioners, by integrating
them in popular IDEs, one can mention Creole
(Callendar, 2012), an Eclipse plugin by Lintern et al.
and X-Ray (Malnati, 2012). Most of those were
developed as Eclipse’s plug-ins. Unfortunately they
cannot be classified as interactive and coordinated
multiple view environments, as they do not
completely explore environment integration, having
limited roundtrip, multiple view coordination and
interactive dynamic filtering resources.
As a concluding remark, it is important to
observe that the use of multiple, interactive, and
coordinated visualization resources are by no means
a novel idea in the information visualization field
(Baldonado et al., 2000); (Becks and Seeling, 2004);
(Roberts, 2000); (Roberts, 2007); (Pattison and
Phillips, 2001); (Ainsworth, 1999). They just have
not fully reached the software visualization field yet.
9 CONCLUSIONS
Most software visualization published work focuses
on introducing new metaphors to represent software
data, behaviour and evolution. This work highlights
that the study and implementation of extensible,
interactive, and coordinated multi-perspective
software visualization environments is an important
part of the software visualization research. Software
is very complex and multi-faceted. The literature has
already shown that no single view is able to depict
all software properties of a software system (Storey,
2006). One needs several views. Moreover, it is not
clear what the best metaphors are for presenting
many of these properties. One needs to test many
view combinations and those views need integration
and coordination.
We believe that only part of software
visualization promising benefits are being observed
in practice by the software development industry,
because we have not yet seen a tight integration of
software visualization tools with current popular
software development environments. This paper
described SourceMiner as an extensible multiple
view environment to enhance software
comprehension activities. In its development, we
considered guidelines proposed and already used in
the information visualization domain to bring forth
relevant information from the software source code
and associated information.
The model envisioned for SourceMiner is based
on the reference model by (Card et al., 1999) and
allows for consistent coordination among the views.
SourceMiner and the model upon which it was built
have the following characteristics: (i) views that
represent a specific software property are grouped in
perspectives to portray information of relevant
software properties such as coupling, inheritance and
the package-class-method structure; (ii) through the
use of multiple view and interaction mechanisms,
users to configure visual scenarios suitable to the
task at hand; (iii) the model was conceived
considering the IDE as its substratum; (iv) the
source code is the main data source for the
visualization environment; (v) other data sources are
used to enrich the views with information such as
concerns, and bug track information. We foresee the
use of several other types of data in SourceMiner as
way to broaden the range of software comprehension
activities supported by the multiple view interactive
environment; (vi) the environment is extensible, in
the sense that it is designed to support the inclusion
of new views. During its development, new views
were included following this principle.
The use of multiple views in SourceMiner better
handles the diversity of attributes, user profiles, and
levels of abstraction needed in software
visualization. It enables users to configure and
effectively combine views to bring out correlations
and or disparities that might otherwise remain
hidden in the code. The use of multiple views splits
complex data into more manageable chunks of
information, and this information can be further
filtered and explored through interaction with the
different visual scenarios.
Despite its focus on static software visualization,
we believe that the lessons learned in the design of
SourceMiner can be applied to other types of
software visualization, such as those that represent
dynamic software behavior or evolution (Diehl,
2007).
The environment was built for experimentation
SourceMiner-AMulti-perspectiveSoftwareVisualizationEnvironment
35

and we plan to continue to empirically studying it to
determine whether or not it actually decreases
cognitive load and increases performance on
specified software engineering tasks.
SourceMiner is being expanded to convey
software evolution attributes, churning and bug
analysis information. In addition, we are adapting it
to support collaborative software comprehension
activities in a distributed environment.
This paper described SourceMiner that is
available at www.sourceminer.org.
REFERENCES
Baldonado, M., Woodruff, A. Kuchinsky, A., 2000.
Guidelines for Using Multiple Views in Information
Visualization, In ACM AVI 2000, Italy, pp. 110-119.
Ball, T and Eick, S., 1996. Software visualization in the
large. Computer, 29(4):33–43, 1996.
Becks, A., Seeling, C., 2004 SWAPit: A Multiple Views
Paradigm for Exploring Associations of Texts and
Structured Data. In AVI'2004, Italy.
Callendar, C., 2012. Creole: Integrating Shrimp to the
Eclipse IDE. Available at http://www.
thechiselgroup.org/creole. Accessed in May.
Card, S. K., Mackinlay, J. and Shneiderman, B., 1999.
Readings in Information Visualization Using Vision to
Think. San Francisco, CA, Morgan Kaufmann.
Carneiro, G., Silva, M., Mara, L., Figueiredo, E.,
Sant'Anna, C., Garcia, A., and Mendonca, M., 2010.
Identifying Code Smells with Multiple Concern
Views. In proceedings of the 24th Brazilian
Symposium on Software Engineering (SBES).
Carneiro, G., Mendonça, M., 2013. SourceMiner.
Technical Report. Available at http://www.
sourceminer.org/screenshots.html.
Demoiselle, F., 2013. Demoiselle Framework. Available
at http: //demoiselle.sourceforge.net/.
Diehl, S., 2007. Software Visualization: Visualizing the
Structure, Behaviour, and Evolution of Software, 1st
Edition. Springer.
Eick, S.; Steffen, J.; Eric S., 1992. SeeSoft—a tool for
visualizing line oriented software statistics. IEEE
Transactions on Software Engineering, 18(11):957–
968, November.
Fowler, M., 1999. Refactoring: Improving the Design of
Existing Code. Addison Wesley.
Graham, M. And Kennedy, J., 2008. Multiform Views of
Multiple Trees. In CMV2008. London, UK.
Greenwood, P., Bartolomei, T., Figueiredo, E., Dosea, M.,
Garcia, A., Cacho, N., Sant’Anna, C., Soares, S.,
Borba, P., Kulesza, U., Rashid, A.., 2007. On the
Impact of Aspectual Decompositions on Design
Stability: An Empirical Study. ECOOP, Germany.
Heer, J., Shneiderman, B., 2012. Interactive Dynamics for
Visual Analysis. Communications of the ACM, 55(4),
pp. 45-54, April.
Koschke, R., 2003. Software Visualization in Software
maintenance, Reverse Engineering, and Re-
engineering: A research Survey. Journal of Software
Maintenance and Evolution: Research and Practice.
Lanza, M., Ducasse, S., 2003. Polymetric Views-A
Lightweight Visual Approach to Reverse Engineering,
IEEE Trans. Softw. Eng. 29, 9 (Sep.), 782-795.
Lanza, M.; Marinescu, R., 2006. Object-Oriented Metrics
in Practice - Using Software Metrics to Characterize,
Evaluate, and Improve the Design of Object-Oriented
Systems. Springer-Verlag.
Lehman, M and Belady, L., 1985. Program Evolution:
Processes of Software Change. London Academic
Press, 1985.
Lintern, R., Michaud, J., Storey, M-A and Wu, X., 2003.
Plugging-in Visualization: Experiences Integrating a
Visualization Tool with Eclipse. In Proceedings of
SoftVis ’
03, pages 47– 56. ACM Press.
Malnati, J., 2012. X-Ray Open Source Software
Visualization. Available at http://xray.inf.usi.ch/
xray.php. Accessed in May.
Müller, H. A. and Klashinsky K., 2008. Rigi: A system for
programming-in-the-large. In Proceedings of the 10th
International Conference on Software Engineering,
pp. 80–86. Singapore.
Riel, A., 1996. Object-Oriented Design Heuristics.
Addison-Wesley Professional, 1996.
Robillard, M. and Murphy, G., 2007. Representing
Concerns in Source Code. ACM Transactions on
Software Engineering and Methodology, 16(1):1-38,
February.
Shneirderman, B., 1992. Tree Visualization with Tree-
Maps: A 2-D Space-Filling Approach. ACM
Transactions on Graphics (ToG) 11, 1, 92–99.
Shneiderman, B. and Plaisant, C., 2009. Designing the
User Interface: Strategies for Effective Human-
Computer Interaction, 5th ed. Addison Wesley, March.
Storey, M.; Fracchia, F.and Muller, H., 1999. Cognitive
design elements to support the construction of a
mental model during software exploration. Journal of
Systems and Software, vol. 44, no. 3, pp. 171-185,
January.
Storey, M. D., Müller, H. A., 1995. Manipulating and
documenting software structures using SHriMP views,
in: 11th IEEE International Conference on Software
Maintenance, ICSM'95, pp. 275-284.
Storey, M., 2006. Theories, tools and research methods in
program comprehension: past, present and future.
Software Quality Journal, 14(3):187–208.
Teyseyre, A. R., and Campo, M. R., 2009. An Overview
of 3D Software Visualization. IEEE Transactions on
Visualization and Computer Graphics (TVCG) 15, 1,
87–105.
Ware, C., 2004. Information visualization: perception for
design. Morgan Kaufmann Publishers Inc., 2 edition,
2004.
Wu, J., and M.-A. Storey., 2000. A Multi-perspective
Software Visualization Environment. In Proceedings
of CASCON'2000, November, pp. 41-50.
ICEIS2013-15thInternationalConferenceonEnterpriseInformationSystems
36
