
Synaptic City
An Architectural Approach using an OSGI Infrastructure and GMaps API
to Build a City Simulator
Gustavo H. R. P. Tomas
1,2
, Welington M. da Silva
1,2
, Kiev Gama
1
, Vinicius C. Garcia
1
and Alexandre Alvaro
3
1
Informatics Center, Federal University of Pernambuco (UFPE), Recife, Brazil
2
Recife Center for Advanced Studies and Systems (C.E.S.A.R), Sorocaba, Brazil
3
Federal University of S˜ao Carlos (UFSCar), Campus Sorocaba, Sorocaba, Brazil
Keywords:
Smart Cities, Internet of Things, Architecture.
Abstract:
Big cities have noticeable problems resulting from poor management of urban services. Monitoring a city
gives some parameters to evaluate the performance of urban services, allowing to identify their flaws, and
elaborate strategic plains to correct them. Smart cities architectures are intended to propose Information and
Communication Technologies (ICTs) solutions to increase service efectiveness. Considering that to establish
a ICT infrastructure to support a smart city architecture is very expensive, once you have got the data and
you know what urban service you will attend to, you can use a city simulator to test how the architecture will
behave when facing the city’s problems. In this context we propose the Synaptic City architecture, together
with a city simulator, with which we modeled a Brazilian city, Recife, Pernambuco, in order to discuss its
main problems.
1 INTRODUCTION
The literature offers several definitions of the term
City, but the most accepted is described in Kuper (Ku-
per, 1995): a relatively large and permanent settle-
ment. Usually, a big city has a high population den-
sity, with its citizens living constant interaction with
industries, market and services. Under the operational
viewpoint, cities are based on a set of basic infrastruc-
ture: energy, water, transportation, infrastructure, in-
formation and communication, leisure, home, citizens
and public sanitation (Morvaj et al., 2011).
According to a UNESCO report released (Na-
tions, 2007), in 1950, 30% of the world population
lived in urban areas and in 2010 this percentage grew
to 50%. It is estimated that by 2050 the percentage of
people living in large urban centers will be 70%.
In the brazilian context, accordingto research con-
ducted by the Brazilian Institute of Geography and
Statistics (IBGE), published in the Diario Oficial (an
official journal where the brazilian government pub-
lishes its actions, decisions and resolutions about the
state) (de Geografia e Estat´ıstica (IBGE), 2012), in
July, 2012, Brazil reached 193,946,886 inhabitants,
representing an increase of approximately 1.65% in
comparison to 2010. With the growth of both the pop-
ulation and the complexity of the issues that concern
a city, there is a challenge in combining data from
different sources with Information and Communica-
tion Technologies (ICTs) in order to promote better
living conditions for citizens. This challenge, which
in other words is how to make a city become a Smart
City, has been widely discussed in the literature, from
projects and initiatives with different views on the
concept (Giffinger and Pichler-Milanovi´c, 2007) (Su
et al., 2011) (Kanter et al., 2009).
However, there is no consensus regarding the def-
inition of this concept, nor as to the most appropri-
ate environment to use it. In Kehua et. al. (Su et al.,
2011), IBM defines smart cities as the use of informa-
tion and communication technologies to capture, an-
alyze and integrate relevant information into the core
cities systems. At the same time, a smart city can
make smart decisions for different types of needs, in-
cluding daily aspects, environmental protection, pub-
lic safety, city services and industrial and commercial
activities.
In order to make better decisions that facilitate the
citizens life, it is needed to constantly monitor the var-
ious environments that compose a city. Each environ-
427
H. R. P. Tomas G., M. da Silva W., Gama K., C. Garcia V. and Alvaro A..
Synaptic City - An Architectural Approach using an OSGI Infrastructure and GMaps API to Build a City Simulator.
DOI: 10.5220/0004421204270434
In Proceedings of the 15th International Conference on Enterprise Information Systems (ICEIS-2013), pages 427-434
ISBN: 978-989-8565-60-0
Copyright
c
2013 SCITEPRESS (Science and Technology Publications, Lda.)

ment must be mapped with different types of sensors,
such as temperature and presence (Hern´andez-Mu˜noz
et al., 2011). The greater the variability of sensors,
better the fidelity level of this mapping in relation
to the real environment. This variability should be
treated in relation to frequency of data sent, data type
and variability of communication protocols (Filipponi
et al., 2010) (Hern´andez-Mu˜noz et al., 2011) (Lee
et al., 2011) (Zygiaris, 2012) (PlanIT, 2012) (Black-
stock et al., 2010).
Thus, it is important to developa central layer, that
is able to attend several devices with different tech-
nologies. Additionally, this layer should be reliable
to handle multiple simultaneous requests for informa-
tion generated from the combination of several data
sources (Filipponi et al., 2010) (Hern´andez-Mu˜noz
et al., 2011).
Nevertheless, for testing and validating this cen-
tral layer it is necessary to use several sensors. These
sensors are difficult to be implemented in real envi-
ronments, mainly due to high cost and some public
policies (Sanchez et al., 2011). Therefore, the need
to simulate the mapping of a real environment arises,
with several different types of sensors sending infor-
mation for an indefinite time. This simulator must be
flexible enough to model any city, independently of
cultural and demographic characteristics.
In this context, this work proposes a smart city ar-
chitecture and validates it using a data simulator. Sec-
tion 2 discusses related work in a minimally validated
stage, found in literature. Section 3 describes the
Synaptic City Architecture proposal divided in three
layers. Each layer is presented and all technologies
used for implementation are described. Section 4
presents the case study, describing the target city and
all related scenarios. Finally, Section 6 concludes
discussing results from the architecture and data sim-
ulator.
2 RELATED WORK
In order to have an updated snapshot of what is hap-
pening in an urban environment it is necessary to
sense, keep track, of whatever is happening in its sur-
roundings. Sensors allow computer systems to inter-
pret a real world situation, based on raw data, that
must to be related to a whole context to generate use-
ful information.
Monitoring a city gives some parameters to eval-
uate the performance of urban services, allowing to
identify their flaws, and elaborate strategic plans to
correct them. Strictly speaking, sensors are usually
capable of measuring physical quantities and convert
it into a digital signal, that by its turn will become
the raw data aforementioned. Adding some compu-
tational capabilities to the practical sensor concept,
i.e., “smartening” a sensor, makes it able to act as a
distributed, contextual and reconfigurable node in a
highly dynamic, distributed and heterogeneous envi-
ronment, collecting data, generating information, al-
lowing implementation and support to pervasive com-
puting environments (Lei, 2003)(Tan, 2010).
When we expand this behavior to a context where
all objects are connected and acting as data sources -
as sensors - applying to some common goal, we reach
the Internet of Things (IoT) concept(Atzori et al.,
2010). According to Tan and Wang (Tan, 2010), the
Internet of Things is responsible for linking the phys-
ical and the information world.
Nowadays, as there are emerged projects in which
“crowd sensing” is highly utilized, providing data
from real world devices to developers create some
value proposition using them.
One of these projects is described in (Cosm,
2012), where people are invited to connect their de-
vices to the COSM platform and, developers and
companies, besides connecting devices can integrate
apps to securely store and exchange data. It offers
real-time and scalable controlling, monitoring and
analysis of the available data.
Additionally, the Magic Broker platform (Erbad
et al., 2008) was adapted to smart cities, aiming
to provide a consistent model and interfaces stan-
dardization for building Internet of Things applica-
tions. It addresses an architecture model driven by
citizens engagement, to build and deploy application
suited to their needs, exploiting the use of smart sen-
sors, sensor web technologies and IoT technologies,
such as Radio Frequency Identification (RFID). The
project’s target is to compose a middleware, using
OSGi bundles (i.e., software components) (Alliance,
2007), capable of supporting a wide range of devices
and programming models to support wide area dy-
namic composition of devices and services.
The (Tecnic, 2012) presents a web centric sensing
platform, called WoTkit, that facilitates the connection
between real-world objects and the Internet, engaging
users as “participatory sensors”, allowing developers
to build “revolutionary services”, as they say. The fo-
cus is to help people to reduce costs through com-
pelling services, enabling the development of mobile
applications that sense and control the real-world.
Demand for smart cities that consolidate and de-
liver contextualized information about services of
cities is latent and becomes stronger as cities grow
and technologies emerge. Initiatives worth mention-
ing, such as the NYC BigApps (City, 2012) and
ICEIS2013-15thInternationalConferenceonEnterpriseInformationSystems
428
RioApps (Prefeitura do Rio de Janeiro, 2012) con-
tests, where urban data is made available through
software interfaces so people are encouraged and re-
warded for creating outstanding applications using it,
thus creating some value proposition to its citizens,
improving urban daily life, resource usage, and qual-
ity of urban services.
Finally, our work aims to join the flexibility in
coupling new devices to the architecture - as COSM
does - but, instead of letting it be associated to user-
defined subjects, we predefined some concerns cov-
ered by Synaptic City, standardizing the data that will
be made available. Both flexibility and standardiza-
tion will be achieved through a middleware capable
of handling data from different devices, maintaining it
uniformly. All these data will be provided to develop-
ers so they can build and compose useful services and
applications in daily life of citizens, exploring new
possibilities for urban services management based on
crowdsourcing.
3 SYNAPTIC SMART CITY
ARCHITECTURE PROPOSAL
One of the biggest concerns when creating a smart
city software architecture is sharing responsibilities
among the entities, keeping it consistent, guarantee-
ing extensibility and flexibility to the supported ser-
vices. Thus, we divide the Synaptic Smart City ar-
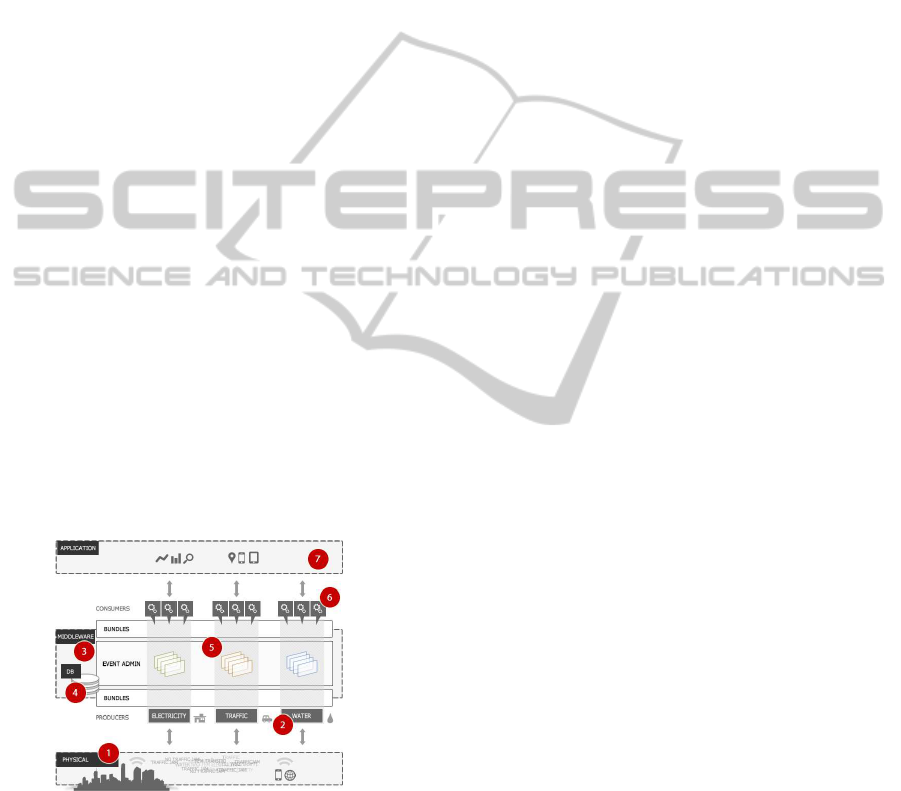
chitecture in three layers, as shown in 1: physical,
middleware and application.
Figure 1: Synaptic City Architecture.
The physical layer (1) is responsible for hosting
the sensors. In our test bed we had no proper phys-
ical sensors to use, so we decided to simulate them
using a Mobile and a Web application. The former
took the form of an Android traffic application con-
sisted in a single button on the screen, which the user
should press in case of facing a traffic jam; the latter
consisted of a Web application that comprised a City
Simulator. This layer has as responsibilities capturing
raw data coming from different sensors - concerning
to traffic or water/electricity consumption - and for-
warding it to its specific producer bundle (2) at the
middleware layer.
When the data reaches the middleware layer (3) it
is saved in a database (4) with the purpose of main-
taining historical data about the addressed concerns.
Once saved, it is published in a message-oriented
middleware under a specific message topic (5) from
which the application - through the consumer bundles
(6) - can retrieve the incoming data. As all the con-
cerned topics are in this layer, contextualized infor-
mation can be generated, or different concerns can be
related, and a new topic with a new type of informa-
tion will be available.
In the application layer (7), the data can be ac-
quired through a subscription to a concerned topic in
the message-oriented middleware. The interesting as-
pect of this layer is that an application can subscribe
to different concerns and create its own contextual
knowledge on the available data, increasing the rich-
ness of the information provided to the user.
For capturing useful information in the smart
cities contexts it is necessary to involve citizens.
Therefore, it is important to choose technologies that
can encourage people to provide (layer 1) and con-
sume (layer 7) data, without which this interaction is
unpleasant. Thus, due to the increasing number of
people with smartphones (Hall, 2012), we decided to
create two applications for this type of device. The
smartphone operating system chosen was Android,
because of the facility in deploying new applications
and the market share it holds. Our applications were
built on the Froyo version (2.2), but they are compat-
ible with newer Android versions.
By using the traffic application, one can identify
through the map the traffic bottleneck and the amount
of cars in every city area. The traffic application feeds
the base providing location reports every 20 minutes.
The second application is responsible for showing in-
formation about the sustainability level of a building,
according to its reported water and energy consump-
tion. Furthermore, some scenarios are designed to
simulate a situation in which several people will be
using these applications. These scenarios will be dis-
cussed throughout this work.
We deployed the discussed layers in the Ama-
zon Web Services (AWS) infrastructure, that offers
a highly reliable, elastic, scalable and low cost solu-
tion (Services, 2012). There was no special reason for
that choice, we only wanted available infrastructure,
able to give support to as much requests as possible,
as well as a high number of connected sensors send-
SynapticCity-AnArchitecturalApproachusinganOSGIInfrastructureandGMapsAPItoBuildaCitySimulator
429

ing data constantly; in case of a increasing in one of
these, it would scale automatically, without having to
rethink about hardware or deployment issues.
3.1 Middleware: OSGI
The OSGi platform was chosen for developing the
Middleware layer (2). According to OSGi refer-
ence (Alliance, 2007), “The OSGi technology is a
set of specifications that define a dynamic compo-
nent system for Java. These specifications enable a
development model where applications are (dynam-
ically) composed of many different (reusable) com-
ponents”. OSGi reduces complexity by providing a
modular architecture for large-scale distributed sys-
tem, inhering some important advantages for smart
cities architecture scenario, such as modularity, hot-
deployment, scalability, and security. The OSGi com-
ponent system was used to build some widely used
projects like Eclipse, GlassFish, IBM Websphere, Or-
acle/BEA Weblogic, Jonas, JBoss, among other.
The OSGi advantages match with Synaptic City
goals, mainly modularity for build new services.
Thus, for implementation purposes we chose Equinox
Bundles (Foundation, 2012) component, due to
familirity with Eclipse enviroment and integration
with Jetty Web Server.
For validation purposes, three services were cre-
ated: traffic, water and energy consumption. For
each service, a producer and a consumer bundle
were built. The producer bundle is responsible for
putting information about services on OSGi. More-
over, the consumer bundle is responsible for getting
all information and making it available via REST
interface. In Blackstock et al. (Blackstock et al.,
2010) they proposed a platform called Magic Bro-
ker (MB2), which provides some basic abstractions,
such as events, state, and content management ser-
vices. Based on that, the producer-consumer commu-
nication is done via OSGi’s Event Admin component,
an event-oriented communication architecture based
on queue and topics, resembling a message-oriented
middleware.
In the traffic service, the producer bundle puts in-
formation needed for traffic reports, such as latitude,
longitude and report time. From this information, the
consumer joins several reports and calculates a range
of intense traffic around 200 meters. So, consumer
makes available a block list of areas with traffic is-
sues in the last 20 minutes.
In the case of water and energy services, the same
informations was used. The producer bundle con-
tinuously sends the following information: the wa-
ter/energy consumption, entity type and entity posi-
tion (latitude and longitude), during an undefined pe-
riod. The entity type must be residential, commercial
or industrial. The consumer bundle makes available
an average consumption on the last week, as well as
a classification based on the population average con-
sumption.
Table 1 summarizes the information to all bundles
services interface. If more services need to be added,
it is necessary just to create a producer and consumer
bundles and plug them in architecture, thanks to OSGi
hot deploy capability.
3.2 Physical: City Data Simulator
The simulator plays an important role in the Synaptic
City architecture. Since we did not have any physical
sensors available, we needed to create something to
serve as data producer on the Physical layer (1), that
could be attached to the architecture and act just like
any other sensor was supposed to. That is why we
implemented the City Simulator.
To make the simulation closer to the real world
we created entities to represent some urban elements:
residences, buildings, data center, cars, city hall, ho-
tel, football stadium. Each one, except for cars,
is identified uniquely from its geographical location.
With this entities set it is possible to simulate several
urban scenarios, with a geolocalized distribution rep-
resented with GMaps API. To validate the proposed
architecture concept, we built some specific scenarios
in Recife, Pernambuco, Brazil.
Furthermore, one can simulate any urban environ-
ment simply placing the map on the targeted city, se-
lecting an entity and putting it in the most appropri-
ate place. There is no restriction on the number and
types of entities that can be added. Once this is done,
it is possible to send the report of each entity man-
ually or select the auto city simulator mode. In this
mode, each entity periodically sends their informa-
tion: in the case of cars, traffic reports are sent; for
other entities, each report with water and energy con-
sumption are sent.
For entities that provide water and energy infor-
mation, the report values vary according to their con-
sumption rate, based on real world values. For ex-
ample, over a month, a data center should consume
more water and energy than a city hall, mainly be-
cause the data center should be in operation all the
time with a high and almost no variable consumption,
while on weekends the city hall has a decrease on its
consumption values. Therefore, consumption reports
of the data center must have greater values than the
ones measured in a city hall.
To utilize the data generated by the entities, we
ICEIS2013-15thInternationalConferenceonEnterpriseInformationSystems
430

Table 1: Information vs. bundles summary.
Service Producer Consumer
latitude Block List:
Traffic longitude -block latitude
report time -block longitude
-amount of reports
latitude latitude
Water longitude longitude
entity consumption consumption rate
entity type consumption mean
latitude latitude
Energy longitude longitude
entity consumption consumption rate
entity type consumption mean
created some classification reports in which, accord-
ing to the measured consumption, each entity is said
to be sustainable or not.
4 CASE STUDY
The architecture efficiency is measured according to
its behavior in real world scenarios. Specifically in
smart cities architectures, the validation in real en-
vironments is difficult because often one needs in-
frastructure such as sensors network throughout the
city and the availability of Internet connection. More-
over, government issues usually hamper this valida-
tion, mainly in aspects related to public areas.
From the simulator viewpoint, the efficacy is mea-
sured according to the similarity level between the
simulated and the real environment. Therefore, this
section aims to address the case study conducted to
validate the Synaptic City architecture and the City
Simulator. Starting with a contextualization of the
city that the simulator aims to represent, we will de-
scribe the studied scenarios and how the needed in-
formation was captured and used.
4.1 Target City
The city chosen for the experiment was Re-
cife, capital of Pernambuco, Brazil. According
to statistics from Brazilian Institute of Geog-
raphy and Statistics (IBGE) (de Geografia e
Estat´ıstica (IBGE), 2012), the metropolis con-
tains approximately 1.555.039 inhabitants,
which places as the 8th most populated city in
Brazil. From a sociological viewpoint this cluster
of people implies in the occurrence of several
problems that affect directly existing services, such
as transportation, security, water and electricity
supply/consumption, sanitation and natural resources
utilization; from a technological viewpoint, this
implies in several opportunities to turn problems into
solutions to make life pleasurable living, through
improvements and new ways for providing urban
services.
Moreover, Recife is one of the host cities of the
FIFA Confederations Cup 2013 and the FIFA World
Cup 2014 with urban mobility demands. Focusing on
traffic, the Recife city has about 600,000 registered
vehicles. The city’s road network is not ready for that
amount of vehicles due to its narrow streets and few
roadways as optional routes. On energy and water
issues, citizens have no system that quantify the level
of their consumption or even measure the quality of
service in real time.
In the following subsection, we will analyze some
scenarios chosen to represent these problems.
4.2 Scenarios
By using City Data Simulator it is possible simu-
lates several urban scenarios, combining different en-
tities. To validate the proposed architecture concept,
we built some specific scenarios that mimic Recife’s
reality. Three scenarios were chosen to represent crit-
ical situations that occur frequently.
(a) Recife citizens are passionate about soccer and
fanatics by the three top teams: Nautico, Sport
and Santa Cruz. When there is a soccer game be-
tween these three great teams, several fans go to
stadium to root and encourage their teams. Thus,
the first scenario aims to illustrate this event, in
which a soccer match between Sport and Nautico
is held at Ilha do Retiro stadium. The avenues
that give access to the stadium are narrow and are
not prepared to meet that amount of cars. Fortu-
nately, the stadium is located in a residential area
and, from some buildings around the stadium, it
is possible to watch the entire game.
SynapticCity-AnArchitecturalApproachusinganOSGIInfrastructureandGMapsAPItoBuildaCitySimulator
431

(b) For being a coastal city, some periods of the year
it rains a lot in the city of Recife. In turn, the
main avenues that give access to the peripheral
region does not have an effective drainage sys-
tem, causing inconvenient traffic jams. There-
fore, the second scenario aims to illustrate this sit-
uation, specifically highlighting Imbiribeira Av-
enue, which crosses the city and gives access
to the International Airport of Recife/Guararapes
and a major neighboring city, Jaboat˜ao dos
Guararapes.
(c) Some major events are held in Recife stadiums
thanks to public policies to encourage art and cul-
ture. As an example, we can cite international
artists concerts. The last scenario describes the
situation in which a large event is held at the Jos´e
Rego Maciel Stadium (known as Arruda) belong-
ing to Santa Cruz Futebol Clube. Currently Ar-
ruda has capacity for 60,044 people, and there
are several access routes to the stadium, some of
them are narrow, with low flow of cars, and others
wider, with a more intense flow.
5 RESULTS
Once the architecture design is completed and the
producers and consumers bundles, as well as the
simulator, are all created, the resulting information
must be analyzed. Specifically in the Recife context,
these results are interesting from a practical stand-
point. Their analysys will be separated in two aspects:
Synaptic City Architecture and data city simulator.
5.1 Synaptic City Architecture Results
Starting with the architecture results, the usage of the
OSGi framework made the architecture well modu-
larized and flexible, in terms of the amount of ser-
vices provided. Additionally, each service can receive
data from different sensors, as long as a new bun-
dle producer is created and all the data are sent us-
ing the Event Admin topic concept. The architecture
serves multiple client applications via JSON content
provided by bundles consumers, as implemented in
the web and as smartphone applications.
This applications variability is an important factor,
because it increases the likelihood that citizens will be
informed as soon as possible about any event in the
city. By receiving this information, citizens can make
the best decisions aiming their quality of life, taking
advantage of improved urban services. In this first
experiment, the types of applications are restricted to
those only with Internet access.
Furthermore, the service composition is a require-
ment easily answered by that architecture organiza-
tion. To compose various services, you just have
to capture the data of the respective topics, combine
them appropriately and make them available via web
interface for any other application.
5.2 Data City Simulator Results
As the simulator, we highlight the possibility of cre-
ating different types of sensors. Considering that to
establish an ICT infrastructure to support a smart city
architecture is very expensive, once you have got the
data and you know what urban service you will attend
to, you can use a city simulator to test how the archi-
tecture will behave when facing the city you are try-
ing to represent. Besides, different cities have differ-
ent problems, and using a simulator makes it easy to
model how these problems affect the performance of
urban services and how they are related to each other.
By knowing the input data and the output information,
a simulator allows to create different scenarios to test
the architecture effectiveness.
In the context of this work we should analyze the
results obtained with the simulated scenarios of Re-
cife. These scenarios represent everyday situations
and should be analyzed, mainly, from the viewpoint
of citizens welfare. Figure 2 illustrates the three sce-
narios. In all of them, the circles around each entity
represents that, at the moment, consumption/traffic
reports are being sent .
The scenario shown in Figure 2(a) represents the
classic soccer match between Sport and Nautico. An-
alyzing this scenario, we can notice that the football
stadium is sending reports constantly. Likewise, the
buildings around the stadium are consuming enough
water and energy. This probably means that people
are watching the game at home increasing energycon-
sumption. In turn, the traffic reports (represented by
cars) are concentrated in the main access to the sta-
dium, causing a heavy traffic jam. Figure 2(a) illus-
trates the information sent by the buildings.
Regarding the scenario illustrated in Figure 2(b),
a traffic jam can be noticed at the Imbiribeira Avenue,
which gives access to important points in the city,
such as the International Airport. Simultaneously, we
notice an increase in both water and electricity con-
sumption for buildings around, possibly due the mea-
sures being taken to mitigate the problems caused by
traffic bottlenecks and flooding. Also in Figure 2(b)
there is an illustration of the information sent by each
traffic report.
Finally, the scenario shown in Figure 2(c), we can
see that the main access to the stadium are congested,
ICEIS2013-15thInternationalConferenceonEnterpriseInformationSystems
432
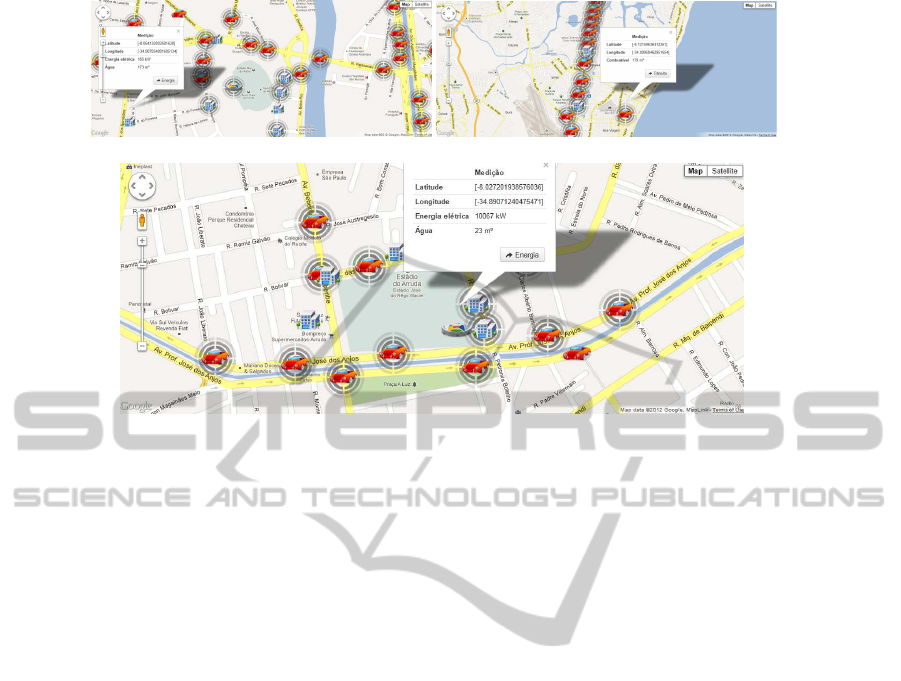
(a) Soccer Game (b) Imbiribeira Avenue
(c) Artists Concert
Figure 2: Results Three Recife scenarios.
but there are some alternatives roads that can mini-
mize the time spent to get to the event. Moreover,
we can observe changes of consumption in buildings
around the stadium, possibly because of the opportu-
nities created by the event, as parking lots and com-
merce. Finally, one can observe a bullet with the in-
formation that is sent from a stadium entity.
With this information acquired from the three sce-
narios, citizens can take some decisions to improve
their quality of life, optimize their time and reduce the
stress. Related to the first scenario 2(a) it is possible
to choose going to the stadium before the scheduled
time and pick the best path in real time. Consider-
ing the second scenario 2(b), it is possible to devi-
ate routes to avoid flood points. The third scenario
2(c) can be mitigated choosing among different ac-
cess routes to the international concert.
Besides this vision from the viewpoint of the cit-
izen, one can analyze this information from the per-
spective of business opportunities. For example, in
scenario 2(a) traders could exploit the brand of the
teams in points with high concentration of people, and
knowing the stadium and buildings consumption en-
ergy suppliers could work on optimizations, extract-
ing consumption patterns from the scenarios, allow-
ing to model and forecast some chaotic events, such
as power outages or even consumption peaks for spe-
cific events, and determine the appropriate correc-
tive/preventive actions.
6 CONCLUSIONS
Throughout this work, some aspects that an smart city
architecture must meet were soon discussed. As a
case study, we described the Synaptic City architec-
ture. The Synaptic City constitutes a project with a
proposal to build a modular, scalable and robust ar-
chitecture, coupled with a wide simulator.
All results of this work were obtained from
the use data simulator, in which no empir-
ical experiment was conducted. Neverthe-
less, in this validation context, the architecture
shown to be flexible, especially regarding the ser-
vices composition aspect. This characteristic is very
important because in a smart city context is important
to combine information from different services.
At the end of this paper, we concluded that the ar-
chitecture definition cannot be focused only on tech-
nological issues, but on issues related to daily lives
of citizens and ways to make a participative action
become a part of an effective solution to urban prob-
lems.
For future work, we will develop new topics in the
Synaptic architecture with contextualized services, as
well as model some local scenarios, such as com-
panies, with sensors monitoring a more restricted
scope, allowing to manage services in smaller do-
mains. These federated solutions will stablish a new
concept of smartness in a city, built from a collection
of well managed subdomains, enabling more focused
approaches to solve local problems based on a holis-
SynapticCity-AnArchitecturalApproachusinganOSGIInfrastructureandGMapsAPItoBuildaCitySimulator
433

tic view - in which each federation has its own topic
from which other ones can get information - aiming
to set up a high quality urban environment with very
pleased citizens.
ACKNOWLEDGEMENTS
This work was partially supported by the National In-
stitute of Science and Technology for Software En-
gineering (INES)
1
, FAPESP
2
, grant 2012/10157-1,
FACEPE
3
, grants 573964/2008-4, APQ-1037-1.03/
08 and CESAR
4
.
REFERENCES
Alliance, O. (2007). OSGi Service Platform Release 4.
Atzori, L., Iera, A., and Morabito, G. (’2010’). The internet
of things: A survey. Comput. Netw., 54(15):2787–
2805.
Blackstock, M., Kaviani, N., Lea, R., and Friday, A. (2010).
Magic broker 2: An open and extensible platform for
the internet o@f things. In Internet of Things (IOT),
2010, pages 1–8.
City, N. Y. (2012). Nyc bigapps. http://bit.ly/
U9e3C0. ”[Online] Available: 18-September-2012”.
Cosm (2012). Cosm, connect to your world. http://bit.ly/
QVN9uu. ”[Online] Available: 30-August-2012”.
de Geografia e Estat´ıstica (IBGE), I. B. (2012). Estimativa
populacional. http://bit.ly/QbmASi. ”[Online] Avail-
able: 31-August-2012”.
Erbad, A., Blackstock, M., Friday, A., Lea, R., and Al-
Muhtadi, J. (2008). Magic broker: A middleware
toolkit for interactive public displays. In 6th Annual
IEEE International Conference on Pervasive Comput-
ing and Communications, PERCOM ’08, pages 509–
514, Washington, DC, USA. IEEE Computer Society.
Filipponi, L., Vitaletti, A., Landi, G., Memeo, V., Laura,
G., and Pucci, P. (2010). Smart city: An event driven
architecture for monitoring public spaces with het-
erogeneous sensors. In 4th International Conference
on Sensor Technologies and Applications, pages 281–
286, Washington, DC, USA. IEEE Computer Society.
Foundation, E. (2012). Equinox bundles. http://bit.ly/
OdJ9Bw. ”[Online] Available: 31-August-2012”.
Giffinger, R. and Pichler-Milanovi´c, N. (2007). Smart
Cities: Ranking of European Medium-sized Cities.
Centre of Regional Science, Vienna University of
Technology.
Hall, N. (2012). Are there really more mobile phones than
toothbrushes? http://bit.ly/RInZMi. ”[Online] Avail-
able: 1-August-2012”.
1
http://www.ines.org.br
2
http://www.fapesp.br
3
http://www.facepe.br
4
http://www.cesar.org.br
Hern´andez-Mu˜noz, J. M., Vercher, J. B., Mu˜noz, L.,
Galache, J. A., Presser, M., G´omez, L. A. H., and Pet-
tersson, J. (2011). Smart cities at the forefront of the
future internet. In Domingue, J., Galis, A., Gavras,
A., Zahariadis, T., and Lambert, D., editors, The fu-
ture internet, pages 447–462. Springer-Verlag, Berlin,
Heidelberg.
Kanter, R., Litow, S., and School, H. B. (2009). Informed
and Interconnected: A Manifesto for Smarter Cities.
Harvard Business School.
Kuper, A. (1995). The Social Science Encyclopedia. Rout-
ledge world reference series. Taylor & Francis.
Lee, J., Baik, S., and Choonhwa Lee, C. (2011). Building
an integrated service management platform for ubiq-
uitous cities. Computer, 44:56–63.
Lei, W. (2003). A software platform for smart sensors. In-
ternational Conference on Intelligent Transportation
Systems, 2:1116–1121.
Morvaj, B., Lugaric, L., and Krajcar, S. (2011). Demon-
strating smart buildings and smart grid features in a
smart energy city. In Energetics (IYCE), 3rd Interna-
tional Youth Conference, pages 1–8. IEEE.
Nations, U. (2007). World population prospects: The 2006
revision and world urbanization prospects. Technical
report, United Nations, New York.
PlanIT, L. (2012). Cities in the cloud, a living planit intro-
duction to future city technologies. In Living PlanIT.
Living PlanIT.
Prefeitura do Rio de Janeiro (2012). Rioapps. http://
rioapps.com.br/. ”[Online] Available: 18-September-
2012”.
Sanchez, L., Galache, J., Gutierrez, V., Hernandez, J.,
Bernat, J., Gluhak, A., and Garcia, T. (2011). Smart-
santander: The meeting point between future inter-
net research and experimentation and the smart cities.
In Future Network & Mobile Summit (FutureNetw),
pages 1–8. IEEE.
Services, A. W. (2012). What is aws? http://bit.ly/Nz1zkp.
”[Online] Available: 15-August-2012”.
Su, K., Li, J., and Fu, H. (2011). Smart city and the ap-
plications. In International Conference Electronics,
Communications and Control (ICECC), pages 1028–
1031.
Tan, L. (2010). Future internet: The Internet of Things.
In 3rd International Conference on Advanced Com-
puter Theory and Engineering(ICACTE), pages V5–
376–V5–380. IEEE.
Tecnic, S. (2012). Sense tecnic. http://bit.ly/TPwwlq. ”[On-
line] Available: 30-August-2012”.
Zygiaris, S. (2012). Smart city reference model: Assisting
planners to conceptualize the building of smart city in-
novation ecosystems. Journal of the Knowledge Econ-
omy, pages 1–15.
ICEIS2013-15thInternationalConferenceonEnterpriseInformationSystems
434
