
Numerical Model for the Prediction of Final Mechanical Properties
of EPDM Vulcanized with Peroxides
Part I: Basis of the Numerical Model and Experimental Campaign
Gabriele Milani
1
and Federico Milani
2
1
Politecnico di Milano, Piazza Leonardo da Vinci 32, 20133 Milan, Italy
2
Chem. Co Consultant, Via J.F. Kennedy 2, 45030 Occhiobello (RO), Italy
Keywords: Kinetic Numerical Model, EPDM Rubber, Peroxides, Comparison with Experimental Data.
Abstract: In the paper, a simple but effective mathematical model having kinetic base, to predict the vulcanization
degree of rubber vulcanized with peroxides, is presented. The approach takes contemporarily into
consideration, albeit within a simplified scheme, the actual reactions occurring during peroxidic curing,
namely initiation, H-abstraction, combination and addition, and supersedes the simplified approach used in
practice, which assumes for peroxidic curing a single first order reaction. After a suitable re-arrangement of
the first order system of differential equations obtained from the actual kinetic system adopted, a single
second order non-linear differential equation is obtained and numerically solved by means of a Runge-Kutta
approach. Kinetic parameters to set are evaluated by means of a standard least squares procedure where
target data are represented by experimental values available, i.e. normalized rheometer curves. In order to
assess numerical results, a wide experimental campaign is conducted, varying curing agents, vulcanization
temperatures and concentration of the peroxides. Both rheometer curves to compare with those provided by
the numerical model and stretch-strain curves of the vulcanized samples are obtained, to have a precise
insight into the most suitable parameters to use during curing.
1 INTRODUCTION
The curing process of medium and high voltage
electric cables with EPM/EPDM rubber having low
molecular weight (Mooney viscosity ML), ethylene
high content and low-medium amount of ter-
monomer (generally 1,4-Hesadiene, ENB, DCPD
and VNB) is made by peroxides.
In this paper, an industrial formulation with a ter-
polymer and VNB as third monomer (Vistalon,
1703) exhibiting a large molecular weights
distribution, as shown in Figure 1, good
processability suitable for the extrusion of medium-
high voltage electric cables is considered. The
peculiar characteristic of the industrial product
analyzed is that unvulcanized rubber is produced in
pellettes, allowing absorption of the peroxide on the
surface of each single element, satisfactory stocking
stability and the possibility to vulcanize directly the
compound by other factories.
On the base of such considerations and with the
aim to determine the optimal reticulation conditions
of real thick items, it appears therefore interesting to
propose a comprehensive numerical model based on
the actual decomposition reactions occurring in
reality, as close as possible to that observed
experimentally, to predict with simple computer
simulations the optimal curing time and temperature,
Milani and Milani (2008, 2012a, 2013) and the most
suitable peroxide to utilize in order to maximize the
final crosslinking density of an item with given
geometry, Milani and Milani (2010).
This work is part of a wider
experimental/numerical program conducted by the
authors on the same rubber recipe constituted by an
EPDM elastomer, changing both peroxides used and
controlled vulcanization temperature. In particular,
test were conducted in a range temperature varying
between 160 and 200°C, with a 20°C step, using
different peroxides, changing their concentration and
considering also a mixture of three of them. A huge
amount of rheometric cure curves were obtained
(one for each temperature, peroxide used and
concentration) and quantitatively compared one each
other, to have an insight into the most effective
temperature and peroxide to use during such kind of
58
Milani G. and Milani F..
Numerical Model for the Prediction of Final Mechanical Properties of EPDM Vulcanized with Peroxides - Part I: Basis of the Numerical Model and
Experimental Campaign.
DOI: 10.5220/0004423700580065
In Proceedings of the 3rd International Conference on Simulation and Modeling Methodologies, Technologies and Applications (SIMULTECH-2013),
pages 58-65
ISBN: 978-989-8565-69-3
Copyright
c
2013 SCITEPRESS (Science and Technology Publications, Lda.)
vulcanization, in terms of both vulcanization
velocity and maximum torque reached.
In order to interpret theoretically experimental
results obtained, a peroxide decomposition kinetic
model is presented, considering the complex set of
reactions that characterize peroxide crosslinking,
namely homolytic cleavage of peroxide, hydrogen
abstraction, polymer radicals formation, polymer
radicals coupling, cross-link formation and polymer
scission.
Starting from the above -most probable- kinetic
scheme, a system of non-linear differential equations
with few variables is obtained and solved
numerically, after suitable variable substitutions, by
means of a Runge-Kutta algorithm. Crosslinking
density is thus evaluated numerically and compared
to rheometer experimental curve, which may provide
a reliable indication of the average cured rubber
crosslinking, once suitably scaled to unitary values.
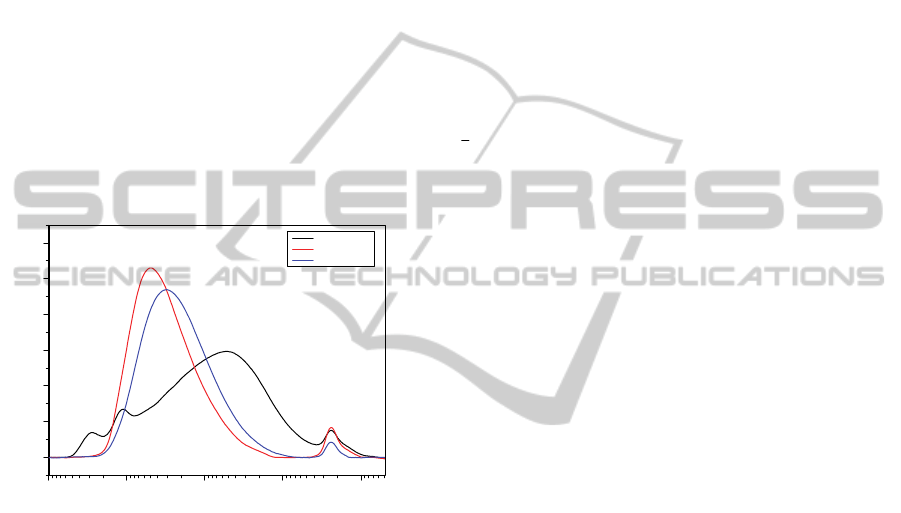
Figure 1: Molecular weight distribution of Vistalon 1703
compared with other two distributions of common
industrial products.
By means of the numerical approach proposed,
an estimation of the kinetic constants per single
reaction, once known kinetic decomposition laws,
may be evaluated and hence the activity of each
peroxide may be estimated using a few experimental
data at only two different temperatures.
By means of the additional experimental and
numerical evaluation of the stress-strain curves of
the vulcanized samples, it is also possible to
establish a correlation between tensile strength and
maximum torque obtained with the rheometer test,
again useful for an optimization of the production
processes.
It has to be finally considered that, for thick
items exceeding 5 mm, a numerical algorithm is
already at disposal to determine the most suitable
temperatures and exposition times to be used in the
industrial production, in order to guarantee that the
core results not under-vulcanized and the skin not
over-vulcanized.
2 RETICULATION KINETIC OF
EPDM VULCANIZED WITH
PEROXIDES
The basic chemistry in the generally accepted
mechanism of peroxide cure of EPDM have been
reviewed by van Duin and co-workers (Dees and
van Duin, 2008); (van Duin, 2002), and may be
summarized by means of the following partial
reactions occurring in series and parallel:
(addition)
HEP(D)MEP(D)MEP(D)MEP(D)MEP(D)MEP(D)M
on)(combinati
EP(D)M-EP(D)M2EP(D)M
nabstractio-H
HROH/R'EP(D)M/R'ROH-EP(D)M
initiation
R'ROROOR
2
1
(1)
The chain of free-radical reactions is initiated by
thermal decomposition of the peroxide, yielding
primary alkoxy (RO) or secondary alkyl radicals
(R). Subsequent abstraction of H-atoms from the
EPDM polymer results in the formation of EPDM
macro-radicals (EPDM). Calculations based on
kinetic data for H-abstraction indicate that H-
abstraction mainly occurs along the saturated EPM
polymer backbone, Van Duin (2002), whereas
several electron paramagnetic resonance (EPR)
spectroscopy studies have shown the selective
formation of allyl radicals derived from the diene
monomer.
Considering the energy required for the
abstraction of the H-atoms, see Figure 2, within the
formation of the back-bone, the allyl radicals are
more probable than the others, because of the lowest
energy required by the abstraction of the H-atoms ,
Knox and Palmer (1961).
The actual cross-linking proceeds via two
pathways, which have been shown to be additive.
Two EPDM macro-radicals either combine or,
alternatively, a macro-radical adds to an EPDM
unsaturation. Visible spectroscopy has confirmed the
conversion of the EPDM unsaturation upon peroxide
cure, Dickland and van Duin (2002). It is noted that
in practical EPDM/peroxide compounds usually co-
agents, such as triallyl (iso)cyanurate,
trimethylolpropane trimethacrylate or m-
phenylenebis(maleimide), are included to increase
the peroxide curing efficiency, Hofmann (1989),
which obviously affects the mechanism of peroxide
1E7 1000000 100000 10000 1000
0,0
0,2
0,4
0,6
0,8
1,0
1,2
a.u
PM (g/mol)
V1703 norm
CO-058 norm
V785 norm
NumericalModelforthePredictionofFinalMechanicalPropertiesofEPDMVulcanizedwithPeroxides-PartI:Basisof
theNumericalModelandExperimentalCampaign
59

cure.
Figure 2: Energy required in order to extract hydrogen
atom from the backbone of the macromolecules at 0 K. At
25°C add 1 Kcal.
In the paper, a simple but effective mathematical
model having kinetic base, to predict the
vulcanization degree of rubber vulcanized with
peroxides is presented.
The approach takes contemporarily into
consideration a large set of reactions occurring
during peroxidic curing, i.e. initiation, H-abstraction,
combination and addition, overcoming the
simplified approach which assumes for peroxidic
curing a single first order reaction. After a suitable
re-arrangement of the first order system of
differential equations obtained from the actual
kinetic system adopted, a single second order non-
linear differential equation is obtained and
numerically solved by means of a Runge-Kutta
approach. Kinetic parameters to set are evaluated by
means of a standard least square procedure where
target data are represented by experimental values
available, i.e. normalized rheometer curves or
percentage crosslink density experimentally
evaluated by means of more sophisticated
procedures.
Two cases of technical interest are critically
discussed, the first relying into an EPDM
crosslinked with di-cumyl peroxide, the second into
a compound with high level of unsaturation
exhibiting reversion at relatively high temperatures
(175°C) near the end of the vulcanization process. A
quite promising agreement is experienced, even in
presence of reversion.
3 THE KINETIC
MATHEMATICAL MODEL
PROPOSED
The mechanism of EPM/EPDM peroxide curing and
the structures formed are still lacking, mainly due to
the complexity of the system (large number of
structures formed at low concentrations) combined
with the relatively difficult in term of analytical
accessibility to determine the cross-linked polymer
networks.
The complex set of the reactions that
characterize peroxide cross-linking involve
homolytic cleavage of peroxide, oxy and alkyl
radicals, hydrogen abstraction, radical coupling
(cross-link formation), polymer scission and radical
transfer. In the case of EPDM, the amount and type
of the third-monomer, could be considered, but in
first approximation it is not considered for the types
of EPDM with lower concentrations of the third-
monomer. Therefore, our cross-link scheme the
different activity from alkyl and oxy radicals in the
homolytic cleavage of peroxide and the secondary
reactions as oxygenation and acid-catalyzed
decomposition of peroxide. From these
considerations, we have adopted for EPM/EPDM the
kinetic scheme for the peroxide cross-link reactions
summarized in Equation (1).
To circumvent limitations of such models in the
application of EPDM rubber, the mechanisms at the
base of vulcanization for such blend should be
properly considered, Milani & Milani (2011, 2012b).
In this framework, focusing exclusively on EPDM
rubber, one possible polymerization scheme may be
the following:
RI
k
2
1
*
2
PPR
k
**
3
2
r
k
PP
**
4
i
k
PP
(2)
In Equation (2),
I
is the peroxide,
R
the primary
alkoxy (RO) or secondary alkyl radicals (R),
P
the uncured polymer,
*
P
is the EPDM macro-
radical,
*
r
P
and
*
i
P
the matured cross-linked
polymers, and
4,...,1
K
are kinetic reaction constants..
Here it is worth emphasizing that
4,...,1
K
are
temperature dependent quantities, hence they
rigorously should be indicated as
)(
4,...,1
TK
, where
T
is the absolute temperature. In what follows, for
the sake of simplicity, the temperature dependence
will be left out.
By means of the so called xyz method,
independent variables may be established. From
stoichiometry of the reaction, it can be argued that:
2
H-vinilyc
H-allilyc
H-3th
H-2nd
H-1st
H
H
H
H
H
H
H
H
CH
H
H
CCCCCC
431.0 kJ/mol
355.6 kJ/mol
380.7 kJ/mol
395.4 kJ/mol
410.0 kJ/mol
E: energy
required to extract H
SIMULTECH2013-3rdInternationalConferenceonSimulationandModelingMethodologies,Technologiesand
Applications
60

xII
0
yxR 2
yPP
0
qzyP 2
*
zP
r
*
qP
i
*
(3)
Obviously, from (3) it can be argued that
independent variables are:
tI
,
tR
,
tP
r
*
,
tP
i
*
.
Indeed:
0
IIx
RIIy )(2
0
00
2 IIRPP
**
0
*
2)(2
ir
PPRIIP
*
r
Pz
*
i
Pq
(4)
The aim is to provide an analytical expression for
vulcanized rubber, i.e. concentration of
*
P
with
respect to time.
From (2) and (3), the following set of differential
equations is deduced:
IK
dt
dI
1
RPKIK
dt
dR
21
2
RPK
dt
dP
2
*
4
2
*
32
*
PKPKRPK
dt
dP
2
*
3
*
PK
d
t
dP
r
*
4
*
PK
dt
dP
i
(5)
(a), (b) and (c) form a system of differential
equations in three variables which may be solved as
follows. (a) may be solved immediately by
separation of variables:
01
0
ttK
eII
(6)
(b)-(c) is:
01
011
22
ttK
eIKIK
dt
dP
dt
dR
(7)
Differentiation of (c) results into:
d
t
dR
PK
d
t
dP
RK
d
t
Pd
22
2
2
(8)
From (7), remembering from (5) that
dt
dP
PK
R
2
1
, the second order differential equation (8) may be
re-written exclusively in terms of P as follows:
02
1
1
021
2
2
2
2
o
ttK
PeIKK
dt
dP
PK
dt
dP
P
dt
Pd
(9)
The non linear differential equation (9) may be
solved numerically with a standard Runge-Kutta
algorithm, Matlab (2011), to find concentration P(t).
The knowledge of P(t) allows to determine R(t) and,
from equation (5)(d),
*
P :
*
4
2
*
32
*
)()( PKPKtPtRK
dt
dP
(10)
Equation (10) is again solved using a Runge-Kutta
numerical approach.
4 COMPARISON WITH
EXPERIMENTAL DATA
A wide experimental campaign has been conducted
by the authors in cooperation with Mixer Spa,
Milani et al., (2013), on a same EPDM blend but
varying a number of different parameters, as for
instance curing agent, peroxide concentrations and
vulcanization temperature.
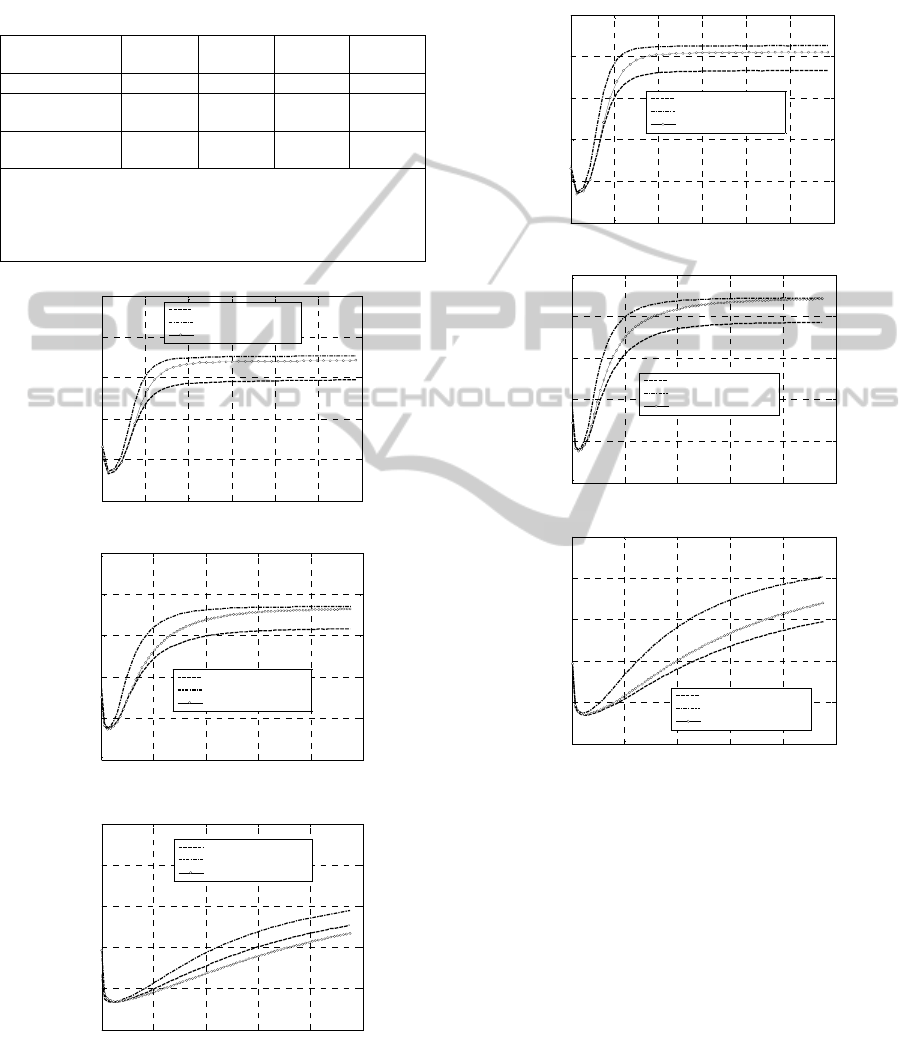
Table 1: Experimental data set analyzed, EPDM
composition in phr.
Polymer
(Exxon)er Manufactur
35.3 100°C 4)+(1 MLMooney
0.9 % in wt. rnenevinylnorbo-VNB
76.2 % in wt. Ethylene
1703P VISTALON
54
Silane treated calcinated kaolin 30
Antioxidants 8
LDPE Riblene MR 10 MFI= 18.7
(ASTM D1238) 6
PE WAX 1
Peroxide 1
A huge amount of experimental data have been
collected, including rheometer curves at different
temperatures and stress strain curves of the
vulcanized items.
The blend under consideration has the
composition schematically reported in Table 1.
As it is possible to notice from the molecular
NumericalModelforthePredictionofFinalMechanicalPropertiesofEPDMVulcanizedwithPeroxides-PartI:Basisof
theNumericalModelandExperimentalCampaign
61
weight distribution of Vistalon 1703 reported in
Figure 1, it is quite wider with respect to other
common products available in the market stock.
The experimentation was conducted varying the
following parameters:
1)
Curing agent. Three different peroxides or a
mixture of peroxides have been tested. The first,
hereafter called M2 for the sake of clearness, is a
mixture of three different peroxides utilized by
the factory, AkzoNobel (2012), to industrially
produce cured rubber. The three peroxides
composing the mixture are the following:
Trigonox T, Perkadox BC-FF and Perkadox 14S
all in the same proportion. The sum of
concentrations of the three peroxides used
industrially are equal to around 1 phr and
hereafter is labeled as +/- 0% concentration. The
second and third peroxides investigated are
commercial products provided by AkzoNobel,
having commercial names as Perkadox BC-FF
and Perkadox 14S-FL. They will be indicated in
the following comparisons as BC-FF and 14S for
the sake of conciseness. Perkadox BC-FF is
dycumil peroxide whereas Perkadox 14S-FL is a
di(tert-butylperoxyisopropyl) benzene. They
exhibit a half time equal to 1 minute at 138°C
and 146°C, respectively. The peroxides are
therefore quite similar; nonetheless, some
perceivable differences in the experimental
rheometer curves of the EPDM under
consideration were observed.
2)
Concentration of the curing agent: five different
concentrations for the different curing agents
investigated were considered, hereafter labeled
as -50%, +/- 0%, 50%, 100 % and 150% for the
sake of clearness. Labels indicated the molar
concentration of the curing agent with respect to
the standard concentration (indicated as +/- 0%)
utilized by Mixer within their production
process.
3) Vulcanization temperature. Rheometer data were
obtained in an oscillating disc curometer at three
different temperatures, respectively equal to
160°C, 180°C and 200°C. A wider range of
temperatures was experimentally investigated by
the authors, namely from 120°C up to 220°C, but
the activity of the curing agents resulted
suboptimal out of the range 160°-200°C.
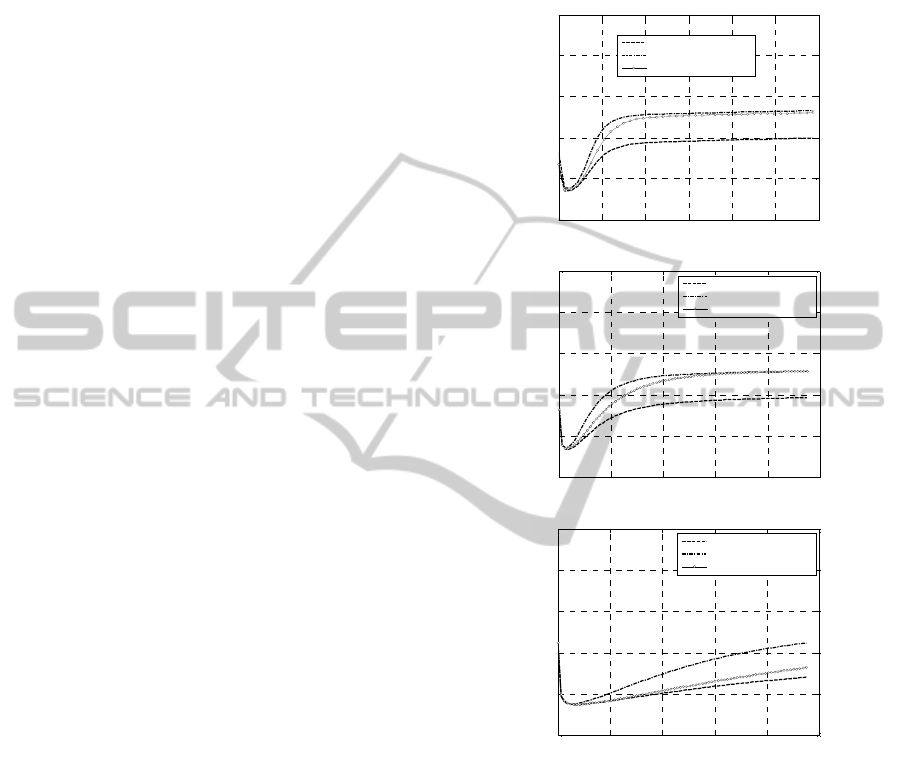
In figures from Figure 3 to Figure 7, detailed
comparisons among the performances during
vulcanization (rheometer curves) exhibited by the
three different curing agents at different
concentrations are shown. Such comparisons are
useful to have an insight into the most suited curing
agent to be used at different temperatures. It is quite
clear that the optimal behavior of all curing agents is
obtained at 150% concentrations.
-a
-b
-c
Figure 3: -50% Concentrations. Experimental rheometer
curves at different peroxide concentrations. –a: 160 °C. –
b: 180 °C. –c: 200 °C.
For such concentrations and for a curing
temperature equal to 200°C, it can be observed that
the maximum torque provided by all curing agents
(M2, BC-FF and 14-S) is roughly the same (around
55 dNm, see Figure 7). Furthermore, the times
needed to obtain 90% of the maximum torque (t90
values) seem very similar, meaning that also the
kinetic constants at 200°C to be expected by the
numerical model proposed should be very similar.
Two replicates for each vulcanization condition
were considered within the experimental campaign,
in order to reduce possible inaccuracies of the
0 2 4 6 8 10 12
0
10
20
30
40
50
200°C -50%
Time t [min]
Torque [dN*m]
M2 Retic M3 Laboratory
Perkadox BC - FF
Perkadox 14 S - FL
0 5 10 15 20 25
0
10
20
30
40
50
180°C -50%
Time t [min]
Torque [dN*m]
M2 Retic M3 Laboratory
Perkadox BC - FF
Perkadox 14 S - FL
0 5 10 15 20 25
0
10
20
30
40
50
160°C -50%
Time t [min]
Torque [dN*m]
M2 Retic M3 Laboratory
Perkadox BC - FF
Perkadox 14 S - FL
SIMULTECH2013-3rdInternationalConferenceonSimulationandModelingMethodologies,Technologiesand
Applications
62
experimentation. In this manner, a total amount of
90 different rheometer curves were experimentally
determined.
Table 2: half-life temperatures of the peroxides analysed at
0.1, 1 and 10 hours.
Peroxide
typology
t
1/2
in
hours
0.1 1 10
TRIGONOX T 169 146 117
PERKADOX
BC-FF
162 138 112
PERKADOX
14 S-FL
169 146 117
TRIGONOX T: ter-butylcumylperoxide
PERKADOX BC-FF: dicumyl peroxide
PERKADOX 14S-FF: di(tert-butylperoxyisopropyl) benzene
Curing agent M2 is a mixture of BC-FF, 14S-FF and Trigonox
T
-a
-b
-c
Figure 4: +/-0% Concentrations. Experimental rheometer
curves at different peroxide concentrations. –a: 160 °C. –
b: 180 °C. –c: 200 °C.
As expected, in all cases, experimental rheometer
curves do not exhibit perceivable reversion, due to
the low amount of unsaturations present in the
EPDM utilized.
-a
-b
-c
Figure 5: +50% Concentrations. Experimental rheometer
curves at different peroxide concentrations. –a: 160 °C. –
b: 180 °C. –c: 200 °C.
5 CONCLUSIONS
A combined numerical model and experimental
campaign have been conducted with the aim of
tuning and validating a complex numerical model
with kinetic base, useful to predict the final crosslink
density of rubber vulcanized with single peroxides
or mixtures of peroxides. In the present Part I, the
experimental results are presented and discussed. In
addition, the theoretical base of the numerical model
0 2 4 6 8 10 12
0
10
20
30
40
50
200°C +/-0%
Time t [min]
Torque [dN*m]
M2 Retic M3 Laboratory
Perkadox BC - FF
Perkadox 14 S - FL
0 5 10 15 20 25
0
10
20
30
40
50
180°C +/-0%
Time t [min]
Torque [
d
N
*
m]
M2 Retic M3 Laboratory
Perkadox BC - FF
Perkadox 14 S - FL
0 5 10 15 20 25
0
10
20
30
40
50
160°C +/-0%
Time t [mi n]
Torque [dN*m]
M2 Retic M3 Laboratory
Perkadox BC - FF
Perkadox 14 S - FL
0 2 4 6 8 10 12
0
10
20
30
40
50
200°C +50%
Time t [min]
Torque [dN*m]
M2 Retic M3 Laboratory
Perkadox BC - FF
Perkadox 14 S - FL
0 5 10 15 20 25
0
10
20
30
40
50
180°C +50%
Time t [min]
Torque [dN*m]
M2 Retic M3 Laboratory
Perkadox BC - FF
Perkadox 14 S - FL
0 5 10 15 20 25
0
10
20
30
40
50
160°C +50%
Time t [min]
Torque [dN*m]
M2 Retic M3 Laboratory
Perkadox BC - FF
Perkadox 14 S - FL
NumericalModelforthePredictionofFinalMechanicalPropertiesofEPDMVulcanizedwithPeroxides-PartI:Basisof
theNumericalModelandExperimentalCampaign
63
is presented.
-a
-b
-c
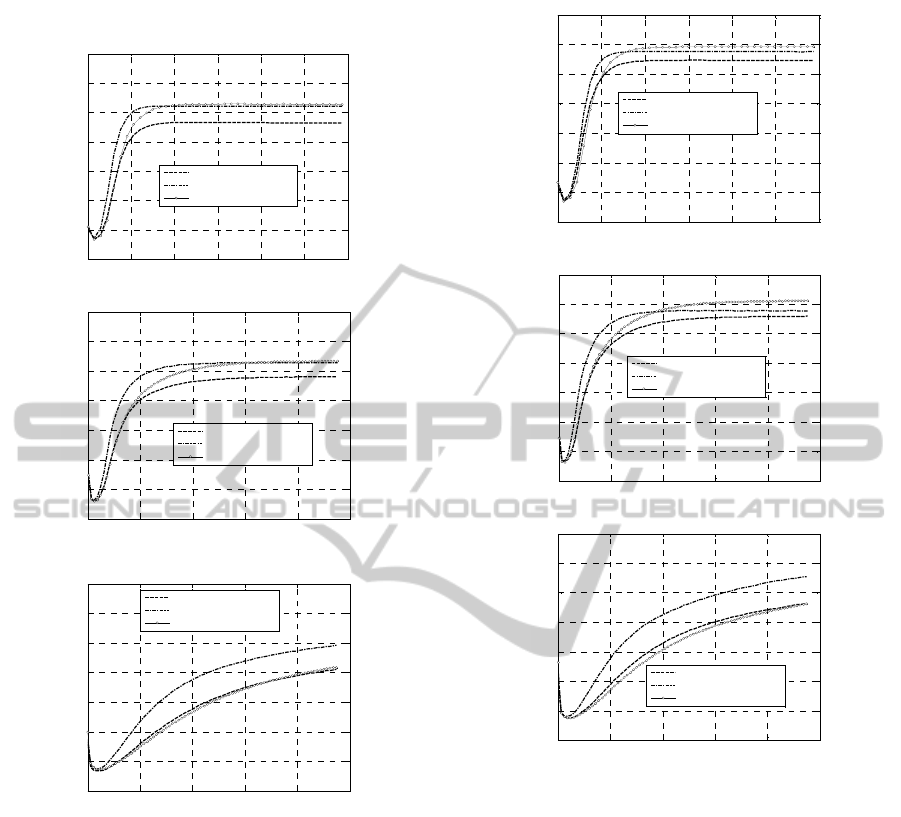
Figure 6: +100% Concentrations. Experimental rheometer
curves at different peroxide concentrations. –a: 160 °C. –
b: 180 °C. –c: 200 °C.
The experimental part is wide, since a number of
different cases occurring in practice has been
investigated in detail, varying curing agent typology,
vulcanization temperatures and concentration of the
peroxides. Both rheometer curves to compare with
those provided by the numerical model and stretch-
strain curves of the vulcanized samples have been
collected, to have a precise insight into the most
suitable parameters to use during curing.
-a
-b
-c
Figure 7: +150% Concentrations. Experimental rheometer
curves at different peroxide concentrations. –a: 160 °C. –
b: 180 °C. –c: 200 °C.
REFERENCES
AkzoNobel (2012). Brochure of organic peroxides,
available at http://www.akzonobel.com/polymer/
Dees, M., van Duin, M., 2008. Rubber World, Aug./Sept.
Dikland, H.G., van Duin, M., 2002. Crosslinking of
EPDM and Polydiene Rubbers Studied by Optical
Spectroscopy. In: Spectroscopy of Rubbers and
Rubbery Materials, Rapra Technology Ltd., Litvinov
VM, De PP (Eds), Shawbury, Shrewsbury, Shropshire,
207.
Hofmann, W., 1989. Rubber Technology Handbook,
Hanser Publishers, Munich.
Knox, B.E., Palmer, B., 1961. Chem. Rev., 61: 247.
Matlab User’s Guide, 2007. http://www.mathworks.com/
products/matlab/
0 2 4 6 8 10 12
0
10
20
30
40
50
60
70
200°C +100%
Time t [min]
Torque [dN*m]
M2 Retic M3 Laboratory
Perkadox BC - FF
Perkadox 14 S - FL
0 5 10 15 20 25
0
10
20
30
40
50
60
70
180°C +100%
Time t [min]
Torque [dN*m]
M2 Retic M3 Laboratory
Perkadox BC - FF
Perkadox 14 S - FL
0 5 10 15 20 25
0
10
20
30
40
50
60
70
160°C +100%
Time t [min]
Torque [dN*m]
M2 Retic M3 Laboratory
Perkadox BC - FF
Perkadox 14 S - FL
0 2 4 6 8 10 12
0
10
20
30
40
50
60
70
200°C +150%
Time t [min]
Torque [dN*m]
M2 Retic M3 Laboratory
Perkadox BC - FF
Perkadox 14 S - FL
0 5 10 15 20 25
0
10
20
30
40
50
60
70
180°C +150%
Time t [min]
Torque [dN*m]
M2 Retic M3 Laboratory
Perkadox BC - FF
Perkadox 14 S - FL
0 5 10 15 20 25
0
10
20
30
40
50
60
70
160°C +150%
Time t [min]
Torque [dN*m]
M2 Retic M3 Laboratory
Perkadox BC - FF
Perkadox 14 S - FL
SIMULTECH2013-3rdInternationalConferenceonSimulationandModelingMethodologies,Technologiesand
Applications
64

Milani, G., Galanti, A., Cardelli, C., Milani, F., 2013.
Peroxide cross-linking of EPDM for medium voltage
cable applications: experimental insight. In: Proc.
183rd Technical Meeting Akron, Ohio Monday, April
22, 2013 - Wednesday, April 24, 2013
Milani, G., Milani, F., 2008. Computers & Chemical
Engineering, 32: 3198-3212.
Milani, G., Milani, F., 2010. Journal of Mathematical
Chemistry 47(1): 229-267.
Milani, G., Milani, F., 2011. Journal of Mathematical
Chemistry, 48: 530–557.
Milani, G., Milani, F., 2012a. Computers & Chemical
Engineering, 43: 173–190.
Milani, G., Milani, F., 2012b. Journal of Applied Polymer
Science, 124(1): 311–324.
Milani, G., Milani, F., 2013. Kinetic FE model to optimize
sulphur vulcanization: application to extruded EPDM
weather-strips. Polymer Engineering and Science, in
press.
van Duin, M., 2002. Kautsch. Gummi Kunstst, 55: 150.
NumericalModelforthePredictionofFinalMechanicalPropertiesofEPDMVulcanizedwithPeroxides-PartI:Basisof
theNumericalModelandExperimentalCampaign
65
