
Numerical Model for the Prediction of Final Mechanical Properties
of EPDM Vulcanized with Peroxides
Part II Results
Gabriele Milani
1
and Federico Milani
2
1
Politecnico di Milano, Piazza Leonardo da Vinci 32, 20133 Milan, Italy
2
Chem.Co Consultant, Via J.F. Kennedy 2, 45030 Occhiobello (RO), Italy
Keywords: Kinetic Numerical Model, EPDM Rubber, Peroxides, Comparison with Experimental Data.
Abstract: In the present Part II, the kinetic numerical model discussed in detail in Part I, is applied to the huge amount
of experimental data collected by the authors. Rheometer curves are fitted numerically for three different
curing temperatures, for all the curing agents investigated at a concentration equal to 150%, which have
proved to be the most adequate to obtain optimal crosslinking of the EPDM under consideration. The
comparisons with experimental data at three different temperatures allow estimating partial kinetic constants
of the model as a function of the absolute temperature, with a direct comparison with simplified formulas
provided by the peroxide producers. The application of the numerical kinetic model to a large variety of real
scale examples allows a direct validation of the capabilities of the approach proposed, as well as an
evaluation of the most suitable production parameters to use in practice (curing time and temperature,
concentration and typology of the curing agents) in order to maximize rubber output mechanical properties
and crosslink homogeneity, without the need to perform costly experimental campaign.
1 INTRODUCTION
To propose ad-hoc numerical models for the
interpretation of vulcanization kinetics is paramount
when producers are interested in a fast and less
expensive (when compared with an experimental
approach) evaluation of the most suitable production
parameters to use in order to optimize rubber output
mechanical properties, as for instance average
tensile strength, elongation at break, tear resistance,
etc., Hofmann (1989), Milani et al. (2013).
The procedure of optimization performed on
production parameters includes –but it is not limited
to- the evaluation of the curing temperature,
typology and concentration of peroxide and
exposition time to use to maximize an a-priori
established characteristic of the vulcanized
compound, Milani and Milani (Milani and Milani
2010), (Milani and Milani, 2012a), (Milani and
Milani, 2013b).
Peroxides producers usually provide simplified
kinetic mechanisms for their peroxides, which
always follow a so called first order Arrhenius
equation. By means of the knowledge of the so-
called half-time life of the peroxide, it is possible to
roughly identify a temperatures interval where the
vulcanization has to be conducted. However, no
information is provided on concentrations, which
usually is fixed following well established rules of
thumb and a change of few degrees in the curing
temperature may result into a strong decrease of the
final quality of the crosslinked items, especially for
thick ones.
In addition, it can be affirmed that, while this
simplified approach may be quite effective for a
rough estimation of the most suitable peroxide to
adopt within standard curing conditions, more
sophisticated approaches are needed when mixtures
of peroxides or extreme curing conditions are
utilized.
Such conditions include drastic reduction of the
curing time, always associated to high vulcanization
temperatures and the uniform vulcanization of item
with thickness varying from moderate to large.
For all the aforementioned cases, the adoption of
simplified procedures progressives become no more
effective and more quantitative approaches are
required.
In this framework, it appears particularly
interesting to utilize a comprehensive numerical
66
Milani G. and Milani F..
Numerical Model for the Prediction of Final Mechanical Properties of EPDM Vulcanized with Peroxides - Part II Results.
DOI: 10.5220/0004423800660073
In Proceedings of the 3rd International Conference on Simulation and Modeling Methodologies, Technologies and Applications (SIMULTECH-2013),
pages 66-73
ISBN: 978-989-8565-69-3
Copyright
c
2013 SCITEPRESS (Science and Technology Publications, Lda.)
model, based on the actual partial reactions
occurring during vulcanization. The kinetic model
proposed in Part I, suitable to obtain a quantitative
interpretation of the vulcanization process for
EPDM rubber vulcanized with peroxides, is applied
in the present paper to analyze the experimental
results discussed in the companying paper.
Rheometer curves obtained experimentally for the
three curing agents considered are fitted numerically
at three different curing temperatures, at a
concentration equal to 150%, which have proved to
be the most adequate to obtain optimal crosslinking
of the EPDM under consideration. The comparisons
with experimental data at different temperatures
allow estimating partial kinetic constants of the
model as a function of the absolute temperature,
with a direct comparison with simplified formulas
provided by the peroxide producers.
2 EXPERIMENTAL DATA
NUMERICAL
POST-PROCESSING
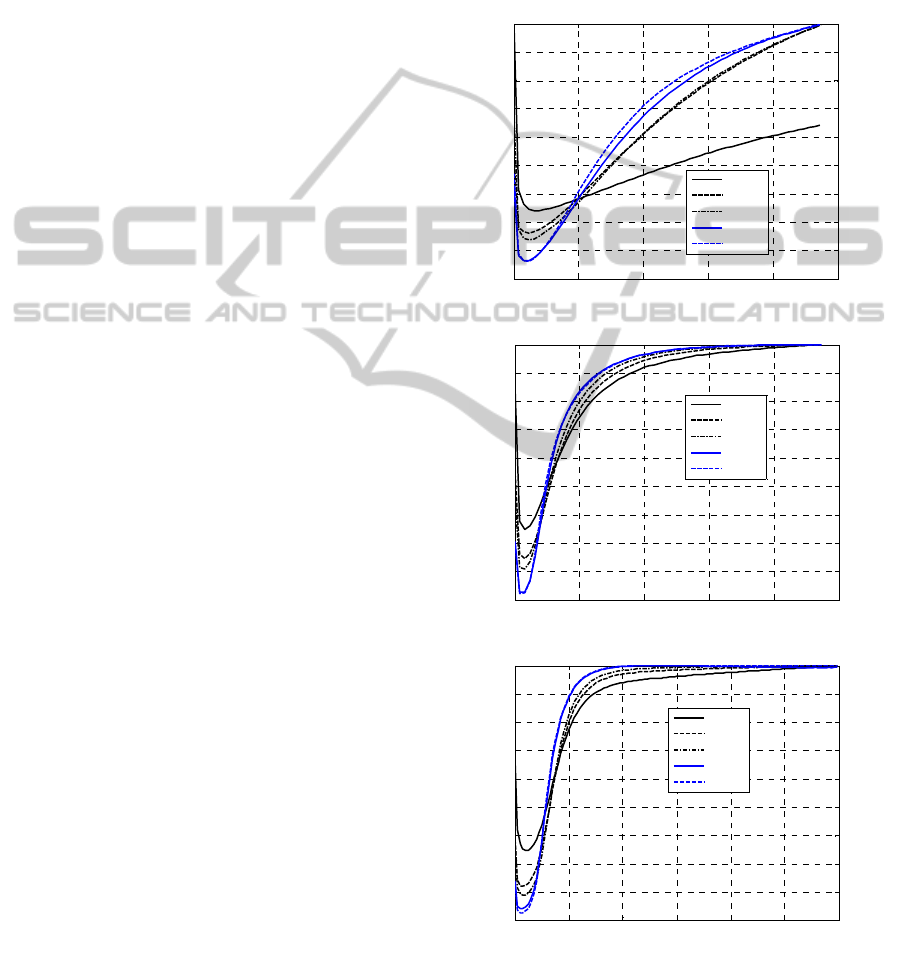
Normalized experimental rheometer curves are
comparatively represented for the three different
peroxides from Figure 1 to Figure 3. In particular, in
Figure 1 results obtained using as curing agent M2
are depicted, in Figure 2 BC-FF data are
represented, whereas in Figure 3 14S rheometer
curves are summarized. Subfigures -a. –b and and –c
refer to temperatures equal to 160°C, 180°C and
200°C respectively.
Normalization is conducted dividing each value
of the torque by the maximum torque, Milani and
Milani (Milani and Milani, 2011), (Milani and
Milani, 2012b), (Milani and Milani, 2013a), which
occurs at the end of the test, since no reversion is
present for all the cases analyzed. The different
curves represented refer to the different
concentrations inspected in the experimental
campaign, namely -50%, +/- 0%, +50%, +100%,
+150%.
As it is possible to notice, there are small but
perceivable differences among the normalized
curves, meaning that curing agent concentration has
some effects on the behavior of the compound
during vulcanization. However, it is particularly
evident that, increasing curing agent concentration,
reticulation exhibits an asymptotic behavior, in all
the cases analyzed. Indeed, rheometer curves
corresponding to +100% and +150% are in practice
superimposable, meaning that, beyond such
concentrations, the reticulation is fully independent
from the curing agent concentration. Experimental
evidences show that crosslinking optimality could be
obtained with at least an amount of peroxide double
with respect to the standard one (100%
concentrations), implicitly stating that the standard
+/- 0% peroxide concentrations provides suboptimal
vulcanized items.
-a
-b
-c
Figure 1: M2 peroxides mixture. Normalized experimental
rheometer curves at different peroxide concentrations. –a:
160 °C. –b: 180 °C. –c: 200 °C.
0 5 10 15 20 25
0.1
0.2
0.3
0.4
0.5
0.6
0.7
0.8
0.9
1
Time [mi n]
Normalized torque M
t
/M
tmax
M2 160°C
-50%
+/-0%
+50%
+100%
+150%
0 5 10 15 20 25
0.1
0.2
0.3
0.4
0.5
0.6
0.7
0.8
0.9
1
Time [mi n]
Normalized torque M
t
/M
tmax
M2 180°C
-50%
+/-0%
+50%
+100%
+150%
0 2 4 6 8 10 12
0.1
0.2
0.3
0.4
0.5
0.6
0.7
0.8
0.9
1
Time [mi n]
Normalized torque M
t
/M
tmax
M2 200°C
-50%
+/-0%
+50%
+100%
+150%
NumericalModelforthePredictionofFinalMechanicalPropertiesofEPDMVulcanizedwithPeroxides-PartIIResults
67
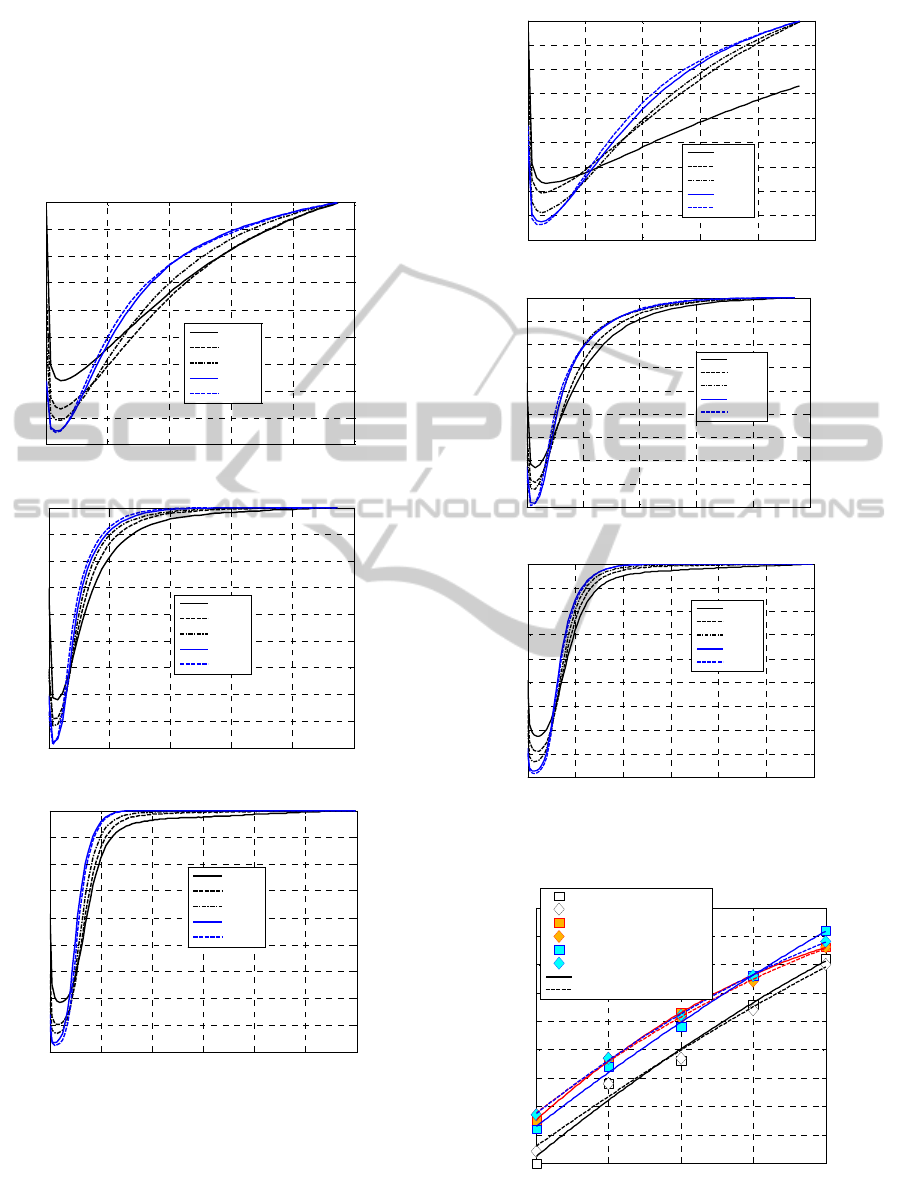
On the other hand, it is worth noting that the
numerical model proposed is independent from
peroxide concentration. As a consequence, data to
consider for the comparisons between numerical
predictions and experimental results should be those
provided with a 150% concentration of the
peroxides.
-a
-b
-c
Figure 2: BC-FF peroxide. Normalized experimental
rheometer curves at different peroxide concentrations. –a:
160 °C. –b: 180 °C. –c: 200 °C.
-a
-b
-c
Figure 3: 14S peroxide. Normalized experimental
rheometer curves at different peroxide concentrations. –a:
160 °C. –b: 180 °C. –c: 200 °C.
Figure 4: Peroxide concentration % versus torque.
Experimental data (points) and parabolic numerical
interpolation.
0 5 10 15 20 25
0.1
0.2
0.3
0.4
0.5
0.6
0.7
0.8
0.9
1
Time [min]
Normalized torque M
t
/M
tmax
BC-FF 160°C
-50%
+/-0%
+50%
+100%
+150%
0 5 10 15 20 25
0.1
0.2
0.3
0.4
0.5
0.6
0.7
0.8
0.9
1
Time [mi n]
Normalized torque M
t
/M
tmax
BC-FF 180°C
-50%
+/-0%
+50%
+100%
+150%
0 2 4 6 8 10 12
0.1
0.2
0.3
0.4
0.5
0.6
0.7
0.8
0.9
1
Time [min]
Normalized torque M
t
/M
tmax
BC-FF 200°C
-50%
+/-0%
+50%
+100%
+150%
0 5 10 15 20 25
0.1
0.2
0.3
0.4
0.5
0.6
0.7
0.8
0.9
1
Time [min]
Normalized torque M
t
/M
tmax
14S 160°C
-50%
+/-0%
+50%
+100%
+150%
0 5 10 15 20 25
0.1
0.2
0.3
0.4
0.5
0.6
0.7
0.8
0.9
1
Time [min]
Normalized torque M
t
/M
tmax
14S 180°C
-50%
+/-0%
+50%
+100%
+150%
0 2 4 6 8 10 12
0.1
0.2
0.3
0.4
0.5
0.6
0.7
0.8
0.9
1
Time [mi n]
Normalized torque M
t
/M
tmax
14S 200°C
-50%
+/-0%
+50%
+100%
+150%
-50 0 50 100 150
20
25
30
35
40
45
50
55
60
65
Peroxide concentration with respect to standard one [%]
Torque [dNm]
M2 180°C
M2 200°C
BCFF 180°C
BCFF 200°C
14-S 180°C
14-S 200°C
Parabola interpolation 180°C
Parabola interpolation 200°C
SIMULTECH2013-3rdInternationalConferenceonSimulationandModelingMethodologies,Technologiesand
Applications
68
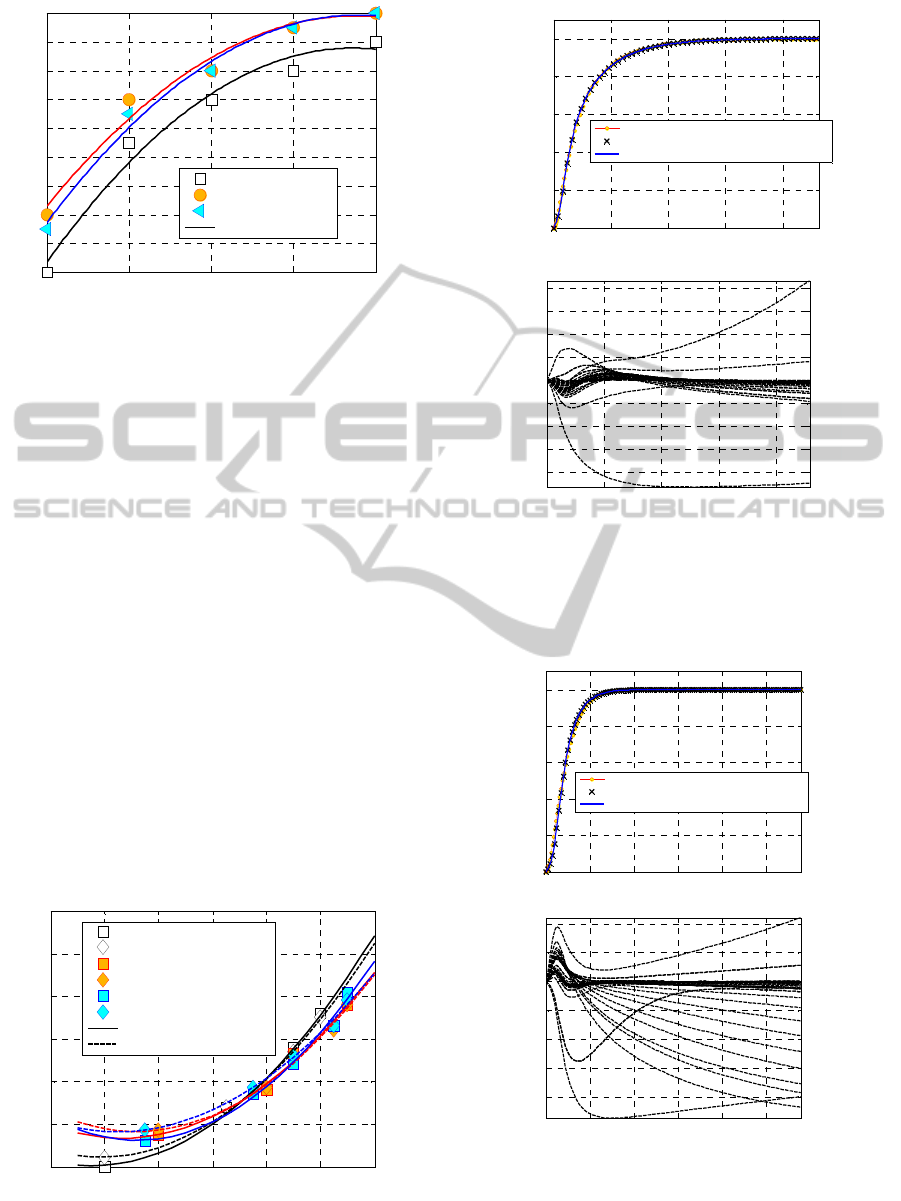
Figure 5: Peroxide concentration % versus tensile strength.
Experimental data (points) and parabolic numerical
interpolation.
To corroborate the idea that a greater concentration
of peroxide with respect to the standard one results
into an optimal crosslink of the EPDM under
consideration, in figures from Figure 4 to Figure 6 a
synopsis of the experimental results available is
represented in graphical form. In particular, in
Figure 4, peroxide concentration % versus torque is
represented for all the curing agents and
temperatures investigated. Experimental data are
represented with points (squares and diamonds refer
to 180°C and 200°C respectively, white, orange and
cyan colors to M2, BC-FF) whereas continuous
(180°C) and dashed lines (200°C) are parabolic
numerical interpolations. In Figure 5, the same
symbols are utilized to represent the relationship
between peroxide concentration and tensile strength,
whereas in Figure 6 tensile strength versus torque is
represented. As it is possible to notice, especially
from Figure 5 , it can be observed that tensile
strength reaches an asymptotic value for 150%
concentrations.
Figure 6: Tensile strength versus torque. Experimental
data (points) and parabolic numerical interpolation.
-a
-b
Figure 7: M2 curing agent, 180°C. Comparison between
experimental data and numerical model. –a: full
normalized curve. –b: difference between numerical
model and experimental normalized torque at successive
iterations.
-a
-b
Figure 8: M2 curing agent, 200°C. Comparison between
experimental data and numerical model. –a: full
normalized curve. –b: difference between numerical
model and experimental normalized torque at successive
iterations.
-50 0 50 100 150
8
9
10
11
12
13
14
15
16
17
Peroxide concentration with respect to standard one [%]
Tensile strength [MPa]
M2
BCFF
14-S
Parabola interpolation
6 8 10 12 14 16 18
20
30
40
50
60
70
80
Tensile strength [MPa]
Torque [dNm]
M2 180°C
M2 200°C
BCFF 180°C
BCFF 200°C
14-S 180°C
14-S 200°C
Parabola interpolation 180°C
Parabola interpolation 200°C
0 5 10 15 20
0
0.2
0.4
0.6
0.8
1
Time [min]
Normalized torque M
t
/M
tmax
M2 +150% 180°C
Present model solution
Experimental data utilized to set numerical model
Full experimental data curve
0 5 10 15 20
-0.8
-0.6
-0.4
-0.2
0
0.2
0.4
0.6
0.8
Time [min]
absolute error e
error e=(normalized numeric torque-experimental torque)
N
iter
=1
N
iter
=10
N
iter
=20
N
iter
=30
N
iter
=40
N
iter
=50
0 2 4 6 8 10
0
0.2
0.4
0.6
0.8
1
Time [mi n]
Normalized torque M
t
/M
tmax
M2 +150% 200°C
Present model solution
Experimental data utilized to set numeric al model
Full experimental data curve
0 2 4 6 8 10
-0.8
-0.6
-0.4
-0.2
0
0.2
0.4
Time [mi n]
absolute error e
error e=(normalized numeric torque-experime ntal torque)
N
iter
=1
N
iter
=10
N
iter
=20
N
iter
=30
N
iter
=40
N
iter
=50
NumericalModelforthePredictionofFinalMechanicalPropertiesofEPDMVulcanizedwithPeroxides-PartIIResults
69
To perform a numerical optimization of the kinetic
model proposed, experimental cure values are
normalized dividing each point of the curve by the
maximum torque values, so that experimental data
are always within the range 0-1.
A comparison between present numerical curves
and experimental data is provided from Figure 7-a to
Figure 12-a for EPDM vulcanized with M2, BC-FF
and 14-S at 180°C and 200°C respectively. The
resultant kinetic constants found numerically are
summarized in Table 1.
Numerical curves are obtained using a non-linear
least square procedure, for which the convergence
performance is evaluated from Figure 7-b to Figure
12-b. In particular, in the figures, the absolute
difference between normalized experimental torque
and numerical predictions is represented, at
successive iterations and at increasing instants
between the initial and final time of
experimentation. Obviously, as expected, passing
from the initial iteration to the final, such difference
decreases drastically, meaning that the least square
routine is achieving convergence. As it is possible to
notice, the gap between numerical models and
experimental data tends to zero for almost the
instants inspected, exception made for the initial
simulation range, near scorch point.
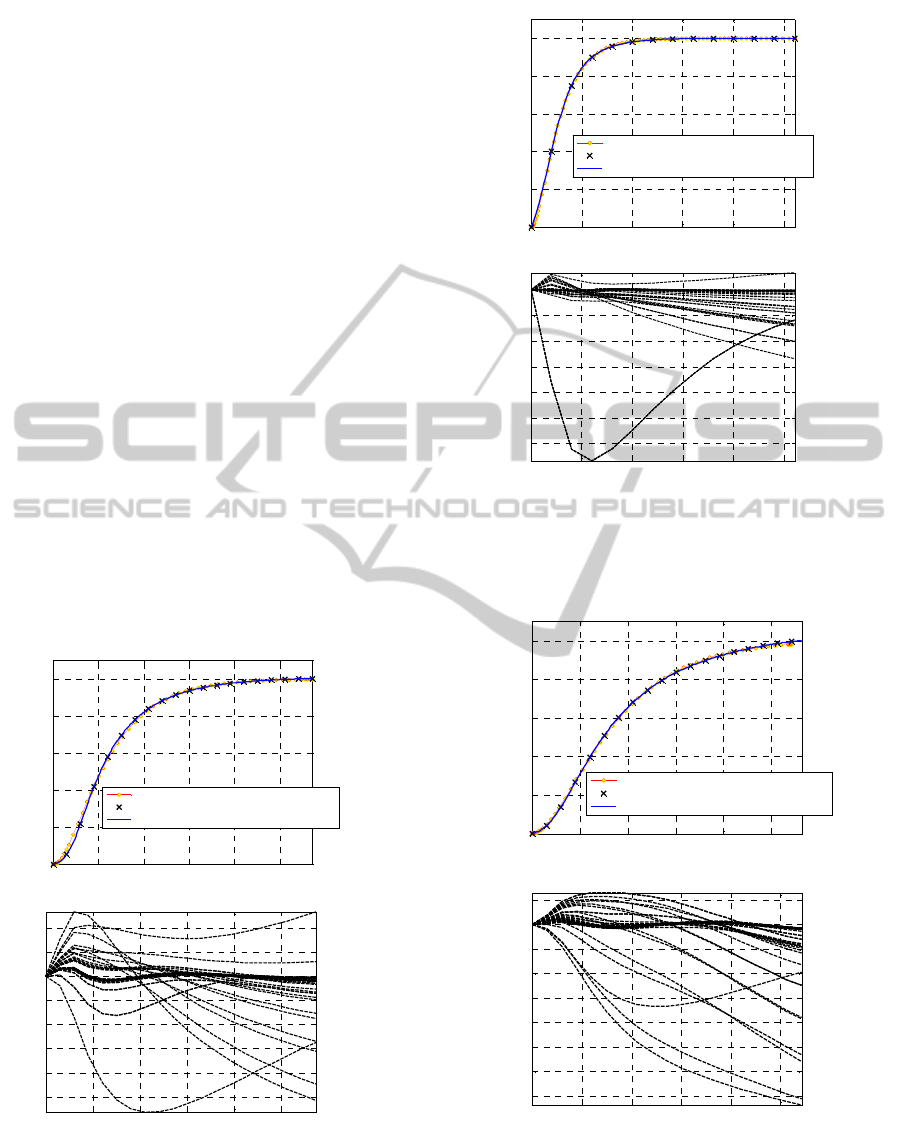
-a
-b
Figure 9: BC-FF, 180°C. Comparison between
experimental data and numerical model. –a: full
normalized curve. –b: difference between numerical
model and experimental normalized torque.
-a
-b
Figure 10: BC-FF, 200°C. Comparison between
experimental data and numerical model. –a: full
normalized curve. –b: difference between numerical
model and experimental normalized torque.
-a
-b
Figure 11: 14-S, 180°C. Comparison between
experimental data and numerical model. –a: full
normalized curve. –b: difference between numerical
model and experimental normalized torque.
0 2 4 6 8 10
0
0.2
0.4
0.6
0.8
1
Time [mi n]
Normalized torque M
t
/M
tmax
Mixer Perkadox BC-FF 180°C
Present model solution
Experimental data utilized to set numerical model
Full experimental data curve
0 2 4 6 8 10
-0.5
-0.4
-0.3
-0.2
-0.1
0
0.1
0.2
Ti me [mi n]
absolute error e
error e=(normalized numeric torque-experimental torque)
N
iter
=1
N
iter
=10
N
iter
=20
N
iter
=30
N
iter
=40
N
iter
=50
0 1 2 3 4 5
0
0.2
0.4
0.6
0.8
1
Time [mi n]
Normalized torque M
t
/M
tmax
Mixer Perkadox BC-FF 200°C
Present model solution
Experimental data utilized to set numerical model
Full experimental data curve
0 1 2 3 4 5
-0.6
-0.5
-0.4
-0.3
-0.2
-0.1
0
Time [min]
absolute error e
error e=(normalized numeric torque-experimental torque)
N
iter
=1
N
iter
=10
N
iter
=20
N
iter
=30
N
iter
=40
N
iter
=50
0 2 4 6 8 10
0
0.2
0.4
0.6
0.8
1
Time [mi n]
Normalized torque M
t
/M
tmax
Mixer Perkadox 14S-FL 180°C
Present model solution
Experimental data utilized to set numerical model
Full experimental data curve
0 2 4 6 8 10
-0.7
-0.6
-0.5
-0.4
-0.3
-0.2
-0.1
0
0.1
Time [mi n]
absolute error e
error e=(normalized numeric torque-experimental torque)
N
iter
=1
N
iter
=10
N
iter
=20
N
iter
=30
N
iter
=40
N
iter
=50
SIMULTECH2013-3rdInternationalConferenceonSimulationandModelingMethodologies,Technologiesand
Applications
70
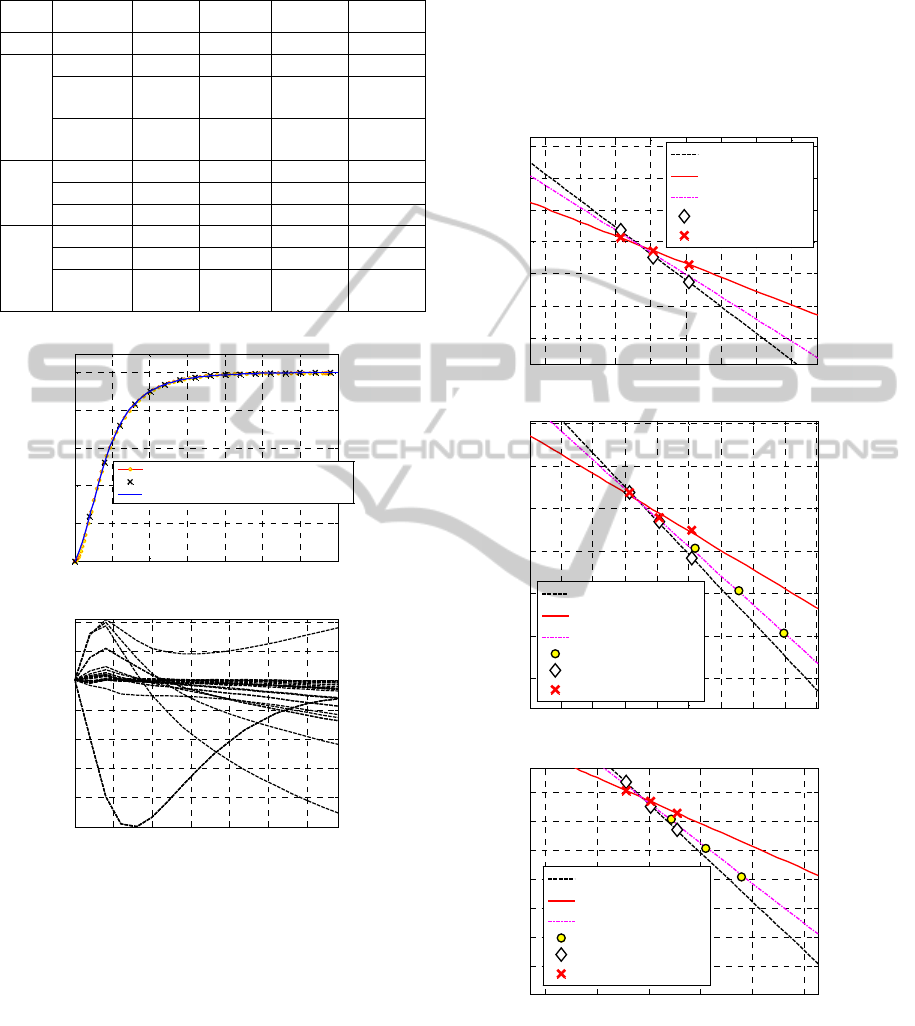
Table 1: numerical results obtained after least square
optimization for kinetic constants
i
K
.
Temp
1
K
2
K
3
K
4
K
[°C] 1/min 1/min 1/min 1/min
M2
0.055 0.190 0.00 0.00 0.055
0.327 0.513 0.00
1.28
e-4
0.327
2.284 1.319 1.13 e-4
8.70
e-4
2.284
BC-
FF
0.069 0.301 0.00 0.00 0.069
0.491 0.602 0.0001 0.0002 0.491
2.401 2.330 0.0002 0.0001 2.401
14-S
0.048 0.191 0.00 0.00 0.048
0.312 0.473 0.00 0.00 0.312
2.221 1.126 9.46 e-5
3.45
e-5
2.221
-a
-b
Figure 12: 14-S, 200°C. Comparison between
experimental data and numerical model. –a: full
normalized curve. –b: difference between numerical
model and experimental normalized torque.
Here the experimental curve exhibits a sudden
increase in the first derivate, meaning that the
initiation of vulcanization is prone to occur. In any
case, this stage is of little interest for the models
proposed, which are designed for a reliable
prediction of final reticulation level. In general, the
agreement with experimental response seems rather
promising, with an almost perfect superposition of
the numerical curves with experimental data.
The convergence map of the least-square
algorithm shows that after around 50 iterations the
best fitting is always achieved, with errors in
practice vanishing. The numerical values of the four
kinetic constants defining completely the reaction
kinetic are summarized for all peroxides
investigated, in
Table.
-a
-b
-c
Figure 13: Linear regression interpolation of the kinetic
constants
1
K
and
2
K
provided by the single differential
equation model, the resultant linear regression obtained as
1
K
+
2
K
and comparison with commercial data provided
by Akzo Nobel for the peroxide under consideration. –a:
M2. –b: BC-FF. –c: 14-S.
0 1 2 3 4 5 6 7
0
0.2
0.4
0.6
0.8
1
Time [mi n]
Normalized torque M
t
/M
tmax
Mixer Perkadox 14S-FL 200°C
Present model solution
Experimental data utilized to set numerical model
Full experimental data curve
0 1 2 3 4 5 6
-0.4
-0.3
-0.2
-0.1
0
0.1
0.2
Time [mi n]
absolute error e
error e=(normalized numeric torque-experimental torque)
N
iter
=1
N
iter
=10
N
iter
=20
N
iter
=30
N
iter
=40
N
iter
=50
1.9 2 2.1 2.2 2.3 2.4 2.5 2.6
x 10
-3
-3
-2
-1
0
1
2
3
Mixer M2 curing agent
1/T [K]
log(Ki)
K
1
=K
10
e
E
a
/R
g
T
K
2
=K
20
e
E
a
/R
g
T
1/3[2*log(K
1
)+log(K
2
)]
Numerical data K
1
Numerical data K
2
1.9 2 2.1 2.2 2.3 2.4 2.5 2.6 2.7
x 10
-3
-4
-3
-2
-1
0
1
2
Perkadox BC-FF
1/T [K]
log(Ki)
K
1
=K
10
e
E
a
/R
g
T
K
2
=K
20
e
E
a
/R
g
T
1/3[2*log(K
1
)+log(K
2
)]
AkzoNobel commercial data
Numerical data K
1
Numerical data K
2
1.8 2 2.2 2.4 2.6 2.8
x 10
-3
-6
-5
-4
-3
-2
-1
0
Perkadox 14S
1/T [K]
log(Ki)
K
1
=K
10
e
E
a
/R
g
T
K
2
=K
20
e
E
a
/R
g
T
1/3[2*log(K
1
)+log(K
2
)]
AkzoNobel commercial data
Numerical data K
1
Numerical data K
2
NumericalModelforthePredictionofFinalMechanicalPropertiesofEPDMVulcanizedwithPeroxides-PartIIResults
71

Considering the numerical values obtained for
the first two constants
1
K
and
2
K
, reported in Table
(the other constants are almost zero, indicating that
no reversion is experienced) at two distinct
temperatures, it appears interesting to plot the
straight lines passing from such values in the
Arrhenius plane. In such space, the horizontal axis is
represented by the inverse of the absolute
temperature,
T/1
, whereas the vertical axis is
i
Klog
, where
i
K
is the i-th kinetic constant. It is,
indeed, commonly accepted that the variability of a
single kinetic constant follows the so called
Arrhenius law, which may be written as
TR
E
ii
g
ai
eKTK
0
, where
0i
K
is the value of the i-th
kinetic constant at an infinite temperature,
ai
E
is a
constant typical of the reaction and
g
R
is the
universal gas constant. In a
T/1
-
i
Klog
Cartesian
plane, the Arrhenius law is thus represented by a
straight line, intercepting vertical axis at
0
log
i
K
.
Since experimental data are available at two distinct
temperatures, and accepting that each single constant
follows an Arrhenius law, it is possible to sketch
TK
i
lines in the
T/1
-
i
Klog
plane, for both
peroxides under consideration. Such representation
is particularly useful from a practical point of view,
because it allows a direct evaluation of the kinetic
constants describing the velocity of the partial
reactions at any vulcanization temperature. The
straight lines numerically deduced are depicted
inFigure 13. Subfigures refer to peroxides M2 (-a),
BC-FF (-b) and 14-S (-c) respectively. Numerical
data of Table 1, utilized to plot the straight lines, are
also indicated for the sake of clearness. In order to
evaluate if the numerical approach proposed is in
agreement with simplified procedures commonly
used in practice, it is also possible to compare
numerical results with commercial data available for
both peroxides under consideration. In particular,
Akzo Nobel furnishes in tabular form values of the
kinetic constants of both BC-FF and 14-S at three
different temperatures, corresponding to a half-time
life equal to 0.1, 1 and 10 hours respectively. It is
implicitly assumed that the reaction describing
peroxide decomposition is of first order and that the
single kinetic constant associated to such a reaction
follows and Arrhenius law. It is very straightforward
the deduction of the numerical values of the
constants at the three temperatures considered, from
the experimental knowledge of the half time life
2/1
t
, being simply
2/1
2ln tK
i
. No information is
available for M2, which is indeed a mixture of
peroxides.
Since in our numerical model, first and second
reactions occur in series, and the first reaction
produces 2
R
radicals, the comparison with the
simplified practical approach above discussed, may
be attempted considering the weighted average
between constants
1
K
and
2
K
, i.e. plotting the
straight line 1/3*(2 log
1
K
+log
2
K
), again deduced
from present numerical results and represented with
a dash-dot line in Figure 13-b and Figure13-c for
Perkadox BC-FF and Perkadox 14S-FL respectively.
In the same figures, data deduced from commercial
catalogues provided by Akzo Nobel (2012) are
represented with circles. As it is possible to notice,
the agreement is almost perfect, meaning that the
predictivity of the numerical procedure here
presented is very promising.
3 CONCLUSIONS
In the present Part II, the numerical model proposed
in Part I has been validated using the huge amount
of experimental data obtained by the authors, in
presence of three different curing agents with
different concentrations at three increasing
temperatures. The numerical model provides partial
reactions kinetic constants, which are very useful in
practice to determine the optimal industrial input
parameters to use (as for instance vulcanization
temperature and curing time) to obtain the maximum
mechanical properties of the vulcanized items. A
comparison with simplified approaches based on a
single first order kinetic equation shows that very
reasonable results are obtained and, at the same
time, demonstrates that the model proposed
supersedes the classic limitations of the simplistic
procedures commonly used, especially in presence
of reversion or when a mixture of peroxides is
utilized. An interesting correlation between tensile
strength and maximum torques has been also
obtained.
The traditional methods used by producers to
choose the most suitable production parameters, as
for instance a-priori strategies (essentially based on
the rheometer curves) or a-posteriori considerations
(direct tensile tests on the vulcanized rubber) could
be potentially avoided and superseded, after a
careful calibration of the mathematical approach
proposed, with an undoubted advantage in terms of
SIMULTECH2013-3rdInternationalConferenceonSimulationandModelingMethodologies,Technologiesand
Applications
72

time and cost savings. The approach proposed,
finally, may push the research forward when dealing
with the preparation of new rubber compounds and
vulcanization agents, once that a specific output
parameter is considered as target to optimize at the
end of the vulcanization process.
REFERENCES
AkzoNobel (2012). Brochure of organic peroxides,
available at http://www.akzonobel.com/polymer/
Hofmann, W., 1989. Rubber Technology Handbook,
Hanser Publishers, Munich.
Milani, G., Galanti, A., Cardelli, C., Milani, F., 2013.
Peroxide cross-linking of EPDM for medium voltage
cable applications: experimental insight. In: Proc.
183rd Technical Meeting Akron, Ohio Monday, April
22, 2013 - Wednesday, April 24, 2013
Milani, G., Milani, F., 2010. Journal of Mathematical
Chemistry 47(1): 229-267.
Milani, G., Milani, F., 2011. Journal of Mathematical
Chemistry, 48: 530–557.
Milani, G., Milani, F., 2012a. Computers & Chemical
Engineering, 43: 173–190.
Milani, G., Milani, F., 2012b. Journal of Applied Polymer
Science, 124(1): 311–324.
Milani, G., Milani, F., 2013a. Differential model
accounting for reversion for EPDM vulcanized with
peroxides. Journal of Mathematical Chemisty, In
press.
Milani, G., Milani, F., 2013b. Polymer Engineering and
Science, 53 (2): 353-369.
NumericalModelforthePredictionofFinalMechanicalPropertiesofEPDMVulcanizedwithPeroxides-PartIIResults
73
