
Using Expert-based Bayesian Networks as Decision Support Systems
to Improve Project Management of Healthcare Software Projects
Emilia Mendes
Software Engineering Research Laboratory, Blekinge Institute of Technology, Karlskrona, Sweden
Keywords: Software Project Management, Effort Estimation, Decision Support System, Bayesian Networks,
Uncertainty, Process Improvement, Cost Estimation, Web Systems.
Abstract: One of the pillars for sound Software Project Management is reliable effort estimation. Therefore it is
important to fully identify what are the fundamental factors that affect an effort estimate for a new project
and how these factors are inter-related. This paper describes a case study where a Bayesian Network model
to estimate effort for healthcare software projects was built. This model was solely elicited from expert
knowledge, with the participation of seven project managers, and was validated using data from 22 past
finished projects. The model led to numerous changes in process and also in business. The company adapted
their existing effort estimation process to be in line with the model that was created, and the use of a
mathematically-based model also led to an increase in the number of projects being delegated to this
company by other company branches worldwide.
1 INTRODUCTION
Effort estimation, the process by which effort is
forecasted and used as basis to predict costs and to
allocate resources effectively, is one of the main
pillars of sound project management, given that its
accuracy can affect significantly whether projects
will be delivered on time and within budget (Fenton
et al., 2004). However, because it is a complex
domain where corresponding decisions and
predictions require reasoning with uncertainty, there
are countless examples of companies that
underestimate effort. Jørgensen and Grimstad (2009)
reported that such estimation error can be of 30%-
40% on average, thus leading to serious project
management problems.
There is a large body of knowledge in software
effort estimation (Jorgensen and Shepperd, 2007),
and Web-development effort estimation (Azhar et
al., 2012). Most of those studies focused on solving
companies’ inaccurate effort predictions via
investigating techniques that are used to build formal
effort estimation models, in the hope that such
formalization will improve the accuracy of
estimates. They do so by assessing, and often also
comparing, the prediction accuracy obtained from
applying numerous statistical and artificial
intelligence techniques to datasets of completed
projects developed by industry, and sometimes also
developed by students.
The variables characterizing such datasets are
determined in different ways, such as via surveys
(Mendes et al., 2005), interviews with experts (Ruhe
et al., 2003), expertise from companies (Ferrucci et
al., 2008), a combination of research findings
(Mendes et al. 2001), or even a researcher’s own
consulting experience (Reifer, 2000). In all of these
instances, once variables are defined, a data
gathering exercise takes place, obtaining data
(ideally) from industrial projects volunteered by
companies. However, in addition to eliciting the
important effort predictors (and optionally also their
relationships), such mechanism does not provide the
means to also quantify the uncertainty associated
with these relationships and to validate the
knowledge obtained. Why should these be
important?
Research on effort estimation models built using
a technique that incorporates the uncertainty
inherent in this domain has shown very promising
results relating to improved decision making for
project management. This technique is called
Bayesian Networks (BNs), and has also been
employed successfully in a wide range of other
domains (e.g. Pollino et al., 2007); Korb and
Nicholson (2004)). Some of the models described in
389
Mendes E..
Using Expert-based Bayesian Networks as Decision Support Systems to Improve Project Management of Healthcare Software Projects .
DOI: 10.5220/0004434103890399
In Proceedings of the 8th International Joint Conference on Software Technologies (ICSOFT-EA-2013), pages 389-399
ISBN: 978-989-8565-68-6
Copyright
c
2013 SCITEPRESS (Science and Technology Publications, Lda.)
those studies were built automatically from existing
datasets on software or Web-development projects
(e.g. Nauman and Lali, 2012); Mendes and Mosley
(2008)); however, some other models in that
literature were built using a structured iterative
process in which factors and relationships were
identified, quantified and validated (e.g. Mendes et
al., 2009) through a process of knowledge creation
(Nonaka and Toyama, 2003), where experts’ tacit
knowledge relating to effort estimation was
explicitated (thus leading to models that mirror their
mental models), and later internalized (tacit
knowledge is modified due to the use of the models)
by those employing these models for decision
making, in order to obtain effort estimates for
projects.
The goal of this paper, and hence its
contribution, is to detail a case study in which the
process of knowledge creation abovementioned was
used to build an effort estimation BN model within a
domain that had not been previously investigated in
the software and Web-development literature
(Jorgensen and Shepperd, 2007); (Azhar et al., 2012)
– that of healthcare software project management.
This model was built for one of the branches of a
large Japanese healthcare software provider, with the
participation of seven project managers.
Post-mortem interviews with the participating
company showed that the understanding it gained by
being actively engaged in building the models led to
both improved estimates and project management
decision making.
The remainder of this paper is structured as
follows: Section 2 provides an overview of BNs,
followed by the description, in Section 3, of the
general process used to build and validate BNs.
Section 4 details this process within the context of
the model described herein, followed by a discussion
of the results in Section 5, and finally conclusions in
Section 6.
2 INTRODUCTION
TO BAYESIAN NETWORKS
A Bayesian Network (BN) is a model that supports
reasoning with uncertainty due to the way in which
it incorporates existing knowledge of a complex
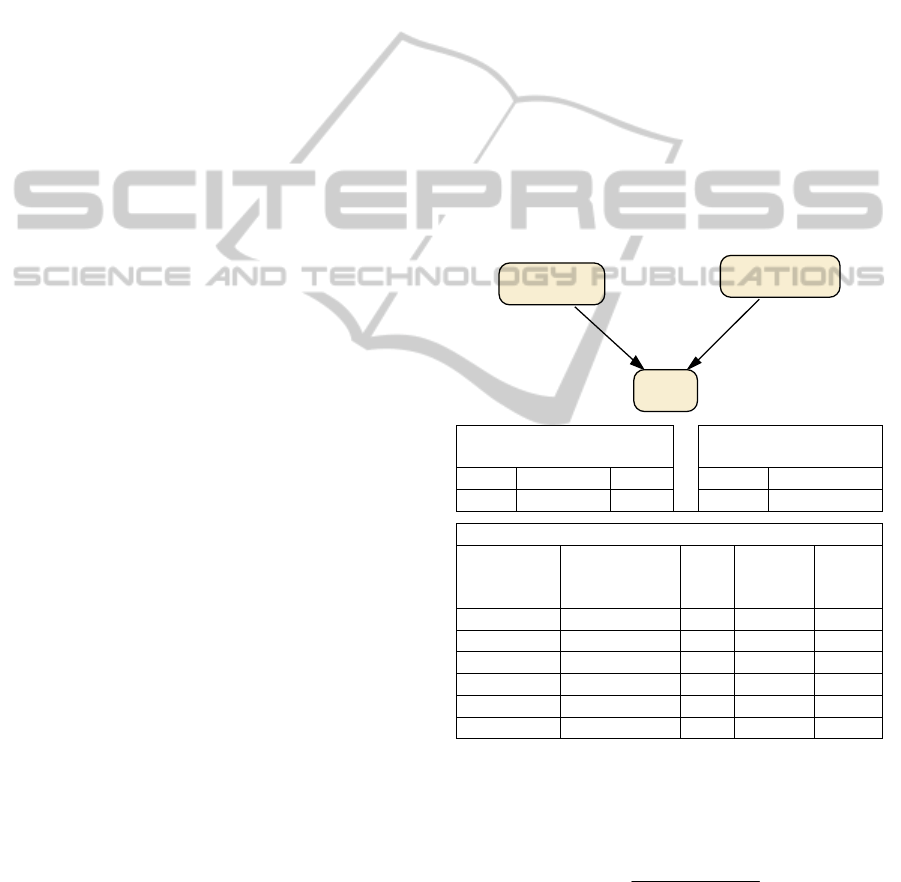
domain (Pearl, 1988). This knowledge is represented
using two parts. The first, the qualitative part,
represents the structure of a BN as depicted by a
directed acyclic graph (digraph) (see Figure 1). The
digraph’s nodes represent the relevant variables
(factors) in the domain being modeled, which can be
of different types (e.g. observable or latent,
categorical). The digraph’s arcs represent the causal
relationships between variables, where relationships
are quantified probabilistically (Pearl, 1988).
The second, the quantitative part, associates a
conditional probability table (CPT) to each node, its
probability distribution. A parent node’s CPT
describes the relative probability of each state
(value) (Figure 1, nodes ‘Pages complexity’ and
‘Functionality complexity’); a child node’s CPT
describes the relative probability of each state
conditional on every combination of states of its
parents (Figure 1, node ‘Total Effort’). So, for
example, the relative probability of ‘Total Effort’
being ‘Low’ conditional on ‘Pages complexity’ and
‘Functionality complexity’ being both ‘Low’ is 0.7.
Each row in a CPT represents a conditional
probability distribution and therefore its values sum
up to 1 (Pearl, 1988).
Pages complexity
Functionality
complexity
Low Medium High Low High
0.2 0.3 0.5 0.1 0.9
Total Effort (Low, Medium, High)
Pages
complexit
y
Functionalit
y complexity
Low
Mediu
m
High
Low Low 0.7 0.2 0.1
Low High 0.2 0.6 0.2
Medium Low 0.1 0.7 0.2
Medium High 0 0.5 0.5
High Low 0.2 0.6 0.2
High High 0 0.1 0.9
Figure 1: Example of a BN and three CPTs.
Formally, the posterior distribution of the Bayesian
Network is based on Bayes’ rule (Pearl, 1998):
)(
)()|(
)|(
Ep
XpXEp
EXp
(1)
where:
)|( EXp is called the posterior distribution and
represents the probability of X given evidence E;
Pages
complexity
Functionality
complexity
Total
Effort
ICSOFT2013-8thInternationalJointConferenceonSoftwareTechnologies
390
)(Xp is called the prior distribution and
represents the probability of X before evidence E is
given;
)|( XEp is called the likelihood function and
denotes the probability of E assuming X is true.
Once a BN is specified, evidence (e.g. values) can
be entered into any node, and probabilities for the
remaining nodes automatically calculated using
Bayes’ rule (Pearl, 1988). Therefore BNs can be
used for different types of reasoning, such as
predictive, diagnostic, and “what-if” analyses to
investigate the impact that changes on some nodes
have on others.
3 ADAPTED KNOWLEDGE
ENGINEERING OF BAYESIAN
NETWORKS PROCESS
The BN model presented herein was built and
validated using the adapted Knowledge Engineering
of Bayesian Networks (KEBN) process (Mendes and
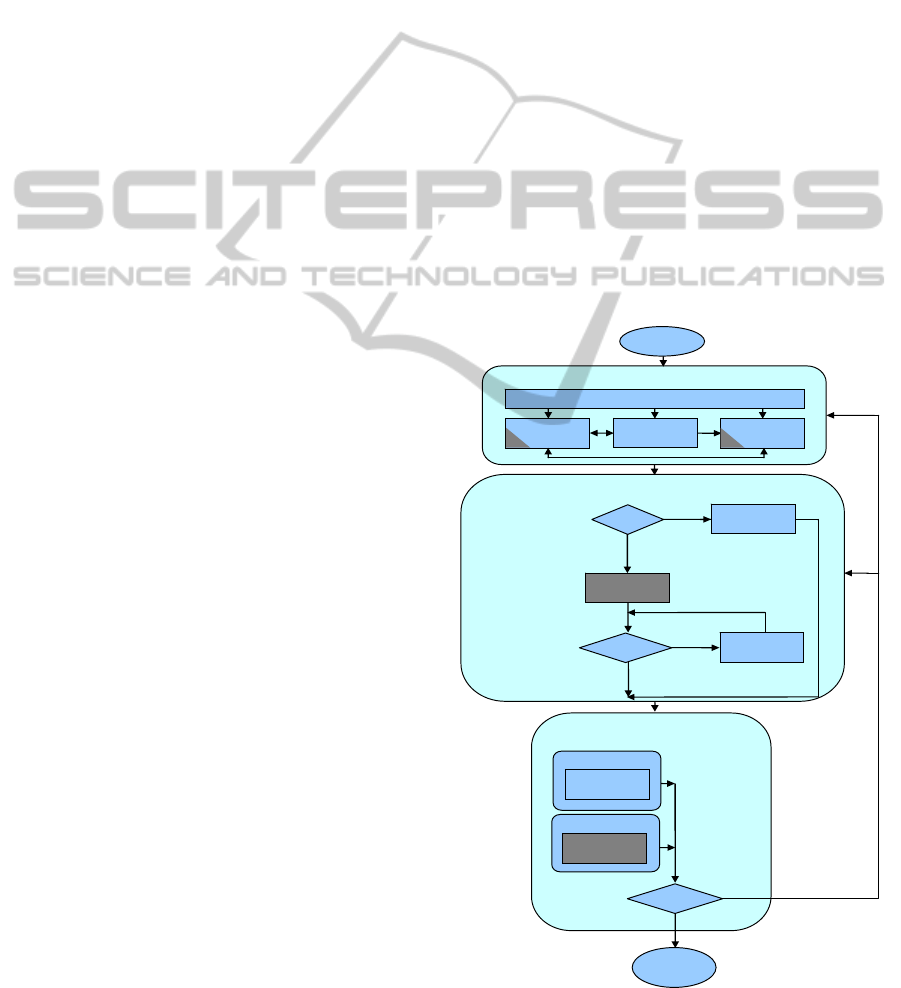
Mosley, 2008) (see Figure 2). In Figure 2 arrows
represent flows through the different processes,
depicted by rectangles. The three main steps within
the adapted KEBN process are the Structural
Development, Parameter Estimation, and Model
Validation. This process iterates over these steps
until a complete BN is built and validated. Each of
these three steps is detailed in the next Sub-sections.
3.1 Structural Development
The Structural Development step represents the
qualitative component of a BN, which results in a
graphical structure comprised of, in our case, the
factors (nodes, variables) and causal relationships
identified as fundamental for effort estimation of
healthcare software projects. In addition to
identifying variables, their types (e.g. query variable,
evidence variable) and causal relationships, this step
also comprises the identification of the states
(values) that each variable should take. The BN’s
structure is refined through an iterative process. This
structure construction process has been validated in
previous studies (Druzdel and van der Gaag, 2000)
and uses the principles of problem solving employed
in data modelling and software development (Studer
et al., 1998). As will be detailed later, existing
literature in effort estimation, and knowledge from
the domain experts were employed to elicit the
Healthcare software effort BN’s structure.
Throughout this step the author also evaluated the
BN’s structure to check whether variables and their
values have a clear meaning; all relevant variables
have been included; variables are named
conveniently; all states are appropriate (exhaustive
and exclusive). The BN structure may also need to
be optimised to reduce the number of probabilities
that need to be elicited or learnt for the network.
Whenever this is the case, techniques that change the
causal structure (e.g. divorcing (Jensen, 1996)) are
employed.
3.2 Parameter Estimation
The Parameter estimation step represents the
quantitative component of a BN, where conditional
probabilities corresponding to the quantification of
the relationships between variables (Jensen, 1996)
are obtained. Such probabilities can be attained via
Expert Elicitation, automatically from data, from
existing literature, or using a combination of these.
When probabilities are elicited from scratch, or even
if they only need to be revisited, this step can be
very time consuming. In order to minimise the
number of probabilities to be elicited some
techniques have been proposed in the literature
Figure 2: Adapted KEBNs process (Mendes et al., 2009).
Structural Development
Model Validation
Parameter Estimation
Identify
nodes/vars
Identify
values/states
Identify
relationships
Evaluation
Y
es
No
Y
es
Data?
Further
Elicitation
No
No
Next
Sta
g
e
Y
es
Accept?
Begin
Domain expert
Model
Walkthrough
Data-driven
Predictive
Accuracy
A
ccept?
Expert
Elicitation
A
utomated
Learning
UsingExpert-basedBayesianNetworksasDecisionSupportSystemstoImproveProjectManagementofHealthcare
SoftwareProjects
391

(Druzdel and van der Gaag, 2000) (Tang McCabe,
2007).
3.3 Model Validation
The Model validation step validates the BN that
results from the two previous steps, and determines
whether it is necessary to re-visit any of those steps.
Two different validation methods are generally used
- Model Walkthrough and Predictive Accuracy.
Model walkthrough represents the use of real
case scenarios that are prepared and used by domain
experts to assess if the predictions provided by the
BN model correspond to the predictions experts
would have chosen based on their own expertise.
Success is measured as the frequency with which the
BN’s predicted value for a target variable (e.g.
quality, effort) that has the highest probability
corresponds to the experts’ own assessment.
Predictive Accuracy uses past data (e.g. past
project data), rather than scenarios, to obtain
predictions. Data (evidence) is entered on the BN
model, and success is measured as the frequency
with which the BN’s predicted value for a target
variable (e.g. quality, effort) that has the highest
probability corresponds to the actual past data.
4 PROCESS USED TO BUILD
THE BN MODEL
Here in we revisit the adapted KEBN process (see
Figure 2), detailing the tasks carried out for each of
the three main steps, within the context of the effort
estimation BN model for healthcare projects that is
the focus of this paper. Before starting the elicitation
of the model, the seven project managers
participating in the model elicitation & validation
were given an overview of BNs, and examples of
“what-if” scenarios using a made-up BN. This, we
believe, facilitated the entire process as the use of an
example, and the brief explanation of each of the
steps in the adapted KEBN process, provided a
concrete understanding of what to expect. We also
made it clear that the author was solely a facilitator
of the process, and that the Healthcare company’s
commitment was paramount for the success of the
process.
The entire process took 324 person hours to be
completed, with seven projet managers participating
at 12 3-hour slots, and two other project managers
participating at other 12 3-hour slots.
The company for which the model was created,
located in the Pacific Rim region, represents one of
the several branches worldwide that are part of a
larger Healthcare organization, which headquarters
in Japan. The company had ~100 employees. The
project managers had each worked in Healthcare
software development for more than 10 years. In
addition, this company developed a wide range of
Healthcare software applications, using different
types of technology.
4.1 Detailed Structural Development &
Parameter Estimation
In order to identify the fundamental factors that the
project managers considered when preparing a
project quote, and also taking into account that most
of the projects managed were Web-development
projects, we used, as suggested in (Mendes et al.,
2009), the set of variables from the Tukutuku dataset
(Mendes et al., 2005) as a starting point (see Table
1). We first sketched them out on a white board,
each one inside an oval shape, and then explained
what each one meant.
Once the Tukutuku variables had been sketched
out and explained, the next step was to remove all
variables that were not relevant for the project
managers, followed by adding to the white board
any additional variables (factors) suggested by them.
We also documented descriptions for each of the
factors suggested. Next, we identified the states that
each factor would take. All states were discrete.
Whenever a factor represented a measure of effort
(e.g. Total effort), we also documented the effort
range corresponding to each state, to avoid any
future ambiguity. For example, ‘very low’ Total
effort corresponded to 4+ to 10 person hours, etc.
Once all states were identified and documented, it
was time to elicit the cause and effect relationships.
As a starting point to this task we used the same
example used in (Mendes et al., 2009) - a simple
medical example from (Jensen, 1996) (see Figure 3).
This example clearly introduces one of the most
important points to consider when identifying cause
and effect relationships – timeline of events. If
smoking is to be a cause of lung cancer, it is
important that the cause precedes the effect. This
may sound obvious with regard to the example used;
however, it is our view that the use of this simple
example significantly helped the project managers
understand the notion of cause and effect, and how
this related to software effort estimation and the BN
being elicited.
ICSOFT2013-8thInternationalJointConferenceonSoftwareTechnologies
392

Table 1: The Tukutuku variables (Mendes et al. 2005).
Variable Name Description
Project Data
TypeProj
Type of project (new or enhancement).
nLan
g
N
umber of different development lan
g
ua
g
es use
d
DocProc If project followed defined and documented process.
ProImp
r
If pro
j
ect team involved in a process improvement pro
g
ramme.
M
etrics If pro
j
ect team part of a software metrics pro
g
ramme.
DevTeam Size of a project’s development team.
TeamExp Avera
g
e team experience with the development lan
g
ua
g
e(s) emplo
y
ed.
Web application
TotWP Total number of Web pages (new and reused).
NewW
P
Total number of new Web pa
g
es.
TotIm
g
Total number of images (new and reused).
NewIm
g
Total number of new ima
g
es created.
Num
_
Fots
N
umber of features reused without an
y
adaptation.
H
FotsA
N
umber of reused high-effort features/functions adapted.
H
ne
w
N
umber of new hi
g
h-effort features/functions.
TotHi
g
h Total number of hi
g
h-effort features/functions
Num_FotsA
N
umber of reused low-effort features adapted.
New
N
umber of new low-effort features/functions.
TotNHi
g
h Total number of low-effort features/functions
Figure 3: A simple medical example from (Jensen, 1996).
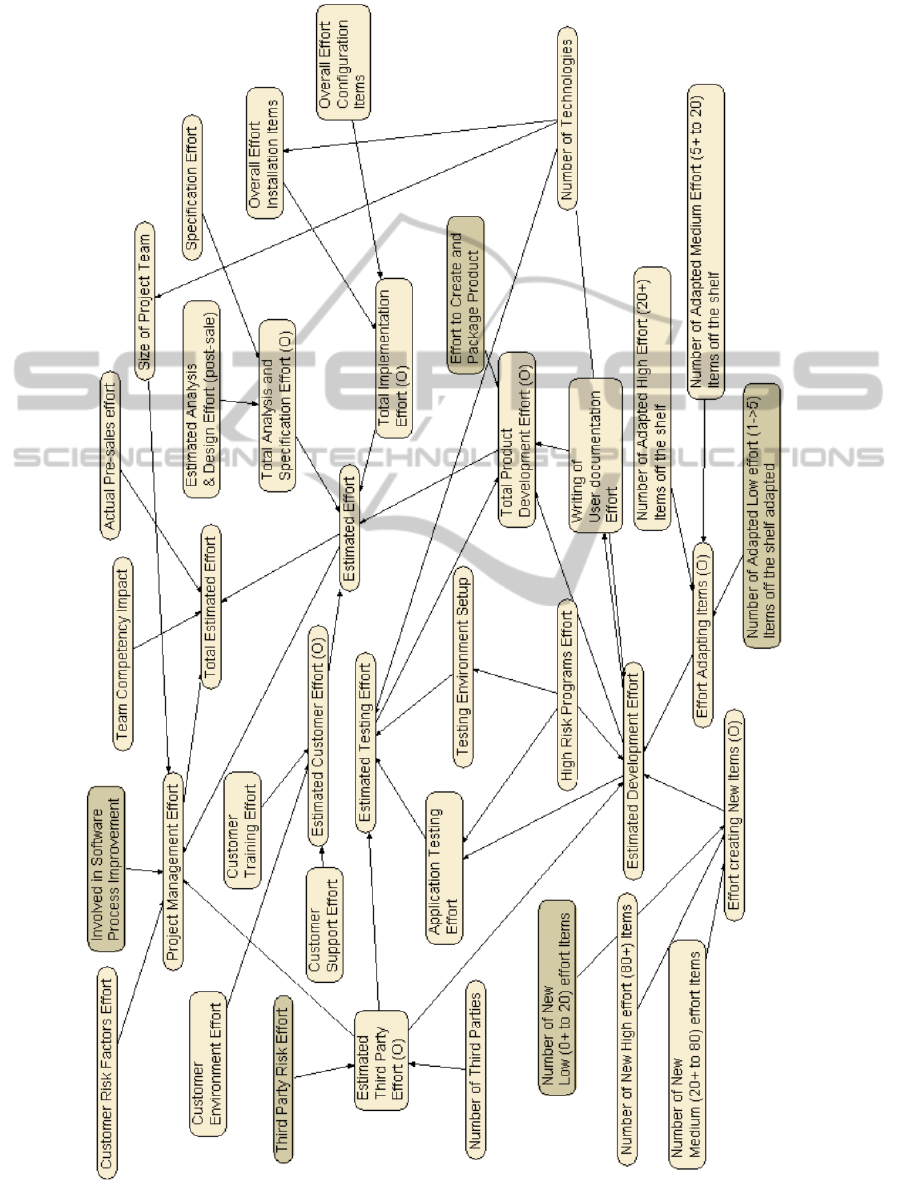
Once the cause and effect relationships were
identified the Healthcare software effort & risk BN’s
causal structure was as follows (see Figure 4). Note
that Figure 4 is not a BN based directly on Table 1.
At this point the project managers seemed happy
with the BN’s causal structure and the work on
eliciting the probabilities was initiated. All
probabilities were created from scratch, and the
probabilities elicitation took 72 hours (one project
manager and the author). The complete BN,
including its probabilities, is shown in Figure 5.
Figure 5 shows the BN using belief bars rather than
labelled factors, so readers can see the probabilities
that were elicited.
4.2 Detailed Model Validation
Both Model walkthrough and Predictive accuracy
were used to validate the Effort Prediction BN
model, where the former was the first type of
validation to be employed. The project manager
used ten different scenarios to check whether the
factor Total_effort would provide the highest
probability to the effort state that corresponded to
the manager’s own suggestions. All scenarios were
run successfully; however it was also necessary to
use data from past projects, for which total effort
was known, in order to check whether the model
needed any further calibration. A validation set
containing data on 22 projects was used. The project
manager selected a range of projects presenting
different sizes and levels of complexity, where all 22
projects were representative of the types and sizes of
projects developed by the Healthcare Company.
For each project, evidence was entered in the BN
model (an example is given in Figure 6, where
evidence is characterised by dark grey nodes with
probabilities equal to 100% (1…)), and the effort
range corresponding to the highest probability
provided for ‘Total Estimated Effort’ was compared
to that project’s actual effort.
The company had also defined the range of effort
values associated with each of the categories used to
measure ‘Total Estimated Effort’. In the case of the
company described herein, High effort corresponded
to 150 to 1500 person hours. Whenever actual effort
did not fall within the effort range associated with
the category with the highest probability, there was a
mismatch; this meant that some probabilities needed
to be adjusted. In order to know which nodes to
target first we used a Sensitivity Analysis report,
which provided the effect of each parent node upon
a given query node. Within our context, the query
node was ‘Total Estimated Effort’. Within the
UsingExpert-basedBayesianNetworksasDecisionSupportSystemstoImproveProjectManagementofHealthcare
SoftwareProjects
393

context of this work, hardly any calibration was
needed.
Whenever probabilities were adjusted, we re-
entered the evidence for each of the projects in the
validation set that had already been used in the
validation step to ensure that the calibration already
carried out had not affected. This was done to ensure
that each calibration would always be an improved
upon the previous one. Within the scope of the
model presented herein, of the 22 projects used for
validation, only one required the model to be re-
calibrated. This means that for all the 21 projects
remaining, the BN model presented the highest
probability to the effort range that contained the
actual effort for the project being used for validation.
Once all 22 projects were used to validate the model
the project manager assumed that the Validation step
was complete.
5 DISCUSSION
In terms of the use of this BN model, it can also be
employed for diagnostic reasoning, and to run
numerous “what-if” scenarios. Figure 7 shows an
example of a model being used for diagnostic
reasoning, where the evidence was entered for Total
Estimated Effort, and used to assess the highest
probabilities for each of the other factors.
Six months after the completion of the BN
model, the author participated in a post-mortem
interview with the company’s project managers. The
changes that took place as the result of developing
the BN model were as follows:
- The model was explained to the entire software
development group and all the estimations
provided by any team member (e.g. developers,
managers) had to be based on the factors that were
part of the BN model. This means that the entire
team started to use the factors that have been
elicited, as well as the BN model, as basis for
decision making during their effort estimation
sessions.
- Initially, project managers estimated effort using
both subjective means and also the BN model. If
there were differences between estimates, they
would discuss and reach a consensus on which
estimate to use. Later both estimates were
compared to the actual effort once projects were
completed. However, in less than 6 months from
using the BN model, managers moved to using the
model-based estimates only.
Finally, as a consequence from using this model, this
company branch started to increase the number of
requests from other branches for software
development projects. This occurred when one of
the project managers presented the model at a
meeting with other company branches, so to detail
how their branch was estimating effort for their
healthcare projects.
Overall, such change in approach provided
extremely beneficial to the company.
We believe that the successful development of
this Effort estimation BN model was greatly
influenced by a number of factors, such as:
- The company’s commitment to providing their
time and expertise.
- The use of a process where project managers’
participation was fundamental. This approach was
seen as extremely positive by the company as they
could implicitly understand the value from
building a model that was totally geared towards
their needs.
- The project managers’ excellent experience in
managing healthcare software projects.
6 CONCLUSIONS
This paper has presented a case study where a
Bayesian Model for effort estimation of Healthcare
projects was built using solely knowledge of seven
Domain Experts from a well-established Healthcare
company in the Pacific Rim. This model was
developed using an adaptation of the knowledge
engineering for Bayesian Networks process (see
Figure 2). Each session with the project managers
lasted for no longer than 3 hours. The final BN
model was calibrated using data on 22 past projects.
These projects represented typical projects
developed by the company, and believed by the
experts to provide enough data for model
calibration.
Since the model’s adoption, it has been
successfully used to provide effort quotes for the
new projects managed by the company.
The entire process used to build and validate the
BN model took 324 person hours.
As part of our future work, we plan to compare
our model to that from other related research using
BNs within the context of software effort estimation.
ACKNOWLEDGEMENTS
We would like to thank the project managers who
participated in the elicitation and validation of this
model. This work is part of the BESQ+ research
ICSOFT2013-8thInternationalJointConferenceonSoftwareTechnologies
394

project funded by the Knowledge Foundation (grant:
20100311) in Sweden.
REFERENCES
Azhar, D., Mendes, E., and Riddle, P. 2012. A Systematic
Review of Web Resource Estimation, Proceedings of
Promise’12.
Druzdzel, M. J., & van der Gaag, L. C. (2000). Building
Probabilistic Networks: Where Do the Numbers Come
From?. IEEE Trans. on Knowledge and Data
Engineering, 12(4), 481-486.
Jensen, F. V. (1996). An introduction to Bayesian
networks. UCL Press, London.
Fenton, N., Marsh, W., Neil, M., Cates, P., Forey, S., and
Tailor, M. 2004: Making Resource Decisions for
Software Projects, Proc. ICSE’04, pp. 397-406.
Ferrucci, F. Gravino, C., Di Martino, S. 2008, A Case
Study Using Web Objects and COSMIC for Effort
Estimation of Web Applications. EUROMICRO-
SEAA, p. 441-448.
Korb, K. B., and Nicholson, A. E. 2004, Bayesian
Artificial Intelligence, CRC Press, USA.
Jørgensen, M., and Grimstad, S. 2009. Software
Development Effort Estimation: Demystifying and
Improving Expert Estimation, In: Simula Research
Laboratory - by thinking constantly about it, ed. by
Aslak Tveito, Are Magnus Bruaset, Olav Lysne.
Springer, Heidelberg, chap. 26, pp. 381-404. (ISBN:
978-3642011559).
Jorgensen, M. and Shepperd, M. 2007. A systematic
review of software development cost estimation
studies, IEEE Trans. Softw. Eng., vol. 33, no. 1, pp.
33–53.
Mendes, E., and Mosley, N., 2008, Bayesian Network
Models for Web Effort Prediction: a Comparative
Study, Transactions on Software Engineering, Vol. 34,
Issue: 6, Nov/Dec 2008, pp. 723-737.
Mendes, E., Mosley, N., and Counsell, S. 2001. Web
metrics - Metrics for estimating effort to design and
author Web applications. IEEE MultiMedia, January-
March, 50-57.
Mendes, E., Mosley, N. and Counsell, S. 2005. The Need
for Web Engineering: an Introduction, Web
Engineering, Springer-Verlag, Eds: E. Mendes, N.
Mosley, pp. 1-26, ISBN 3-540-281 96-7.
Mendes, E., Polino, C., and Mosley, N. 2009, Building an
Expert-based Web Effort Estimation Model using
Bayesian Networks, 13th International Conference on
Evaluation & Assessment in Software Engineering.
Nauman, A. B., and Lali, M. I., 2012, Productivity
Inference with Dynamic Bayesian Models in Software
Development Projects, International Journal of
Computer and Electronics, 1(2), 50-57.
Nonaka, I., Toyama, R. 2003. The knowledge-creating
theory revisited: knowledge creation as a synthesizing
process. Knowledge Management Research &
Practice, 1:2-10.
Pearl J. 1988. Probabilistic Reasoning in Intelligent
Systems, Morgan Kaufmann, San Mateo, CA.
Pollino, C., White, A., and Hart, B.T., 2007, Development
and application of a Bayesian decision support tool to
assist in the management of an endangered species.
Ecological Modelling 201, 37-59.
Studer, R., Benjamins, V.R., & Fensel, D. 1998.
Knowledge engineering: principles and methods. Data
& Knowledge Engineering, 25, 161-197.
Tang, Z., & McCabe, B. 2007. Developing Complete
Conditional Probability Tables from Fractional Data
for Bayesian Belief Networks, Journal of Computing
in Civil Engineering, 21(4), 265-276.
Reifer, D. J. 2000, Web Development: Estimating Quick-
to-Market Software, IEEE Software, Nov.-Dec., 57-
64.
Ruhe, M., Jeffery, R., and Wieczorek., I. 2003, Cost
estimation for Web applications, Proceedings ICSE
2003, 285-294, 2003.
Woodberry, O., Nicholson, A., Korb, K., & Pollino, C.
2004. Parameterising Bayesian Networks. Proceedings
of the Australian Conference on Artificial Intelligence
(pp. 1101-1107).
UsingExpert-basedBayesianNetworksasDecisionSupportSystemstoImproveProjectManagementofHealthcare
SoftwareProjects
395
APPENDIX
Figure 4: BN model’s Causal Structure.
ICSOFT2013-8thInternationalJointConferenceonSoftwareTechnologies
396
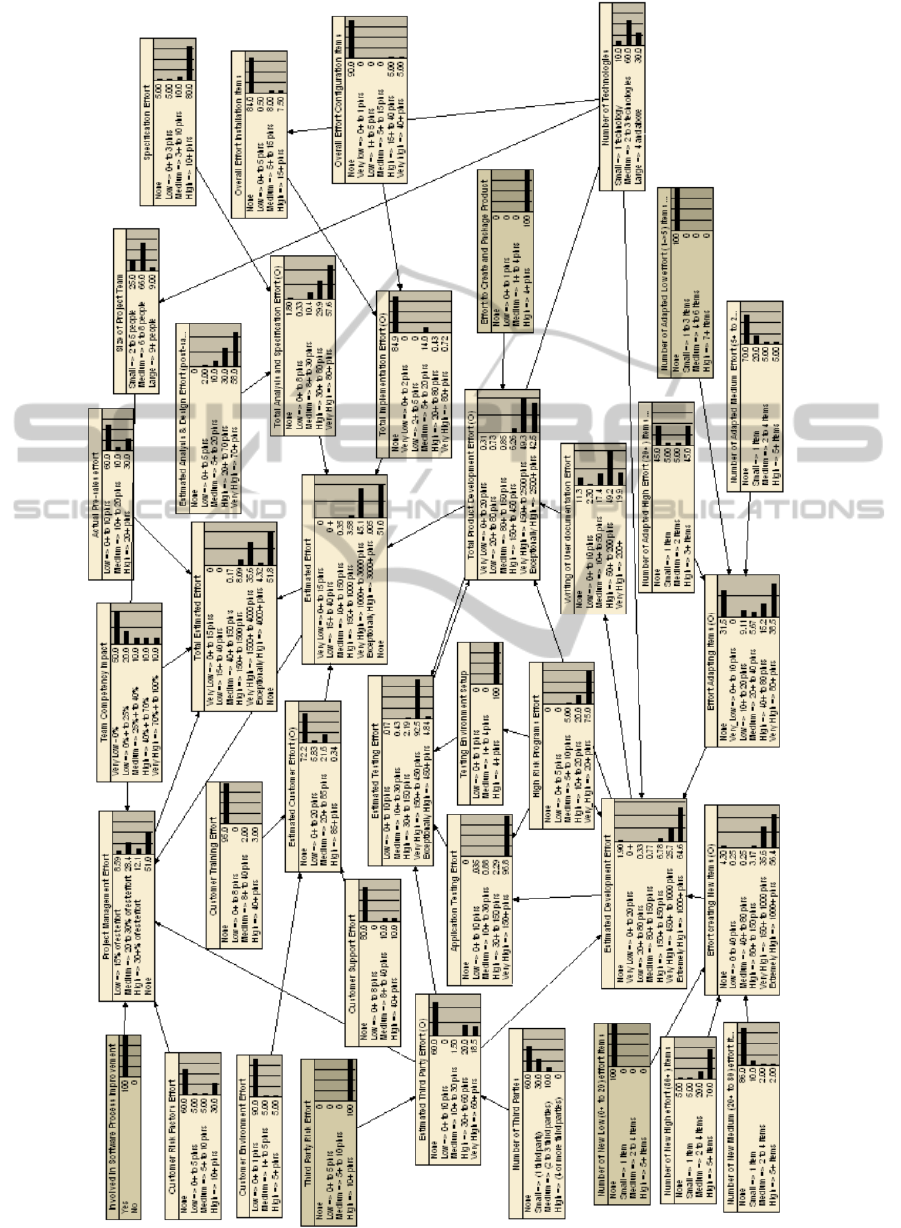
Figure 5: Effort estimation BN model for Healthcare software development.
UsingExpert-basedBayesianNetworksasDecisionSupportSystemstoImproveProjectManagementofHealthcare
SoftwareProjects
397
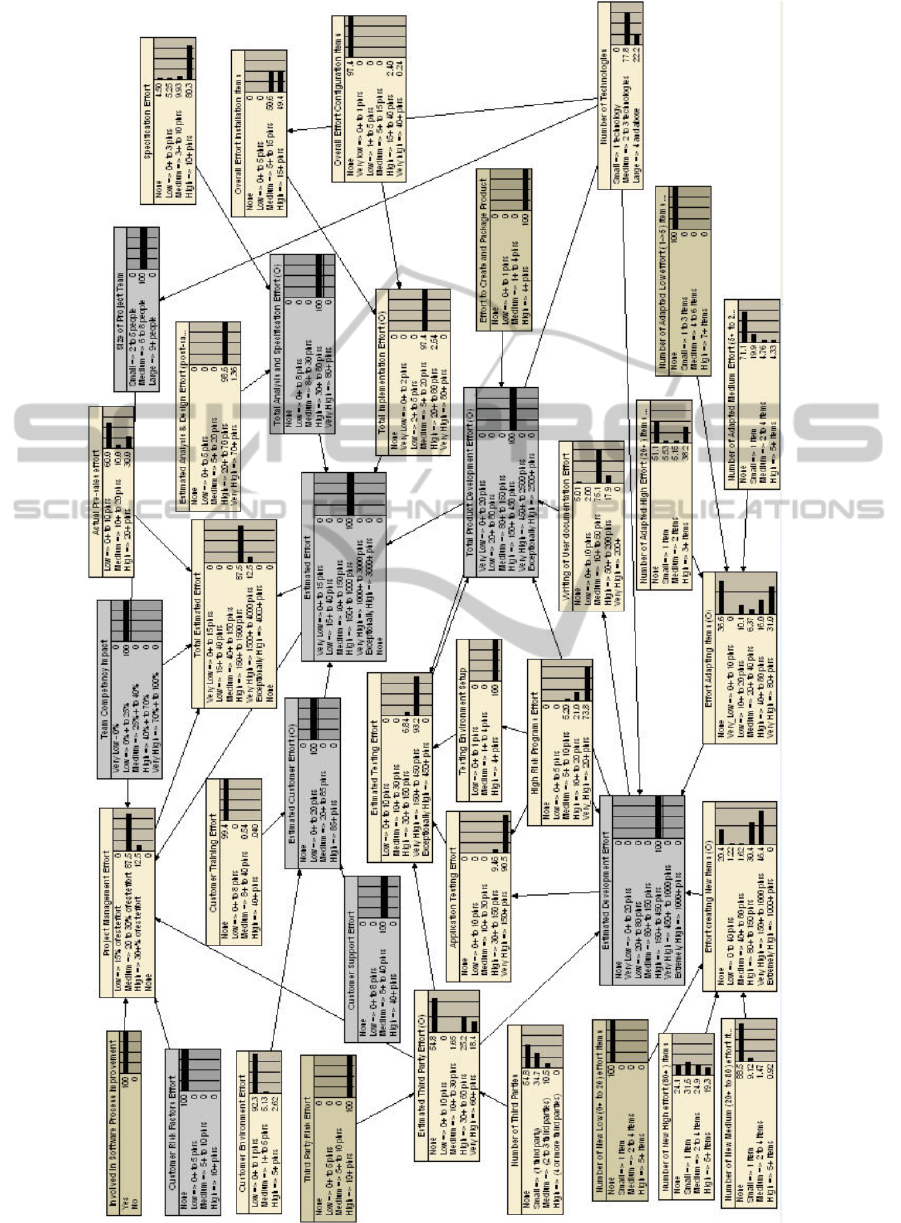
Figure 6: Entering evidence in order to predict effort
ICSOFT2013-8thInternationalJointConferenceonSoftwareTechnologies
398
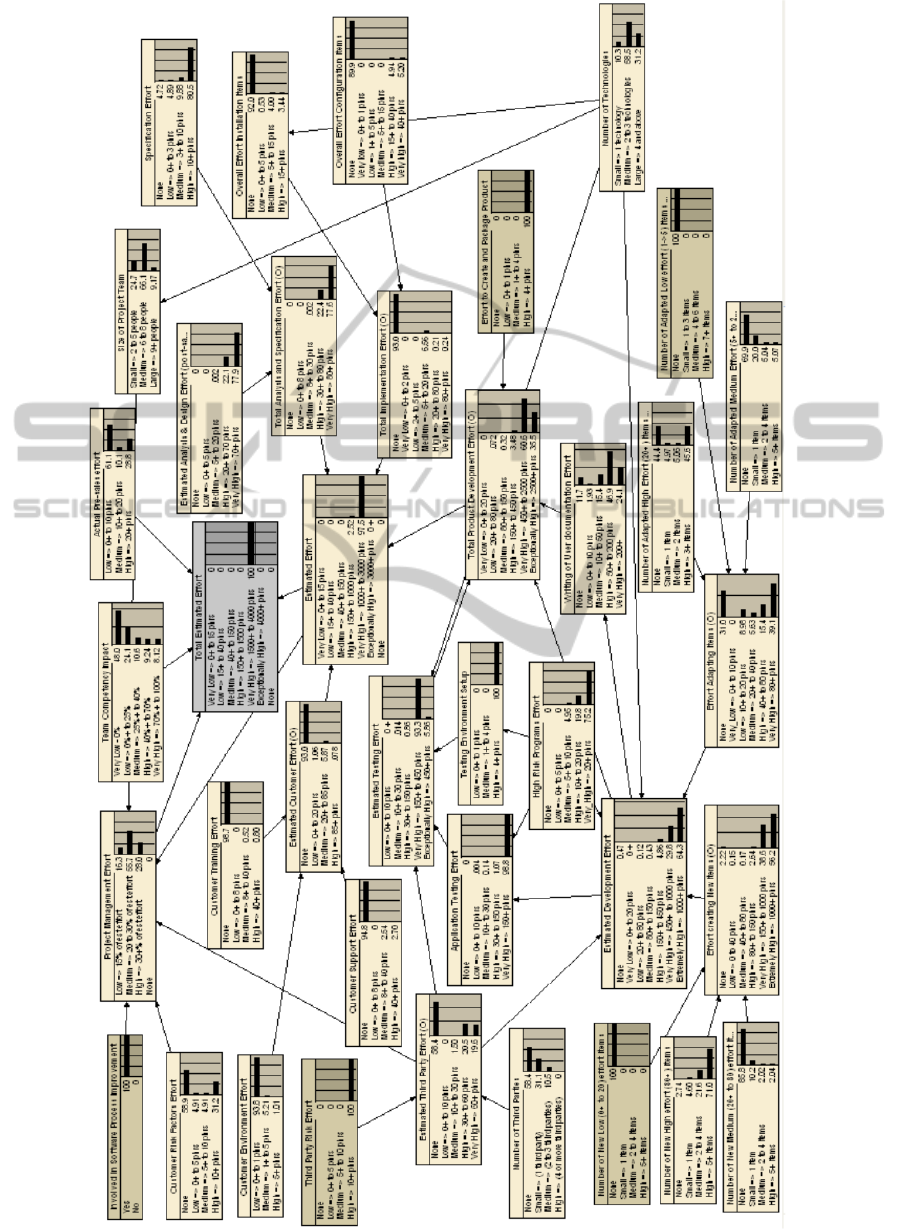
Figure 7: Diagnostic Reasoning.
UsingExpert-basedBayesianNetworksasDecisionSupportSystemstoImproveProjectManagementofHealthcare
SoftwareProjects
399
