
Visualizing ERP Usage Logs in Real Time
Wendy Lucas, Jennifer Xu and Tamara Babaian
Bentley University, 175 Forest Street, Waltham, MA 02452, U.S.A.
Keywords: Process Visualization, Usage Event Logs, ERP System Usability.
Abstract: We present a prototype system that visualizes business process models extracted from usage logs for
providing support to Enterprise Resource Planning (ERP) system users in real time. While process mining
and visualization techniques are commonly applied to off-line data analytics and process management, far
less attention has been focused on how they can be applied in real time to assisting users of complex system
interfaces. The approach described in this paper demonstrates the application of interactive visualizations to
providing ERP system users with process-, task-, and context-related information during active system use.
Such information is vital to the users’ understanding of the supported processes and affects their ability to
make the most effective use of the system, yet it is typically hidden behind opaque interfaces. Dynamically-
generated interactive process visualizations that draw on data captured to usage logs are one way to open a
much needed window for ERP users.
1 INTRODUCTION
Enterprise Resource Planning (ERP) systems
maintain event logs that record business process-
related information. The availability of these logs
makes it possible to discover valuable knowledge
that supports decision-making in organizations. For
example, process models that describe the actual
execution of a business process (e.g., order
fulfillment) can be extracted from event logs,
checked and validated against the prescribed process
design, and improved by identifying problem areas
such as bottlenecks and deadlocks (van der Aalst et
al., 2011). Despite the development of techniques
for managing business workflows (van der Aalst,
2011), far less attention has been paid to applying
process mining and visualization in real time for
benefiting ERP users (see, for example, Reichert et
al., 2012). Rather, these techniques have been used
primarily (a) for decision support rather than for
operational task support, (b) by management and
analysts rather than by end-users, and (c) in offline
settings rather than in real-time, online settings (van
der Aalst et al., 2010).
The goal of the research presented here is to
explore how process mining and visualization can be
used to assist ERP system users during active system
use. Usability is one of the major factors impacting
the success and failure of ERP implementations in
organizations (Hestermann, 2009), with users
experiencing difficulties in locating tasks, navigating
between task pages, and understanding the process
context (Babaian et al., 2010; Cooprider et al.,
2010). In an earlier paper (Babaian et al., 2007), we
explored how process visualizations could be used
for aiding users in navigating the steps within a
process and monitoring their progress.
In this paper, we focus on an approach for
improving the users’ understanding of the context of
their interactions with the system, the
interconnectedness of the tasks they perform and
those performed by other users, and the flow of
information between tasks and processes. While
workflow management systems are useful for
guiding users through established processes, users
will still find ways to deviate from prescribed
procedures (Rozinat and van der Aalst, 2008). The
value of our approach comes from exposing users to
the realities of system use through visualizations of
business process and usage data extracted from
system logs in real time. We have developed a
prototype that serves as a proof-of-concept of this
approach by visualizing various types of information
about processes, tasks, and their related contexts,
including the following:
The Composition of Tasks into Processes: reveals
to users the interconnectivity of the tasks they are
working on with other tasks supported by the
system.
83
Lucas W., Xu J. and Babaian T..
Visualizing ERP Usage Logs in Real Time.
DOI: 10.5220/0004440000830090
In Proceedings of the 15th International Conference on Enterprise Information Systems (ICEIS-2013), pages 83-90
ISBN: 978-989-8565-61-7
Copyright
c
2013 SCITEPRESS (Science and Technology Publications, Lda.)

The Interface Pages Defined within the System
for Performing each Task: strengthens the users’
understanding of how ERP transactions they
perform with the system map to tasks within a
process.
The Types of Data Objects Specified within the
System as Inputs to and Outputs from Tasks,
along with Usage Data on the Frequency with
which They are passed between Tasks: disclose
to users how the performance of other tasks
impacts what they are working on as well as how
the outputs they are creating may be put to use.
Detailed Information on the Task Instances
Performed by Users, Including the Actual
busIness Objects used as Inputs to and Outputs
from those Instances: provides crucial details for
interpreting and diagnosing error situations; the
output objects also make concrete for the users
the impact of their actions on other tasks and
processes supported by the system.
The information conveyed by these visualizations
will help ordinary ERP users understand the often
obscure relationships between process tasks, the data
encompassed by those tasks, and the people
performing them. As a result, we expect users to
become more competent and confident in their
interactions with the ERP system, thereby requiring
less training and a diminished need for external
support.
The remainder of this paper is organized as
follows. The next section reviews related research.
In Section 3, we first present a brief overview of the
framework used for usage event logging and process
identification. This is followed by the visualizations
enabled by our approach and implemented in an
ERP prototype. We conclude with directions for
future research.
2 RELATED WORK
Process visualization is closely related to process
mining, which is aimed at automatically extracting
process models from event logs (van der Aalst,
2011). Most ERP systems maintain logs recording
sequences of events that occur during system use.
These sequences are often called process instances,
as they represent specific executions of a business
process. Process mining seeks to discover the
general model of a process that fits and explains
most of its instances (van der Aalst, 2010). Reichert
(2012) highlights the importance of data flow to
process modeling. The organization of the process
around the flow and interaction of business objects
is key to our own approach to process modeling and
process instance identification.
Visualization is often used to present and display
the results of process mining in the form of control
flows (e.g., Petri Nets), data flows (e.g., Data Flow
Diagrams), or social networks. Process visualization
has been used to assist management and analysts in
examining and monitoring business processes and
identifying areas for improvements. For example,
the geographic map metaphor can be applied for
allowing users to zoom into and out of process graph
visualizations (van der Aalst et al., 2011), while
graph reduction approaches support the management
of large business process specifications (Streit et al.,
2005). The Proviado framework provides the means
for personalized views of business processes and
process instances at different levels of granularity
(Reichert et al., 2012)
Despite promising progress, the potential of
process visualization for improving ERP usability
has yet to be recognized. Several studies have
investigated the types of usability issues most
frequently experienced by ERP users, and the lack of
operational task support has been repeatedly
reported as a factor causing negative perceptions of
a system’s usability (Babaian et al., 2010); (Calisir
and Calisir, 2004); (Cooprider et al., 2010). Many
ERP systems do not provide search functionality for
users to find the correct task pages, there are no
recommendations for future actions, and critical
process context and progress information is often not
easily accessible (Babaian et al., 2010); (Cooprider
et al., 2010).
The research we present next investigates ways
in which process mining and visualization
techniques can be applied to addressing these types
of issues, with a focus on revealing process, task,
and contextual information to users during active
system use.
3 RESEARCH DESIGN
The research presented here is part of a larger
project whose goal is to improve the usability of
ERP systems. To that end, we have augmented an
ERP prototype with a component that generates
dynamic, interactive visualizations of system-
supported processes as well as the actual process
instances performed by users. The objective of this
approach is to improve usability by making
transparent to the user: the tasks and processes
supported by the system, the composition of tasks
ICEIS2013-15thInternationalConferenceonEnterpriseInformationSystems
84
into processes, the actual task sequences performed
by users, and the flow of information between tasks.
In support of our project’s goal, we have
developed the Task-Interface-Log (TIL) framework
(Lucas and Babaian, 2012). This framework is at the
heart of our ERP prototype and supplies the data
used by the visualization component, as described
next.
3.1 TIL Framework Overview
The TIL framework consists of a data model and
supporting algorithms for deriving process-related
data. While all ERP systems maintain usage logs for
auditing and diagnostic purposes, those logs do not
directly capture process structure or the
interconnectedness of tasks and the users performing
them. They are also not configured for ready
application to user support. The TIL model was
specifically designed to enable a system to
effectively utilize usage history, supported process
models, process and task instance details, and other
contextual data during system-user interactions. The
data model represents the system’s task structure,
interface components, and records of all system-user
interactions, with each interaction automatically
associated with its task and process context.
The TIL model is comprised of three modules:
the Task module, the Interface module, and the
Logging module. A Domain module, which is not
part of TIL but is referenced by the three TIL
modules, is used for representing ERP
organizational data.
Tasks and processes are predefined within the
Task module in accordance with the system in which
the model is embedded. A task represents a
transaction, such as “add material” or “edit purchase
order.” Domain objects (a.k.a. business objects)
correspond to ERP Domain module records and
include records on vendors, materials, purchase
orders, etc. They are used as inputs to and outputs
from tasks.
A process is defined in the TIL model as a set of
tasks related via the flow of domain objects between
them; its specification is independent of usage data
and can be customized to meet the needs of a
particular organizations.
A task instance is defined as the performance of
a task by one or more users. For example, two users
may work on a task instance associated with adding
a purchase requisition, with one user starting the
requisition and the second user adding additional
information prior to submitting it.
One or more users will work on one or more
tasks within a particular process instance. For
example, a process instance may consist of an Add
Purchase Order task instance performed by one user,
an Add Material task instance performed by another,
and an Add Goods Receipt task instance performed
by a third. Thus, process instances correspond to the
actual instantiations and executions of processes by
users.
User-system interactions are captured to the
Logging module of the TIL model by input-aware
interface components. These components are
defined in the Interface module and populate the
interface pages of the system (i.e., text fields,
buttons, and menus).
The TIL model and associated algorithms have
been implemented in SQL and embedded in an ERP
prototype. The visualization component described in
this paper relies on the TIL framework for providing
the effective and efficient reconstruction of the
process-related data. All of the visualizations
presented next were dynamically generated during
real-time use of the prototype.
3.2 Process Visualizations
There are a variety of visualizations that can be
provided to users for improving system-to-user
communication and fostering a deeper understanding
of the system and its uses. We have chosen to focus
on visualizations that convey the system-specified
means for performing a process, the actual process
instances performed with the system, and associated
contextual information that is typically unavailable
to ERP system users. These choices were based on
prior research that revealed the need for users to
understand the underlying business processes and
the contexts of their interactions (Topi et al., 2005).
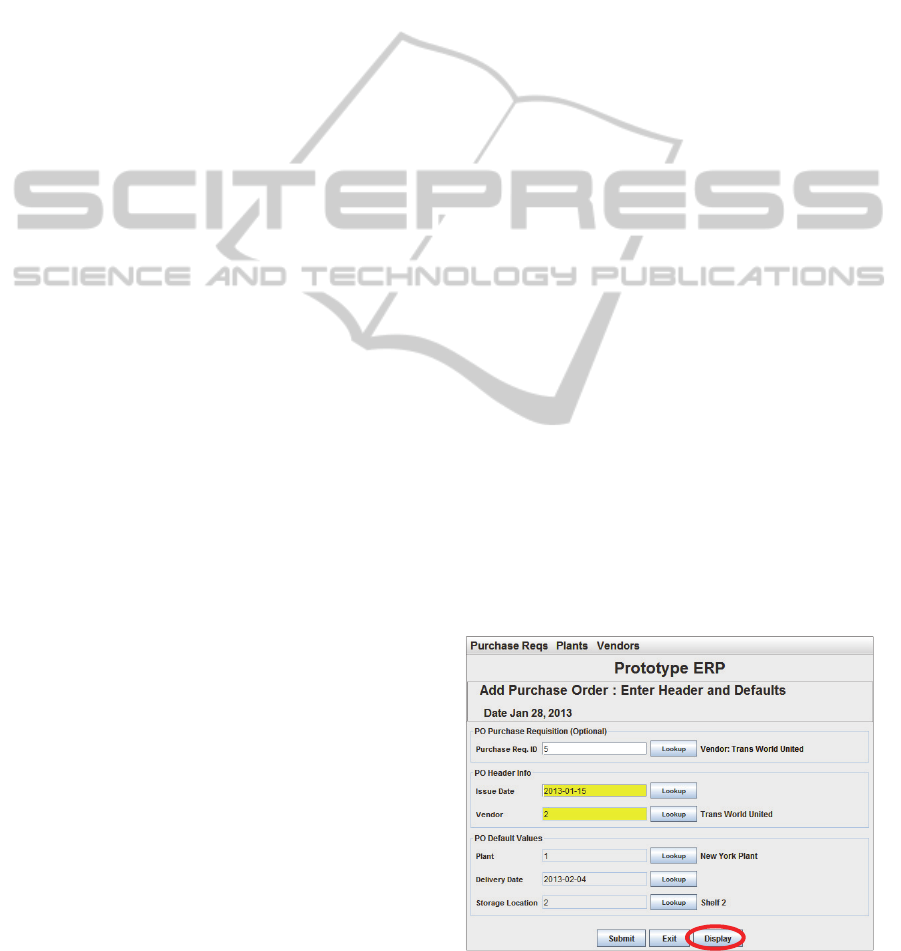
Figure 1: Add Purchase Order page from the ERP
Prototype with “Display” button for accessing
visualizations.
VisualizingERPUsageLogsinRealTime
85
To access the visualization interface, the user of
the prototype clicks on a “Display” button, which is
available from the bottom of each interface page. As
an example, Figure 1 highlights the placement of
this button at the bottom of the page for adding a
purchase order.
After launching this application, the user views
the Process Graph containing the task currently
being performed. Clicking on the Process Instance
Graph tab shows the current process instance
associated with the user’s interactions, while
selecting any node or link in either of these graphs
reveals additional information in the Process Details
pane. Figure 2 provides an example of the interface
presented to the user after clicking the Display
button shown in Figure 1 (the components of this
figure are described in detail in Section 3.2.1.). If the
user has just logged on and is therefore not yet
working on an active process when a Display button
is clicked, then the visualization component will
show the graphs for the process and process
instances most recently worked on by that user.
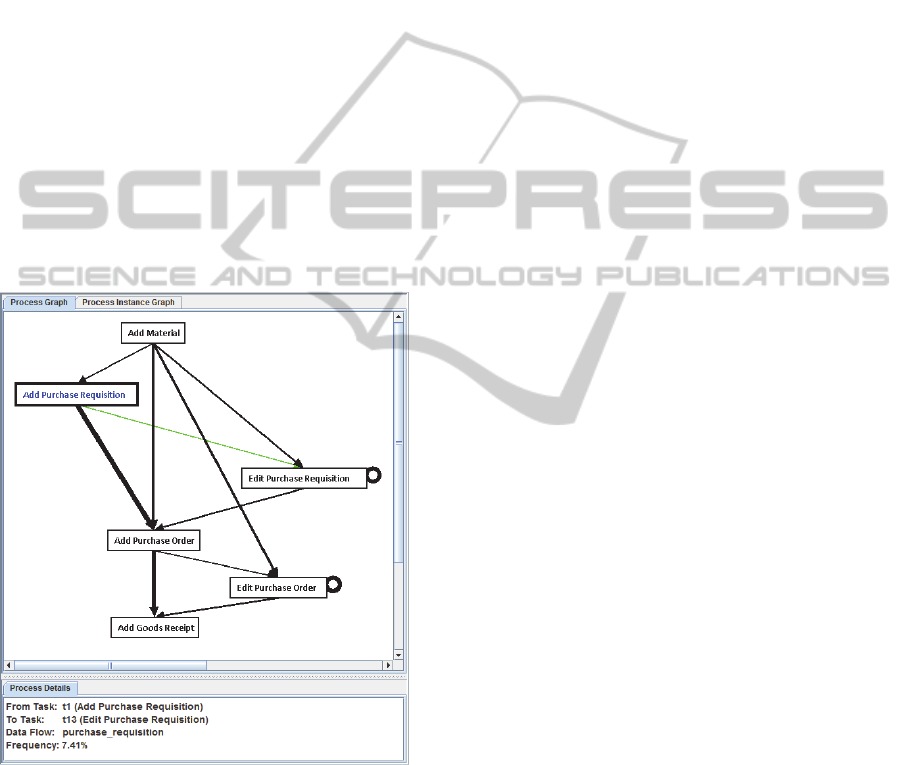
Figure 2: Visualization component displaying process
graph that includes the Add Purchase Order task, with
additional process details on the selected link in the lower
pane.
Since the exemplar purchasing process
demonstrated in this paper consists of a small
number of tasks distributed across a few hierarchical
levels, we have used a simple layout method to place
the same-level task nodes at the same height on the
panel and then manually manipulated the layout. For
large-scale processes, more sophisticated
hierarchical layout algorithms (Six and Tollis, 2002;
Sugiyama et al., 1981) and graph reduction
approaches (Sadiq and Orlowska, 1999; Sadiq and
Orlowska, 2000; van der Aalst et al., 2011) can be
applied to automatically minimize the number of
line crossings and reduce the structural complexity
of the generated graph.
Process and Process Instance Graphs, along with
the associated detailed information available on their
components, are discussed below.
3.2.1 Process Graphs
Process graph visualizations provide the user with
information on the tasks comprising a process, the
tasks preceding and following a selected task, and
the flow of object types between tasks. This
information is critical for a user’s understanding of
the processes supported by the system and how to
execute them successfully. It facilitates user
awareness of the position of the current task they are
working on within a process, where the inputs to that
task are coming from, the options available to them
upon completion of that task, and potential uses for
the output generated by the task. It is often difficult,
if not impossible, for users of the leading
commercial ERP systems to be able to view this type
of information (Babaian et al., 2010); (Calisir and
Calisir, 2004). To compensate, users often create
notes and usage guides that are then distributed
within organizational units (Topi et al., 2006), but
that is a far less efficient and costlier approach than
having the system convey this information directly
to the user.
In addition to making this information available
to users during active system use, our approach is
further distinguished by incorporating usage log data
into process graph visualizations. For example, the
frequency with which domain objects flow between
different task sequences can be calculated based on
the usage log and visualized in the process graphs.
We illustrate the system’s visualization component
with the following examples, which were
dynamically generated during use of the prototype.
Tasks Comprising a Process: The process graph in
Figure 2 shows the node-link diagram for the
Purchasing process, with a thicker border around the
task the user was working on when the “Display”
option was clicked. A blue label bears the name of
that task – in this case, the Add Purchase Order task.
The user can see all of the possible actions that led
up to the current task, as well as the possible
sequences of actions that can be performed next.
ICEIS2013-15thInternationalConferenceonEnterpriseInformationSystems
86
This view of the interconnectedness of tasks can be
eye-opening to users who work on discrete tasks and
have no means for discovering how what they do fits
into the overall process specified within the system.
Flows of Domain Objects: Arrowed links represent
the flow of domain objects between tasks. Figure 2
shows that the purchase requisition object output by
the Add Purchase Requisition task can be used as an
input to two other tasks, Edit Purchase Requisition
and Add Purchase Order. Circular links are attached
to tasks that can loop back to themselves, such as the
editing tasks in the graph. Information on object
flow is essential to the users’ understanding of the
sources for the inputs they use in performing tasks.
What is equally if not more important is making
users aware of what happens to the outputs produced
by the tasks they work on; such awareness drives
home the need for checking that the purchase
requisition was not only created but was also
successfully submitted so that a purchase order can
be generated, for example.
Frequency of Object Flows: The thickness of each
arrowed link in the process graph is proportional to
the frequency of the data flow from a source task to
a target task. Figure 2 shows that newly created
purchase requisitions were passed more frequently
to the Add Purchase Order task than to the Edit
Purchase Requisition task. This means that more
purchase orders were submitted directly for use in
creating a purchase order than were saved and
subsequently edited prior to submission. Thus, users
can learn about the likely flow of business objects
and the implications behind those flows for the
processes they work on, as derived from actual
usage data.
Detailed View of Object Flows: Clicking on a link
turns it green and displays additional information
about it in the Process Details pane. Figure 2
contains the results of clicking on the link going
from the Add Purchase Requisition node to the Edit
Purchase Requisition node, including the type of
object passed between the two (purchase requisition,
in this case) and the frequency with which a
purchase requisition was passed from the Add
Purchase Requisition task to the Edit Purchase
Requisition task (7.41%), as opposed to another task.
Clicking on the link therefore reveals the numeric
data that underlies the observable thickness of each
link.
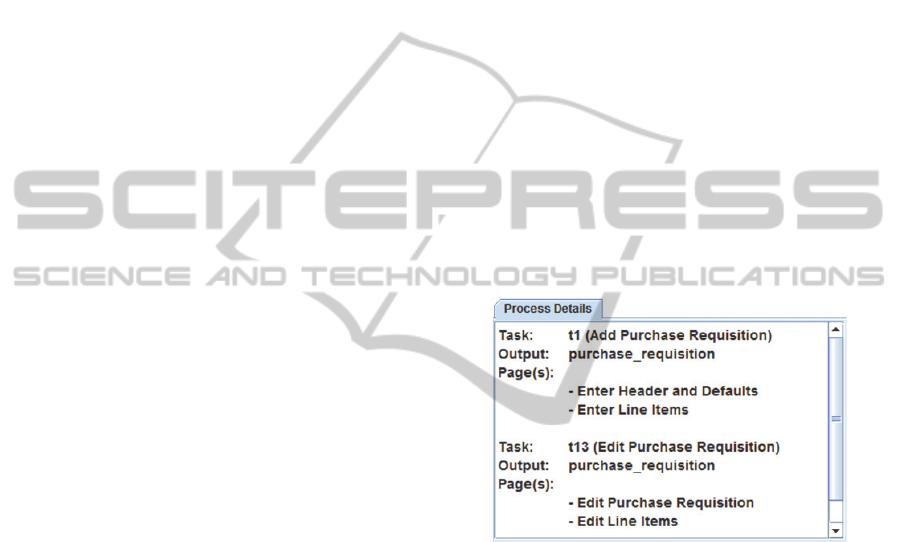
Detailed View of Tasks in a Process: Clicking on a
node also turns it green and provides additional
information about the task it represents. Figure 3
shows details associated with two of the nodes in the
process graph, obtained by first clicking the Add
Purchase Requisition node followed by clicking the
Edit Purchase Requisition node. This data informs
the user of the ID and textual description for each
selected task along with the names of the interface
pages in the system to be used in performing it. For
example, it reveals that the Add Purchase
Requisition task interface consists of two pages:
Enter Header and Defaults, and Enter Line Items.
This helps users understand how the interface pages
they make use of are linked to particular tasks within
a process and also serves to aid users in navigating
the system.
The information we are currently visualizing and
making available in the Process Details pane on
tasks and links is by no means exhaustive. Any
parameters directly associated with these
components or derivable from the usage log could
be presented. We have selected a meaningful initial
subset that our investigations have shown would be
useful in order to demonstrate the capabilities of our
approach.
Figure 3: Additional information displayed in Process
Details area from clicking on two nodes in the process
graph of Figure 2.
3.2.2 Process Instance Graphs
While process graphs reveal the relationships
between tasks within a process, as specified within
the system, process instance visualizations provide
detailed information on actual executions of
processes by users of the system. Users can see all
task instances within a particular process instance, as
well as the instantiated domain objects serving as
inputs to and outputs from those instances. Process
instance graphs and associated visualizations can be
particularly effective for conveying information to
new users about how tasks performed by others in
the organization contribute to the process instances
on which they work. These visualizations can also
provide critical information to any user facing an
VisualizingERPUsageLogsinRealTime
87
error situation, for which system support is often
inadequate (Topi et al., 2005).
The following examples illustrate the
information conveyed by the process instance
visualizations.
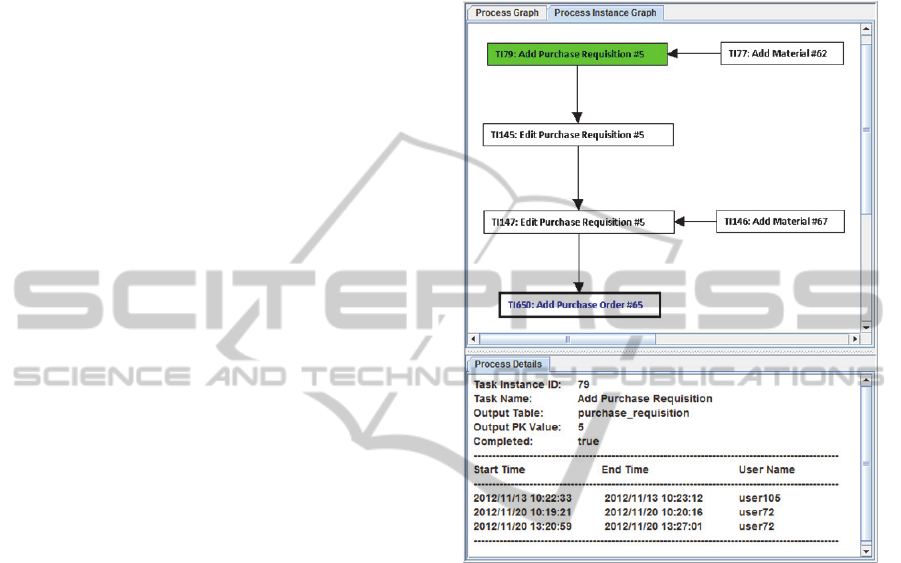
Task Instances Comprising a Process: The
process instance graph in Figure 4 shows the node-
link diagram for an instantiated process instance.
The label on each node shows the task instance ID,
the name of the represented task, and the ID of the
instantiated domain object associated with that
particular task instance. In this example, one can
easily see that Purchase Order (PO) #65 was
generated from Purchase Requisition (PR) #5. We
know from the circular link on the Edit Purchase
Requisition task in the process graph of Figure 3 that
the editing task can be repeated multiple times; what
we learn from the process instance graph is that, in
this particular execution of the process, PR #5 was
edited twice. While the process graph also revealed
that materials can be added to several different tasks,
we can see that in this case, a new material was
added during the creation of PR #5 and another was
added during the second editing of that PR.
As previously mentioned, a user can access the
visualization component while either involved in a
task or after having just logged on to the system.
Each of these “usage scenarios” is likely to have
different implications for how the information
conveyed by the visualizations will be most helpful.
In Usage Scenario 1, the user clicks on the
“Display” button while performing a task. The
current process instance is then displayed, with the
current task instance the user is working on
surrounded by a thick border and bearing a blue
label. For example, the view shown in Figure 4 was
generated from the Add Purchase Order interface
shown in Figure 1. In this case, the user is made
aware of the actual chain of events that led up to the
creation of Purchase Order #65. If the user
experiences an error situation, such information can
be very useful in interpreting the error message and
identifying possible sources of the error. While
commercial ERP systems store this same type of
information, the ability to trace back through the
history of task instances and domain objects leading
to the current state is something that only the most
experienced users who have undergone rigorous
training are typically able to do.
In Usage Scenario 2, the user clicks the
“Display” button after having just logged on to the
system. In this case, the process instance most
recently worked on by the user is displayed. Now
the thick border and blue label indicate the task
instance the user performed most recently. This view
can be particularly helpful to the user who has not
logged on for an extended period of time and needs
a reminder of her most recent interactions with the
system.
Figure 4: Process instance graph showing the history of
Task Instance TI650 with additional details of the selected
node in the Process Details pane.
Detailed Histories of Task Instances and
Associated Domain Objects: Clicking on a node in
a process instance graph turns it green and reveals
detailed information on the task instance and the
output it produces, as shown in the Process Details
pane of Figure 4. As noted earlier, the type of
information displayed in the details pane should be
customized to the needs of the users of the system,
with the data we have included here providing an
illusory example.
Task instance identification information, the
output table where the domain object that was
produced is stored, the identifier of that object (i.e.,
its primary key value), and whether or not the task
instance was completed are displayed first. This is
followed by information on who worked on the task
instance and when. Figure 4 shows that user105
initiated the creation of PR #5. One week later,
user72 edited that PR in two separate sessions on the
same day. Note that the two editing sessions are also
ICEIS2013-15thInternationalConferenceonEnterpriseInformationSystems
88

represented by the two editing task instance nodes in
the graph: TI145 and TI147; clicking on the node for
a task instance that instantiated a new domain object
(in this case, PR #5) reveals the full history of that
object’s creation.
As with the process instance graph, the detailed
information on task instances will also have
implications for users that vary by usage scenario.
Under Usage Scenario 1, where the user is engaged
in an ongoing process, the most useful information is
likely to be that detailed data on task instance
performance. Whether the user runs into an error
situation or just needs more information about the
data he is working with, he will be able to trace the
sequential order in which the task instances were
performed and the domain objects were created.
Typically this type of information is only available
to users who have experience with using a reporting
module, and even then, some time may be needed to
pull the relevant pieces together.
If the user does happen to encounter an error that
he cannot resolve, then the information on output
tables and primary keys can be very helpful to ERP
support personnel.
Under Usage Scenario 2, in which the user has
just logged on, the completion status parameter
recorded for a task instance can be especially
relevant. The user can click on the task instance she
worked on most recently and be reminded of
whether or not she finished it. From there, she can
click on preceding task instances within the process
instance graph to further remind herself about the
context of the work she was doing. For example, the
person who last worked on Purchase Order (PO) #65
could see if she had completed the order. If she had
not, she could then view the details on Purchase
Requisition #5 to see who had been involved in the
requisition task leading up to the placement of that
order. While there are other ways to get this type
information, being able to easily do so through the
system saves the user time and directs her attention
to the task at hand.
4 CONCLUSIONS AND FUTURE
RESEARCH
We have presented an approach that provides users
with a deeper understanding of the processes they
perform with the system and the contexts of their
interactions via real-time, interactive visualizations.
By drawing on the system’s knowledge of its own
functionality in conjunction with usage data, process
visualizations present users with the system-
supported task sequences for performing a process,
the flow of domain objects between tasks, the
position of the task the user is currently performing
within the available sequences, and usage statistics
on the paths between tasks. Understanding the
relationships between tasks and how processes are
typically performed within the organization is
essential for developing true proficiency with the
system.
Process instance visualizations provide detailed
views of actual process instances performed by the
user, including the current instance being worked on
as well as the most recently performed task. The
former allows the user to trace back through the
context of the current interaction. Having the ability
to follow the paths of the actual domain objects that
were inputs to and outputs from each task instance is
particularly useful in interpreting, diagnosing, and
resolving error situations. Providing details on a
user’s most recently performed task instance and the
process context within which that task was
performed serves to orient the user and remind her
of recent work.
The visualizations of higher level processes
coupled with detailed process instances provide
users with a much needed window into how
processes are enabled by the system and performed
in practice. Addressing the lack of visibility
provided by ERP systems can have a profound
impact on the ability of users to make the most
effective use of these complex systems.
In future work, we will explore additional
visualizations for assisting users, such as deriving
navigable process sequences based on process
instances successfully completed by a specified
group of users within a particular time period. While
our approach has been implemented in a prototype,
methods for integrating it into existing ERP systems
will also be investigated.
ACKNOWLEDGEMENTS
This material is based in part upon work supported
by the National Science Foundation under Grant No.
0819333. Any opinions, findings, and conclusions or
recommendations expressed in this material are
those of the author(s) and do not necessarily reflect
the views of the National Science Foundation.
VisualizingERPUsageLogsinRealTime
89

REFERENCES
Babaian, T., Lucas, W., Xu, J. & Topi, H. 2010. Usability
through system-user collaboration: Deriving design
principles for greater ERP usability. In DESRIST’10,
5th International Conference on Design Science
Research in Information Systems and Technology, St.
Gallen, Switzerland.
Babaian, T., Lucas, W., and Topi, H. 2007. Visualizing the
process: A graph-based approach to enhancing system-
user knowledge sharing. In ICEIS’07, 9th
International Conference on Enterprise Information
Systems, pp. 123-128, Funchal, Portugal.
Calisir, F. & Calisir, F. 2004. The relation of interface
usability characteristics, perceived usefulness, and
perceived ease of use to end-user satisfaction with
enterprise resource planning (ERP) systems.
Computers in Human Behavior, 20, 505-515.
Cooprider, J., Topi, H., Xu, J., Dias, M., Babaian, T. &
Lucas, W. 2010. A collaboration model for ERP user-
system interaction. In HICSS’10, 43rd Hawaii
International Conference on System Sciences, Kauai,
HI.
Hestermann, C. 2009. Key issues for Enterprise Resource
Planning 2009 Gartner.
Lucas, W. & Babaian, T. 2012. Implementing design
principles for collaborative ERP systems. In
DESRIST’12, 7th International Conference on Design
Science Research in Information Systems and
Technology, Las Vegas, NV. LNCS2012, pp. 88-107,
Springer.
Reichert, M. 2012. Process and sata: Two sides of the
same coin? In CoopIS’12, 20th International
Conference on Cooperative Information Systems,
OTM 2012, Part I, Rome, Italy. Springer.
Reichert, M., Kolb, J., Bobrik, R. & Bauer, T. 2012.
Enabling personalized visualization of large business
processes through parameterizable views. In SAC'12,
27th ACM Symposium on Applied Computing, 9th
Enterprise Engineering Track (EE'12), Trento, Italy.
ACM Press, 1653-1660.
Rozinat, A., & van der Aalst, W.M.P. 2008. Conformance
checking of processes based on montiroying of
behavior. Information Systems, 33(1), 64-95.
Sadiq, W. & Orlowska, M. E. 1999. Applying graph
reduction techniques for identifying structural
conflicts in process models. In Jarke, M. & Oberweis,
A. (eds.) Advanced Information Systems Engineering.
Berlin: Springer-Verlag.
Sadiq, W. & Orlowska, M. E. 2000. Analyzing process
models using graph reduction techniques. Information
Systems, 25, 117-134.
Six, J. M. & Tollis, I. G. 2002. Automated visualization of
process diagrams. In Mutzel, P., Junger, M. & Leipert,
S. (eds.) Graph Drawing. Heidelberg: Springer-
Verlag.
Streit, A. T., Pham, B. L. & Brown, R. A. 2005.
Visualization support for managing large business
process specifications. Van Der Aalst, W. M. P.,
Benatallah, B., Casati, F. & Curbera, F., eds. In
BPM’05, 3rd International Conference on Business
Process Management, Nancy, France.
Sugiyama, K., Tagawa, S. & Toda, M. 1981. Methods for
visual understanding of hierarchical system structures.
IEEE Transactions on Systems, Man, and Cybernetics,
11, 109-125.
Topi, H., Lucas, W. & Babaian, T. 2005. Identifying
usability issues with an ERP implementation. In
ICEIS’05, 7th International Conference on Enterprise
Information Systems, Miami, FL.
Topi, H., Lucas, W. & Babaian, T. 2006. Using informal
notes for sharing corporate technology know-how.
European Journal of Information Systems, 15, 489-
499.
van Der Aalst, W. M. P. 2010. Process discovery:
Capturing the invisible. IEEE Computational
Intelligence Magazine 5, 28-41.
van Der Aalst, W. M. P. 2011. Process mining: Discovery,
conformance, and enhancement of business processes,
Heidelberg, Springer-Verlag.
van Der Aalst, W. M. P., De Leoni, M. & Ter Hofstede, A.
H. M. 2011. Process mining and visual analytics:
Breathing life into business process models. Available:
http://bpmcenter.org/wp-
content/uploads/reports/2011/BPM-11-16.pdf.
van Der Aalst, W. M. P., Pesic, M. & Song, M. 2010.
Beyond process mining: From the past to present and
future. In CAiSE’10, 22nd international conference
on Advanced information systems engineering,
Hammamet, Tunisia. Springer-Verlag, 38-52.
ICEIS2013-15thInternationalConferenceonEnterpriseInformationSystems
90
