
A Novel Method for Similarity Search over Meteorological Time
Series Data based on the Coulomb’s Law
Claudinei Garcia de Andrade, Marcela Xavier Ribeiro,
Cristiane Yaguinuma and Marilde Terezinha Prado Santos
Computer Science Department, Federal University of São Carlos, São Carlos, Brazil
Keywords: Time Series, Similarity Search, Coulomb’s Law.
Abstract: Several areas of knowledge use systematic and controlled observation, obtained from measurements taken
at regular intervals, as a tool for behavioral analysis of phenomena, such as meteorology, which uses the
observations to predict the climate behavior. Furthermore, with the advance of technology, the instruments
used to measure observations have grown dramatically and the amount of data available for analysis has
become greater than the ability to analyze them. In this context, this paper aims to propose a method, based
on the principle of Coulomb's Law, for similarity search in time series and thus discovering intrinsic
knowledge from these data. Experimental results conducted on climatic data of Brazilian cities and the sea
surface temperature showed that the proposed method outperforms traditional methods on performance and
accuracy and it is promising for finding similarity in series.
1 INTRODUCTION
Since the dawn of science, even before the
introduction of the experiments as a method to
replicate the phenomena of nature, observation has
already been as one of the important factors to
validate some theory. Currently, the observations are
used in most diverse areas of knowledge and along
with experiments allow the knowledge production.
In this context, the way to obtain observations
has evolved over time and it has become
sophisticated and accurate, particularly with the
development of sensors. These devices are able to
detect changes in the conditions of a given
environment and transmit the result at regular time
intervals as a measure or a control statement for a
central management. These sets of observations
taken during the course of regular time intervals are
known as time series.
Technological advances, coupled with the low
cost of production of these instruments to measure
observations, have increased dramatically the data
available for analysis. However, the collected data
have intrinsic relations between them that are not
obvious without thorough analysis, requiring the use
of specific techniques to obtain knowledge from
this.
Given this amount of collected data, there is a
great challenge to handle the large data volume.
Moreover, the analysis of a datum held in isolation
may not have great significance for the whole.
Therefore, a major challenge for working with initial
analysis of temporal observations focuses on how
data are stored or how to store them in a compact
way so that they fairly represent collected data in a
easy information handling way.
Then finding an ideal descriptor that can
represent the characteristics of time series and
generate descriptions that contain sufficient
information to identify parts of the series in a
reliable way and, thereby, reducing the
dimensionality of data without much loss of
information is one of the factors that motivates the
execution of this work, specially because several
techniques were found in the literature for this
purpose, but none of them can describe the series
with lots of details and, therefore, important
information may be overlooked without a proper
analysis.
In addition, several areas of knowledge are
interested in this kind of work because they use time
series to obtain knowledge. Among them, we can
mention: the economy, through the measurement of
daily stock prices, currency prices, interest rates, and
others; medicine through electrocardiogram or
209
Garcia de Andrade C., Xavier Ribeiro M., Yaguinuma C. and Terezinha Prado Santos M..
A Novel Method for Similarity Search over Meteorological Time Series Data based on the Coulomb’s Law.
DOI: 10.5220/0004446702090216
In Proceedings of the 15th International Conference on Enterprise Information Systems (ICEIS-2013), pages 209-216
ISBN: 978-989-8565-59-4
Copyright
c
2013 SCITEPRESS (Science and Technology Publications, Lda.)

electroencephalogram exams, weekly cases of a
particular disease, among others; and meteorology
by measuring the daily temperature, the level of
precipitation, and others.
The objective of this work is to propose a
descriptor that can represent the series in a unique
form to facilitate handling and storage of data and
also to find a distance measure that, applied to
summary data, faithfully represents the distance
similarity between them to provide the execution of
similarity queries. In order to validate the proposed
method, meteorological data were used as case study
and the results showed the effectiveness of the
method for finding similarity in series.
The rest of the paper is organized as follows:
Section 2 briefly demonstrates concepts related to
similarity search in time series and the major related
work. The proposed method is explained in Section
3 and the experimental results are discussed in
Section 4. And, finally, in section 5, there are
conclusions.
2 REVIEW AND ANALYSIS
OF RELATED WORK
The representation of the series to facilitate their
knowledge extraction and makes their computation
handling easier, despite preserving the original data,
constitutes a master pillar to research in time series
analysis. In this section, we discuss the concepts
related to the implementation of the proposed
method and the main methods found in the literature
for similarity search in time series.
2.1 Time Series Analysis
A time series can be defined as an ordered sequence
of observations (Wei, 1990). The sorting based on
observation time is very important; however, it is not
only time that can be considered an index to the
measurements and for sorting this sequence any
other index can be used, such as space and depth.
Formally, a time series is a set of observations
{Y (t), t Є T}, wherein Y is the variable of interest,
and T is the set of indexes.
We can classify the series according to 3 basic
types with respect to the range of observations.
Being: i) a discrete series, if the observations are
made at selected times that are generally regular,
T = {t
1
, t
2
,..., t
n
}; ii) a continuous series when
observations are continuous in time and T = {t: t1 <t
< t2 } and; iii) present several multivariate
observations for a common time Y
1
(t), . . . , Y
k
(t), (t
Є T).
The series may be described using their basic
components, which are: trend, cycle and seasonal
(Morettin, 1987) and (Fukunaga, 1990).
Thus, with the analysis of the components and
features of the series, it is possible to analyze their
contents, having as objectives:
Describing the series showing its constitutive
properties such as trend, seasonal, among others;
Understanding the mechanism enabling the series
to find the reasons for their behaviour;
Predicting future values, using data and past
behaviours and also forecasting methods;
Getting control over the process that generates the
observations and thus ensuring that the series has
an expected behaviour.
Moreover, obtaining the relevant characteristics
to the series, one can discover and visualize patterns
in the series, detect anomalies, identify gaps or
similar series, generating clusters, association rules,
among other activities in which the characteristics of
the obtained series can be used as guiding for pattern
identification.
Another important factor to consider in analyzing
series is the reduction of dimensionality. A time
series may be considered a data sequence in which
each point has a given a size (or length) n and if this
is reduced to a dimension k, with k << n, it implies
in reducing the computational complexity of O(n) to
O(k).
2.2 Query by Similarity
Due to the large variability in the data series, it is
almost impossible to find exactaly equal intervals. In
this context, the concept of similarity has wider
applicability than equality.
For the execution of similarity queries, it is
necessary to have a means of measuring the amount
of similarity or dissimilarity between two objects
belonging to the domain, so that the objects are
represented in a metric space.
A metric space M is defined by the pair {S, d},
where S designates the data field and d is a distance
function. This function provides the measure that
expresses how similar or dissimilar an object is from
another one. (Bozkaya, 1999)
For the application of distance functions into
complex data, it is commonly used inherent
characteristics to represent the data instead the
original data itself. These extracted features form the
feature vector.
ICEIS2013-15thInternationalConferenceonEnterpriseInformationSystems
210

The feature vector is used by the distance
functions for similarity calculation and hence for
data searching operations and comparison, returning,
as a result of the query, a set of similar objects
sorted by similarity to the reference object. This
approach is called content-based retrieval.
There are two basic types of similarity queries: i)
range query and ii) k-Nearest neighbor query (k-NN
query).
As seen above, the feature vector is of
fundamental importance for the similarity search in
series; however, it is not quite enough for the
similarity analysis in series. For this, it is necessary
to compare those vectors through a function that
evaluates how similar or dissimilar two feature
vectors are. This function receives the name of
distance function or similarity function.
The main functions of distance used for
similarity in time series are known as distance
functions of Minkowski (Lp family).
2.3 Descriptors Series
In the literature, there is not a consolidated concept
of descriptor to complex data. Some authors define
(Torres and Falcão, 2006) and (Weber, et al., 1998)
a descriptor as being formed by a tuple (ЄD, D)
wherein:
ЄD is the component responsible for
characterizing the object through feature extraction
and generating a vector that will be used to analyze
the data;
D is the function responsible for comparing the
feature vectors, giving an amount of similarity
between the query objects.
However, in the literature, the concept of
descriptor refers only to the function that generates
the feature vector. In this work, the concept of
descriptor will be used to refer to the feature vector
and distance function.
The main descriptors, in the literature, are
presented next.
2.3.1 Sequential Matching
The descriptor Sequential Scan, also known as Brute
Force Solution, Sequential Scanning (Keogh, 1997)
is considered as a trivial method to search for
similarity in series. It basically consists of 'slipping'
a query string throughout the series and calculating
the distance between the strings. L2 distance
function is generally used between each string point
and the search is performed sequentially to all
possible subsequences (strings) that are as most
similar as possible to the query string inserted.
This method has the advantage of being a great
method for similarity search. However, one of its
main problems lies in the computational complexity
of its implementation. The complexity of this
method is O(m-n +1) * n) (Keogh, 1997), where m is
the number of points of the studied series and n is
the existing number of points in the query string.
Therefore, for large series, the sequential matching
is not a feasible implementation because its high
computational cost.
2.3.2 Discrete Fourier Transform
The Discrete Fourier Transform - DFT is a
technique based on signal processing proposed by
Agrawal and Faloutsos (Agrawal, et al., 1993) in
which a small number of coefficients is sufficient
for proper description for the vast majority of
functions by linear combination of harmonic
solutions. And this was one of the first proposed
methods for dimension reduction and searching of
similarities in series.
This technique is based on the Fast Fourier
Transform which has a computational cost O(nlog
(n)), with n representing the input size. Furthermore,
the commonly used distance function is L2.
Being a transform that expresses a time series in
terms of a linear combination of sinusoidal basis is
very efficient to determine the frequency spectrum
of a signal, i.e. for determining inflection point in
the series.
2.3.3 Other Descriptors
Other descriptors have been proposed in the
literature, not using a signal processing approach,
and they are:
Singular Value Decomposition – (Korn et al.,
1997) is a representation of the series by a linear
combination of formats, i.e. the series is
represented by a matrix A of size m x n. However,
the calculation of eigenvectors and eigenvalues has
a large computational burden for large intervals
and the dimensionality reduction lost important
data information. The distance function used for
this feature vector is L2.
Discrete Wavelet Transform - DWT: This
descriptor proposed by Chan and Fu, 1999 (Chan
and Fu, 1999), transforms the series as a linear
combination of functions based on the
mathematical definition of a wavelet. This
descriptor presents itself inefficient for data
representation showing large amplitude or a large
variability in the data because there is a deletion of
ANovelMethodforSimilaritySearchoverMeteorologicalTimeSeriesDatabasedontheCoulomb'sLaw
211

important characteristics upon translational
processing function for scaling.
Piecewise Aggregate Approximation – PAA
(Keogh et al., 2000): represents the series through
a sequence of segments of equal size, using for this
the average number within the range. Distance L1
is employed;
Adaptive Piecewise Constant Approximation -
APCA (Keogh et al., 2001): This descriptor is an
improvement of PAA descriptor in which the
segments present adaptive sizes, wherein the
segments are given different periods of the series
that exhibit great variability and fewer segments at
intervals of low variability. The distance used is
generally L1;
Piecewise Linear Aproximation – PLA
(Morinaka et al., 2001): this descriptor represents
the series by a sequence of straight lines and the
distance function is based on the height of the line
length where the sequence is.
All of the above methods are effective for
specific domains. They also imply in loss of data
representativeness in most cases.
3 THE PROPOSED APPROACH
This section will discuss the proposed new method
for similarity search in time series using the
concepts explored in the previous section.
3.1 Coulomb's Law Enforcement
Coulomb's Law establishes the mathematical
relationship between the load of two or more bodies
and their electrical power produced by calculating
the interaction forces (attraction and repulsion)
existing in these loads. The principles of Coulomb's
law can be expressed by:
The intensity of the electric force is directly
proportional to the product of electric charges.
The intensity of the electric force is inversely
proportional to the square of the distance between
the bodies.
The formula of Coulomb's Law is expressed by:
Where:
is the force in Newtons;
r is the distance between two point charges;
q
1
and q
2
are the values of the loads;
r
ˆ
is the vector that indicates the direction of the
electrical force;
K is the Coulomb's constant.
The use of Coulomb's Law for similarity search
in time series is justified by the fact that interactions
between charges are very well represented by the
resultant force and this is an objective of creating a
descriptor for time series.
Therefore, we propose to search for similarity in
series considering the time series values as point
charges with constant charge q located in the
coordinate plane formed by the index number and
the observation value. Based on the calculation of
the resultant force applied to a punctual form, the
loads are placed on the centroids of the search
intervals.
As the distance between loads is necessary to
calculate the interaction between them, a Cartesian
plane formed by the index time series (x-axis) and
the value of the observations (y-axis) is considered
and so it is possible to compute the distance between
loads for calculating the force.
In addition, a dummy load is inserted into the
centroid formed by sets of observations that
comprise the search intervals and this burden aims to
provide a good representation of the range, as well
as locate the geometric centre of the range. This is
used for calculating the interaction between it and
other workloads generating the resultant force that
represents the range.
As the resulting force is a vector measure, the
direction and sense of load influence the calculation;
for that, it was established that the loads that are
below the existing load at the centroid have the
opposite direction to those who are above it and,
therefore, exhibit negative value of the force.
As described above, it is possible to represent the
time series through a system of interaction of
charged particles and to calculate the resultant force
obtained from a vector sum of all the forces that
make up the system and, this way, being able to
reduce the dimensionality of the series to perform
similarity search without much loss of information.
3.2 Descriptor
As above, the interaction between charges formed
by the data assists in the series similarity search in
series, forming a promising descriptor.
3.2.1 Vector of Characteristics
In order to perform similarity queries, the feature
F
r
r
qq
kF
ˆ
2
21
ICEIS2013-15thInternationalConferenceonEnterpriseInformationSystems
212

vector has great importance. It contains information
about relevant aspects of the series and it is used to
calculate the distance between series intervals.
In the case of the proposed approach, the feature
vector formed by the resultant force (
F
) is
calculated within the range of interest and also by
the height of the centroid (h). As shown in the
expression below:
[,]VFh
The need of using the height of the centroid is
justified because the resultant force can map the
interaction between the points that compose the
range. However, no information regarding height
between the original data is stored and this
information is important for the calculation of
similarity.
3.2.2 Distance Function
In order to define the degree of similarity between
series sequences, the feature vector described before
is used and it is applied to Euclidean distance.
3.3 Coulomb's Law x Sequential Scan
The descriptor Sequential Scan is a descriptor that
presents a high accuracy. However, due to its search
mechanism, run time is high, making impossible its
use for large amounts of data.
The method based on Coulomb's Law presents
high accuracy, and its running time is not high,
which makes the use of the new method plausible.
Furthermore, the proposed method based on the
Coulomb's Law does not require large amounts of
memory for execution.
3.4 Coulomb's Law x DFT
The Discrete Fourier Transform has a high degree of
accuracy and the execution time is not huge
compared to the Sequential Scan.
However, the method based on Coulomb's Law
has smaller execution time than DFT and its
accuracy is higher. This makes the new method’s
use plausible compared to the DFT method.
Moreover, with respect to other existing methods
in the literature, the vast majority has been proposed
for specific purposes and can provide satisfactory
results when applied in their context; however, they
can exhibit poor results if applied in other fields. On
other hand, the method based on Coulomb's Law can
be applied in different contexts and due to the fact
that it can index the search intervals by calculating
the resultant force, the representativeness of the
range does not suffer much loss of information.
4 EXPERIMENTAL
EVALUATION
Among the studied descriptors and dimensionality
reduction techniques that exist in the literature, there
are some validation methods for generating
consolidated reliable metrics that can be used to
compare and to verify the efficacy of the models.
Some of the aspects used for methods assessment
are the following:
Accuracy is a measure used by many areas of
science and it is intended to measure the amount of
instances that were correctly predicted from an
input query. In the case of time series, this measure
is used by passing an input range and checking the
output given by the system to compare whether the
returned objects faithfully represent objects with
greater similarity among the query object.
Computational Complexity refers to the resource
requirements necessary to pose an algorithm to
solve a problem, or it refers to the amount of work
and/or time spent in performing a job (Wilf, 2002).
Precision versus Recall: This technique proposed
by Kent et. all., (Kent et al., 1955) apud (Meadow,
1992), considerably used for the quality
assessment method for image search, can be
adapted for methods of evaluating similarity in
series. The precision measures the fraction of
relevant objects returned in a given query with
respect to the total of returned objects. On the
other hand, the recall measures the fraction of
relevant objects returned in a given query with
respect to the total of the relevant objects of the
database. Furthermore, the accuracy of recall curve
indicates the variation of the precision values for
different values of recall. And the higher the curve
is, the more effective is a descriptor.
For the experiments, we used meteorological
data obtained from the project AgroDataMine,
(Databases and Images Group, 2012) in which there
are measurement sensors of climate data such as
temperature, rainfall rate, relative humidity obtained
from several Brazilian cities with daily
measurements that start in 1950 until today and data
from (National Weather Service, 2012) relative to
the average temperature of the sea surface in the
region of El niño and databases randomly generated
for testing were also used.
ANovelMethodforSimilaritySearchoverMeteorologicalTimeSeriesDatabasedontheCoulomb'sLaw
213
4.1 Accuracy
As initial test to verify the accuracy of the proposed
method, we used samples from Agrodatamine
database in which a Brazilian city's (Alegre, ES)
minimum temperature obtained from monthly
samples taken in the interval of the years 1979 to
2010. We intended to locate intervals of highest
similarity according to a particular season. In the
case of this test, the 10 most similar periods (knn
query) to the Brazilian winter period from June 21 to
September 23, 1950 were queried. A prototype has
been developed with the method and the Coulomb
query result is shown in Figure 1, by a graph in
which the most similar periods are marked with
different colours.
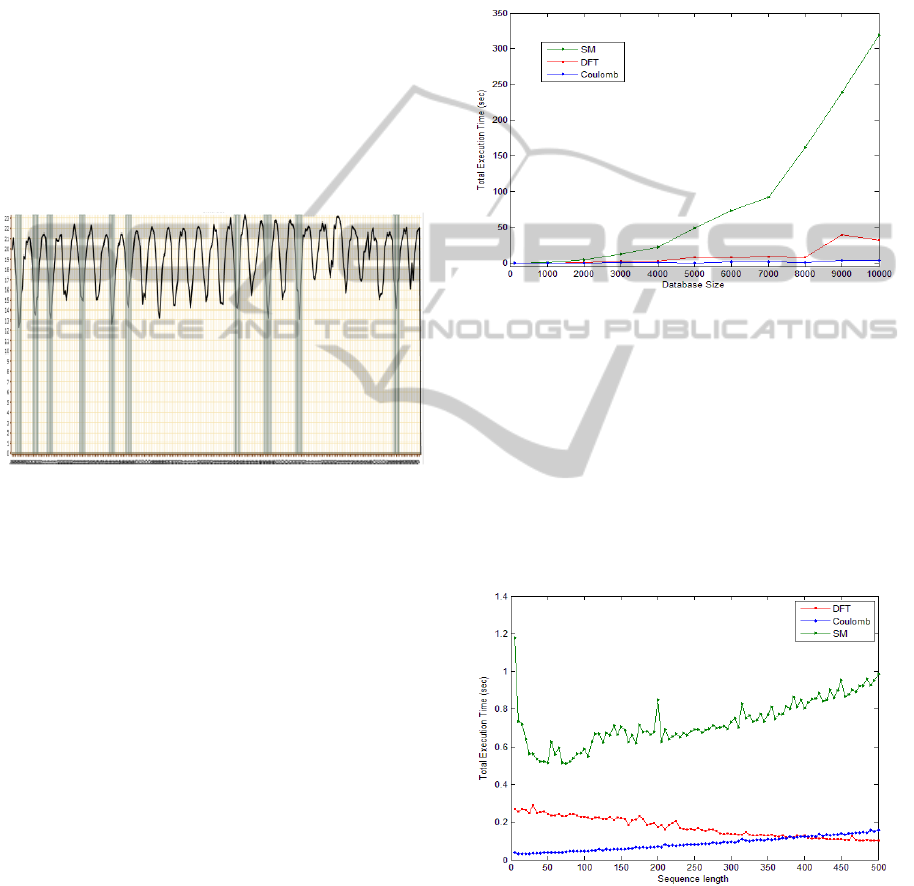
Figure 1: knn query with k = 10 for data related to
Brazilian climate.
From the tests, it was noticeable that the query
returns the elements that have periods of winter with
an average temperature close to the temperature of
the query object. Furthermore, by analyzing the
chart, it is possible to check this fact without further
analysis.
Therefore, we note that the results presented by
the Coulomb method are suitable for the query by
similarity.
4.2 Complexity
For the complexity of the algorithm, tests were
performed using a randomly generated as bases in
order to verify the performance of the Coulomb
method, comparing it with the first descriptor
Sequential Matching (SM) (Keogh, 1997), and too,
with Discrete Fourier Transform (DFT) (Agrawal et
al., 1993), because these methods are considered
baselines.
The first test runs to the complexity of the
algorithms and consists of a single query knn using
the three descriptors, varying the size of the database
and recording the time spent to perform the query.
As the database size increases the base amount of
calculations performed also increases, however, it
should be noted that it does not become unaffordable
temperaturefor the Coulomb-based method. The
graph in figure 2 shows the query time for different
sizes of the database.
Figure 2: Time per query varying database size.
By analyzing the graphs of Figure 2, we note that the
fast method is the Coulomb-based proposed one.
Another test conducted to determine the
efficiency with respect to the complexity was to
perform a query knn in a database and vary the size
of the range consulted to observe the behaviour of
the methods, with respect to time spent executing the
query. Figure 3 shows the graphic with that
measures.
Figure 3: Time per query varying sequence length.
Analyzing the chart, it is noted that the Coulomb
method has a lower execution time when compared
to the descriptor MS. Also, if compared to FTD it
shows good results for polling intervals data below
400. For the analysis of the weather intervals query
ICEIS2013-15thInternationalConferenceonEnterpriseInformationSystems
214
bases, which are not greater than one year, the
method Coulomb also provides satisfactory results
with respect to time complexity.
4.3 Precision versus Recall
In order to conduct the experiments precision and
recall, we used data from the AgroDataMine project
and also from the National Weather Service for the
El Niño data.
For developing the precision and recall graphics,
the recommendations outlined in (Meadow, 1992)
were used.
In the first experiment, we used data of a
Brazilian city minimum temperature and ten
similarity queries; using the three previously
mentioned methods, we have searched for seasons or
similar periods in which there are temperature
increases or falls outside the normal pattern. From
the data obtained, precision and recall for each point
of interest were extracted and the comparison chart
was constructed. Figure 4 shows the produced
graphs.
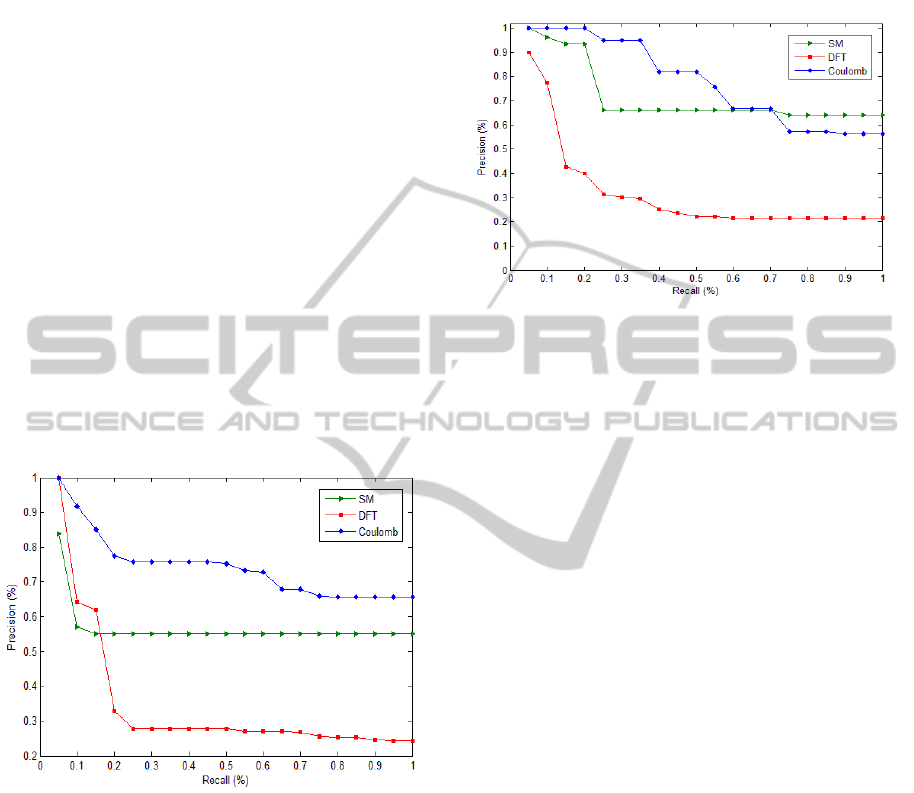
Figure 4: Precision vs. Recall for the Agrodatamine
database.
Looking at the graph, we note that the Coulomb
method presents very good results relative to other
methods. The accuracy is high for a recall lower
than 60%.
Another experiment used the surface temperature
of the ocean in the region 3.4 (SST in the Nino-3.4
region) where the phenomenon of El Niño occurs.
Considering that this phenomenon is cyclic and it
has a cycle every 30 years, when the average
temperature in the cycle is larger over the years,
queries were held by similarity searching intervals of
months or years that belong to the same cycle.
The tests were conducted with the three methods
for analysis and the data were analyzed to obtain the
precision and recall graphs showed in Figure 5.
Figure 5: Precision vs. Recall for SST in the Nino-3.4
region database
Examining the graph, we note that the Coulomb
method has satisfactory results for the database in
question, because it has a good level of precision.
As we can see in the graph of Figure 5, the
precision of Coulomb remains satisfactory compared
to the other methods, showing that the quality of the
proposed method is high for performing similarity
search over time series of meteorological data.
5 CONCLUSIONS
By analyzing the results, we concluded that the
proposed method presented high accuracy and low
time for performing similarity queries in time series.
Furthermore, the experiments results indicate that
the proposed method based on the Coulomb law is
well-suited to time series analysis.
As future work, we intend to apply the method in
other areas of knowledge.
ACKNOWLEDGEMENTS
We would like to thank CNPq, CAPES and FAPESP
for the financial support.
REFERENCES
Agrawal, R., Faloutsos, C. & Swami, A., 1993. Efficient
Similarity Search in Sequence Databases. Proc. Fourth
ANovelMethodforSimilaritySearchoverMeteorologicalTimeSeriesDatabasedontheCoulomb'sLaw
215

Int’l Conf. Foundations of Data Organization and
Algorithms (FODO), pp. 1-15.
Bozkaya, T. a. O. Z. M., 1999. Indexing large metric
spaces for similarity search queries.. ACM
Transactions on Database Systems, pp. 361-404.
Chan, K. & Fu, A.-C., 1999. Efficient Time Series
Matching by Wavelets. Proc. 15th Int’l Conf. Data
Eng. (ICDE).
Databases and Images Group, 2012. Agrodatamine:
Development of Algorithms and Methods of Data
Mining to Support Researches on Climate Changes
Regarding Agrometeorology | AgroDataMine.
[Online] Available at: http://www.gbdi.icmc.usp.br/
agrodatamine/ [Accessed 19 12 2012].
Fukunaga, K., 1990. Introduction to Statistical Pattern
Recognition. 2nd ed. s.l.:Academic Press.
Kent, A., Berry, M. M., Luehrs, L. V. & Perry, J. W.,
1955. Machine literature searching VIII: Operational
criteria for designing information retrieval systems.
American Documentation, pp. 93-101.
Keogh, E., 1997. A Fast and Robust Method for Pattern
Matching in Time Series Databases. Proceedings of
WUSS-97.
Keogh, E., Chakrabarti, K., Mehrotra, S. & Pazzani, M.,
2001. Locally adaptive dimensionality reduction for
indexing large time series databases. Proceedings of
the ACM SIGMOD Conference.
Keogh, E., Chakrabarti, K., Pazzani, M. & Mehrotra, S.,
2000. Dimensionality reduction for fast similarity
search in large time series databases. Journal of
Knowledge and Information Systems.
Korn, F., Jagadish, H. & Faloutsos, C., 1997. Efficiently
Supporting Ad Hoc Queries in Large Datasets of Time
Sequences. Proc. ACM SIGMOD.
Meadow, C. T., 1992. Text Information Retrieval
Systems. s.l.:Academic Press, Inc.,.
Morettin, W. O. B. e. P. A., 1987. Estatística Básica. 4 ed.
s.l.:Atual Editora.
Morinaka, Y., Yoshikawa, M., Amagasa, T. & Uemura,
S., 2001. The L - index: An indexing structure for
efficient subsequence matching in time sequence.
Pacific-Asia Conference on Knowledge Discovery and
Data Mining - PAKDD.
National Weather Service, 2012. Climate Prediction
Center. [Online] Available at: http://www.cpc.ncep.
noaa.gov/products/analysis_monitoring/ensostuff/ONI
_change.shtml [Accessed 19 12 2012].
Torres, R. d. S. & Falcão, A. X., 2006. Content-Based
Image Retrieval: Theory and. Revista de Informática
Teórica e Aplicada, p. 161–185.
Weber, R., Schek, H. J. & Blott, S., 1998. A Quantitative
Analysis and Performance Study for Similarity-Search
Methods in High-Dimensional Spaces. 24th Int’l Conf.
Very Large Data Bases.
Wei, W. W. S., 1990. Time Series Analysis - Univariate
and Multivariate Methods. Second ed. s.l.:Addison
Wesley.
Wilf, H. S., 2002. Algorithms and Complexity. 2nd ed.
s.l.:A. K. Peters.
ICEIS2013-15thInternationalConferenceonEnterpriseInformationSystems
216
