
A Statistical Decision Tree Algorithm for Data Stream Classification
Mirela Teixeira Cazzolato, Marcela Xavier Ribeiro,
Cristiane Yaguinuma and Marilde Terezinha Prado Santos
Computer Science Department, Federal University of São Carlos, São Carlos, São Paulo, Brazil
Keywords: Data Stream Mining, Classification, Decision Tree, VFDT, StARMiner Tree, Anytime Algorithm.
Abstract: A large amount of data is generated daily. Credit card transactions, monitoring networks, sensors and
telecommunications are some examples among many applications that generate large volumes of data in an
automated way. Data streams storage and knowledge extraction techniques differ from those used on
traditional data. In the context of data stream classification many incremental techniques has been proposed.
In this paper we present an incremental decision tree algorithm called StARMiner Tree (ST), which is based
on Very Fast Decision Tree (VFDT) system, which deals with numerical data and uses a method based on
statistics as a heuristic to decide when to split a node and also to choose the best attribute to be used in the
test at a node. We applied ST in four datasets, two synthetic and two real-world, comparing its performance
to the VFDT. In all experiments ST achieved a better accuracy, dealing well with noise data and describing
well the data from the earliest examples. However, in three of four experiments ST created a bigger tree.
The obtained results indicate that ST is a good classifier using large and smaller datasets, maintaining good
accuracy and execution time.
1 INTRODUCTION
Data streams are obtained continuously, generating
large volumes of data daily. Some characteristics
like storage and knowledge extraction techniques
differ from those used on traditional data. Examples
of these applications are credit card transactions,
sensor networks, financial applications and web
logs.
Knowledge discovery systems are constrained by
three main limited resources: time, memory and
sample size (Domingos and Hulten, 2000).
The classification task aims to build a model to
describe and distinguish classes of data. In
traditional classification, all data is loaded into
memory and then a static model is build. When new
tuples are added, the model must be rebuilt,
considering both the old and the new data. In the
data stream context, incremental techniques should
be used, where there is no need of rebuilding the
model every time that a new example arrives. In
fact, the decision tree is built based on sufficient
statistics extracted from the processed data.
According to (Zia-Ur et al., 2012) the
classification, using a decision tree algorithm, is a
widely studied problem in data streams and the
challenge is when to split a decision node into
multiples leaves.
One of the well-known algorithms for data
streams classification is the VFDT, which uses
Hoeffding bound to guarantee that its output is
asymptotically nearly identical to the output of a
conventional learner (Domingos and Hulten, 2000).
In this paper we present a parametric incremental
decision tree algorithm called StARMiner Tree. It is
based on VFDT and proposes a decision tree model
constructed from numerical data using statistics to
decide when to perform the division of a tree node.
We applied our algorithm in four datasets, two
synthetic and two real-world, comparing the
obtained results with VFDT using large and smaller
datasets.
The paper is organized as follows. Section 2
presents the theoretical background of data streams
classification using decision trees. Section 3 presents
the proposed algorithm, the StARMiner Tree.
Section 4 presents the experiments performed.
Finally, Section 5 summarizes the obtained results.
217
Teixeira Cazzolato M., Xavier Ribeiro M., Yaguinuma C. and Terezinha Prado Santos M..
A Statistical Decision Tree Algorithm for Data Stream Classification.
DOI: 10.5220/0004447202170223
In Proceedings of the 15th International Conference on Enterprise Information Systems (ICEIS-2013), pages 217-223
ISBN: 978-989-8565-59-4
Copyright
c
2013 SCITEPRESS (Science and Technology Publications, Lda.)

2 RELATED WORK
In (Domingos and Hulten, 2000) a basic decision
tree algorithm for data stream classification called
Hoeffding Tree (HT) was presented. In the same
paper, it was proposed the VFDT (Very Fast
Decision Tree) system, which is a framework based
on HT. The VFDT allows the use of Information
Gain and Gini Index as the attribute evaluation
measure and adds several refinements to the original
algorithm. In Figure 1 is shown a version of VFDT,
adapted from (Bifet, 2010).
According to (Domingos and Hulten, 2000), in
order to find the best attribute to test at a given a tree
node, it may be sufficient to consider only a small
subset of training examples that pass through that
node. After processing a given stream of examples,
the first ones will be used to choose the root test.
Once the root attribute is chosen, the next examples
will be passed down to the corresponding leaves and
used to choose the appropriate attributes there, and
so on recursively.
Algorithm: VFDT
1.
Let be a tree with a single leaf (the root)
2. for all training examples do
3.
Sort example into leaf using HT
4.
Update sufficient statistics in
5.
Increment
, the number of examples seen at
6.
if
0 and all examples seen at not
all of same class then
7.
Compute
̅
for each attribute
8.
Let
be the attribute with highest
̅
9.
Let
be the attribute with the second-highes
t
̅
10.
Compute Hoeffding bound
⁄
11.
if
∅
and
̅
̅
then
12.
Replace with an internal node that splits
on
13. for all branches of the split do
14.
Add a new leaf with initialize
d
sufficient statistics
Figure 1: The VFDT Algorithm.
The algorithm starts with a unique node, the root of
the tree (step 1). When a new example arrives, it is
classified to the corresponding leaf, the sufficient
statistics are collected and
, the number of
examples seen at node l, is incremented (steps 3, 4
and 5).
At step 6 it is checked if sufficient examples
were observed at that node, in order to try to split the
node. This is verified using the
parameter
(minimum number of examples that should be read
for the division attempt). Thus, the code block
between steps 6 and 14 is only performed
periodically. At step 6 it is also checked if all data
observed at that node so far belong to the same class.
In steps 7, 8 and 9, a heuristic (criteria) is used to
choose the two best attributes to split the node. To
solve the problem of deciding how many examples
are necessary at each node is used a statistical result
known as the Hoeffding bound.
According to (Domingos and Hulten, 2000): let
be a real-valued random variable whose range is
(e.g., for a probability the range is one, and for an
information gain the range is log, where is the
number of classes). Suppose we have made
independent observations of this variable, and
computed their mean̅. The Hoeffding bound states
that, with probability1, the true mean of the
variable is at least̅, where
ln1
⁄
2
(1)
At step 11, the following conditions are checked:
∅
: if at least one attribute has been selected,
i.e., if the best attribute is not null;
̅
̅
: if the difference between
the two best attributes is greater than ;
: as (the number of observed examples at
that node) increases, tends to decrease. If the two
best attributes have very close values, would be
as small as, which is a tie criterion.
If the conditions at step 11 are satisfied, the leaf
becomes an internal node that divides at
(step
12), and the sufficient statistics at are initialized for
all branches of the split (step 14).
One of the main features of VFDT is its ability to
handle large amounts of data maintaining a good
accuracy, with theoretical guarantees concerning the
use of HB. According to (Zia-Ur et al., 2012) a
disadvantage of being so general is that the HB is
conservative, requiring more examples than
necessary to describe the data.
The VFDT is a very popular classification
algorithm that has been constantly adapted and
modified.
In (Gama et al., 2003) an extension of VFDT
called VFDTc was proposed. It uses Information
Gain, handles with numeric attributes and uses
Naïve Bayes at the leaves, considered by the authors
ICEIS2013-15thInternationalConferenceonEnterpriseInformationSystems
218

a more powerful technique to classify examples.
The OVFDT (Optimized Very Fast Decision
Tree) was proposed in (Yang and Fong, 2011) to
control the tree size while keeping a good accuracy.
According to the authors, this is enabled by using an
adaptive threshold tie and incremental pruning in
tree induction.
In (Chen et al., 2009) the OcVFDT (One-class
Very Fast Decision Tree) algorithm was proposed. It
is based on VFDT and POSC4.5, and it is applied to
one-class classification.
In (Zia-Ur et al., 2012) the authors proposes the
Empirical Bernstein Tree (EBT) that uses empirical
Bernstein’s bound to achieve a better probabilistic
bound on the accuracy of the decision tree.
An important concern regarding the data stream
classification is the concept drift problem, which
occurs when the concept defining the target being
learned begins to shift over time. In (Hulten et al.,
2001) the CVFDT was proposed, an efficient
algorithm for mining decision trees from
continuously-changing data streams, based on
VFDT. The algorithm grows alternatives subtrees,
and whenever current model becomes questionable
it is replaced by a more accurate alternative subtree.
In this paper we propose the StARMiner Tree
(ST) algorithm, which is based on the principles of
VFDT, but utilizes a method based on statistics as a
heuristic to choose the best attribute to be used in the
test at a node.
3 StARMiner TREE
The StARMiner Tree (ST) is a parametric statistical
decision tree algorithm for data streams
classification. The StARMiner (Statistical
Association Rule Miner) algorithm was first
proposed in (Ribeiro et al., 2005) to mine
association rules over continuous feature values. In
this paper, the original algorithm was adapted to
work as an attribute evaluation measure in ST,
verifying when to split a node and which attribute
should be used. The algorithm is presented in Figure
2.
ST handles numerical data, preferably
standardized, and has as input three parameters
(∆
,
and
). As it is possible to observe,
its general structure is very similar to VFDT. We
only describe the steps that differ from the original
algorithm.
Let
be a class (category) and
be an
attribute (feature). At step 4 the statistics updated by
ST are
and
, i.e., the mean and
standard deviation of each attribute according to its
corresponding class.
When a minimal number of examples is
observed, ST selects the attributes that satisfy the
following conditions (steps 7 to 10):
The
attribute should have a behavior at class
different to its behavior in other classes;
The
attribute should present a uniform behavior
at data from class
.
Algorithm: StARMiner Tree
1.
Let be a tree with a single leaf (the root)
2.
for all training examples do
3.
Sort example into leaf using
4.
Update sufficient statistics in
5.
Increment
, the number of examples seen at
6.
if
0 and all examples seen at
not all of same class then
7.
Select attributes that satisfies the condition
∆
8.
Select attributes that satisfies the condition
σ
T
σ
9.
Compute
10.
if at least one attribute is selected and
or
then
11.
Let
be attribute that identifies more
classes, with higher
and
lower
12.
Replace with an internal node that splits
on
13.
to all branches of the split do
14.
Add a new leaf with sufficient
statistics initialized
Figure 2: The StARMiner Tree Algorithm.
To satisfy these conditions, the algorithm uses three
constraints of interest, which must be informed by
the user:
∆
: minimum difference between the means of
attribute
at examples from class
and the other
examples;
: maximum deviation allowed in the attribute
at examples from class
;
: minimum confidence to reject the hypothesis
that the means
and
are
statistically equal at the sets
(examples at class
) and TT
(examples at the other classes).
To reject with confidence equal or greater
than
, the critical values of are calculated, i.e.,
and
, according to the formula (2). The
AStatisticalDecisionTreeAlgorithmforDataStreamClassification
219

rejection regions are illustrated at Figure 3.
|
|
(2)
Figure 3: Rejection Regions.
If just one attribute (
) is selected and the
hypothesis is rejected, the
attribute is chosen to
split the node (step 10). If two or more attributes
satisfy the conditions, at step 11 ST chooses the
attribute
that, respectively, identifies more
classes, have higher
and lower
. Then,
is used for the test node at steps
12, 13 and 14.
4 EXPERIMENTS
In this section we present the experiments performed
using both synthetic and real-world datasets in order
to validate the proposed algorithm, the StARMiner
Tree. This version of ST still does not deal with the
concept drift problem, as well as VFDT, the
algorithm used to compare de obtained results.
4.1 Datasets
We applied our algorithm using four datasets. The
two synthetic datasets used, Hyperplane and
Random RBF, were generated with MOA (Massive
Online Analysis) ¹. The two real-world datasets,
Electricity and Skin Segmentation were obtained,
respectively, at MOA website¹ and at UCI
repository².
The Hyperplane dataset has been set with 5% of
noise, 10 attributes and 5 class values. Random RBF
dataset has been set to generate 5 attributes and 5
class values. Both generated 10 million examples.
The Skin Segmentation dataset contains a
randomly sample of RGB values from face images
of various age groups, race groups and genders. It
has 245,057 examples with three attributes (R, G
and B) and 2 class values, 50,859 skin samples and
194,198 is non-skin samples. We have normalized
the data to achieve a better result with the use of ST.
The last experiment has been performed using
the Electricity dataset. It contains 45,312 instances
collected from the Australian New South Wales
Electricity Market, where prices are not fixed and
are affected by demand and supply of the market.
We have excluded two attributes from the original
dataset (date and day) and normalized all data. The
modified dataset contains 6 numeric attributes with 2
class values, “up” and “down”.
4.2 Configurations
We compare the obtained results using StARMiner
Tree (ST) to VFDT, in terms of accuracy, tree size
and execution time using prequential validation.
The prequential (or interleaved test-then-train)
validation is a scheme used to interleave testing and
training. According to (Partil and Attar, 2011), each
example can be used to test the model before it is
used for training, and from this the accuracy can be
incrementally updated.
We have used two different configurations of ST
for each experiment, referred as ST1 and ST2, in
order to show how different parameters can modify
the obtained results. All the parameters were set by
the user, according to the type of data available.
Every time the obtained results showed low
accuracies, the parameters were modified.
We performed all experiments with the default
parametric values employed in MOA on a Windows
7, Core i7 / 2.8GHz CPU, 8GB memory computer,
considering
200 for all algorithms and
=0.99 for all ST configurations.
In the experiment using the Hyperplane dataset,
ST1 was set with
0.36 and the ST2 with
0.273. Both configurations used ∆
0.14.
Using the Random RBF dataset, ST1 was set
with ∆
0.2 and ST2 with ∆
0.14. Both
used
0.36.
We have tested the model built using the
Hyperplane and the Random RBF datasets at each
500 thousands examples.
In the experiment using Skin Segmentation
dataset, the ST1 was set with ∆
0.01
and
0.04, and the ST2 was set with
∆
0.014 and
0.2. We evaluated the
classification at each 10 thousands examples.
In the last experiment, using the Electricity
dataset the ST1 was set with
0.2 and the
¹MOA: Massive Online Analysis, http://moa.cms.waikato.ac.nz.
²UCI: Machine Learning Repository, http://archive.ics.uci.edu/ml.
ICEIS2013-15thInternationalConferenceonEnterpriseInformationSystems
220

ST2 with
0.186. Both used ∆
0.005.
The evaluation of the model were performed at
each 3 thousands examples.
4.3 Experiments Results
The obtained results are summarized in Table 1,
using the mean accuracy percentage and execution
time of each experiment. Figure 4 shows the
percentage of correct classifications and tree size
according to the number of examples.
Table 1: Experiments results.
Datasets
Mean Accuracy / % Execution Time / s
VFDT ST1 ST2 VFDT ST1 ST2
Hyperplane 91.29 91.35 91.04 56.01 39.86 40.41
RBF 75.45 76.24 77.88 44.94 39.83 46.66
Skin Seg. 98.80 99.68 99.24 0.57 0.57 0.55
Electricity 77.44 78.91 78.53 0.25 0.40 0.39
As we can observe in Table 1, using the Hyperplane
dataset ST1 has obtained the best mean accuracy and
execution time, with 91.35% in 39.86 seconds,
followed respectively by VFDT with 91.29% in
56.01 seconds and ST2 with 91.04% in 40.41
seconds. In Figure 4 (a) it is possible to observe that
the algorithms had similar accuracy variations. ST2
finished the classification process with the best final
accuracy, 92.6%, and the smallest tree, with 503
nodes, according to Figure 4 (b). VFDT reached
92.1% of accuracy with 6,637 nodes and ST1
achieved 91.6% with 861 nodes. ST handled with
noise better than VFDT, achieving the highest mean
and final accuracy, building the smallest tree and
obtaining the best execution time.
According to Table 1, in the experiment using
the Random RBF dataset, ST obtained the best mean
accuracy in both configurations of ST. ST2 has
obtained the best mean accuracy with 77.88% in
46.66 seconds. The second higher accuracy has been
achieved by ST1 with 76.24% with accuracy in
39.83 seconds (the best execution time) and VFDT
has obtained 75.45% of mean accuracy in 44.94
seconds (the second best execution time). Figure 4
(c) shows that ST2 had the best accuracy in almost
all the time, finalizing the classification with 77.8%,
but with a bigger tree, as it is possible to see in
Figure 4 (d), with 9,735 nodes. The final accuracy of
ST1 and VFDT were, respectively, 77.7% with
2,391 nodes and 76.9% with 1,593 nodes. In general,
using Random RBF dataset, ST achieved the best
accuracy with a good execution time, in comparison
with VFDT. Although ST2 obtained the best
accuracy variation, it has created the biggest tree.
Using the Skin Segmentation dataset, ST also
obtained the best mean accuracy in both
configurations of ST, as it is possible to observe in
Table 1. ST1 achieved the best mean accuracy,
99.68% in 0.57 seconds, followed by ST2 with
99.24% of accuracy in 0.55 seconds, the best
execution time, and VFDT with 98.8% of accuracy
in 0.57 seconds.
Figure 4 (e) and (f) shows that ST1 had the best
accuracy during all the classification process and
generated the larger tree, finishing with 99.9% of
accuracy with 189 nodes. Although VFDT and ST2
achieved lower accuracies, they generated the
smaller trees with, respectively, 99.2% of accuracy
with 95 nodes and 98.9% of accuracy with 127
nodes.
As it is possible to observe in Table 1, using the
Electricity dataset ST2 and ST1 achieved the best
mean accuracies, with 78.91% of accuracy in 0.4
seconds and 78.53% of accuracy in 0.39 seconds,
respectively. VFDT has obtained 77.44% of mean
accuracy in 0.25 seconds, the smallest execution
time.
According to Figure 4 (g) and (h) all algorithms
obtained a similar variation of accuracy, while
VFDT produced the smallest tree. VFDT, ST1 and
ST2 achieved as final accuracy 77.8% with 47
nodes, 81.7% with 313 nodes and 80.2% with 309
nodes, respectively.
As it is possible to observe in Figure 4, in the
first examples processed, ST described the data first
than VFDT, which needed more examples to
improve its accuracy.
Although in three experiments ST constructed
bigger trees, the execution time obtained was close
(when not lower) in comparison to VFDT.
According the obtained results and the
configurations used, it is possible to conclude that
combining different values for the ST parameters
∆μ
and σ
, the algorithm can achieve a better
accuracy result, but sometimes creating a bigger
tree. Thus, the user can modify the parameters
values in order to achieve a higher accuracy
according to the total of data and memory available.
AStatisticalDecisionTreeAlgorithmforDataStreamClassification
221
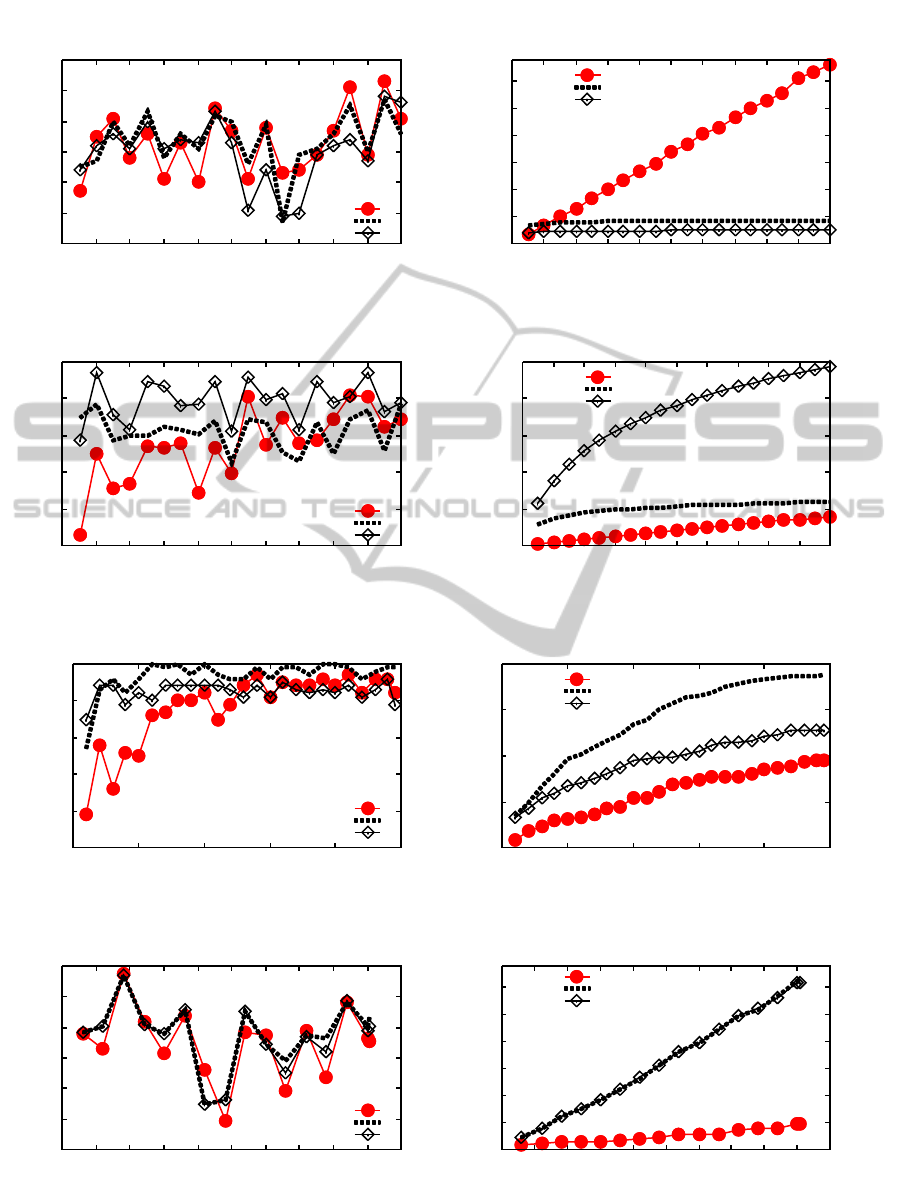
Figure 4: Accuracy and tree size (number of nodes) obtained.
88
89
90
91
92
93
94
0 1 2 3 4 5 6 7 8 9 10
% correct
number of examples (milions)
(a) Hyperplane Dataset
VFDT
ST1
ST2
0
1000
2000
3000
4000
5000
6000
0 1 2 3 4 5 6 7 8 9 10
tree size (nodes)
number of examples (milions)
(b) Hyperplane Dataset
VFDT
ST1
ST2
70
72
74
76
78
80
0 1 2 3 4 5 6 7 8 9 10
% correct
number of examples (milions)
(c) Random RBF Dataset
VFDT
ST1
ST2
0
2000
4000
6000
8000
10000
0 1 2 3 4 5 6 7 8 9 10
tree size (nodes)
number of examples (milions)
(d) Random RBF Dataset
VFDT
ST1
ST2
95
96
97
98
99
100
0 50 100 150 200 250
% correct
number of examples (thousands)
(e) Skin Segmentation Dataset
VFDT
ST1
ST2
0
50
100
150
200
0 50 100 150 200 250
tree size (nodes)
number of examples (thousands)
(f) Skin Segmentation Dataset
VFDT
ST1
ST2
60
65
70
75
80
85
90
0 5 10 15 20 25 30 35 40 45 50
% correct
number of examples (thousands)
(g) Electricity Dataset
VFDT
ST1
ST2
0
50
100
150
200
250
300
0 5 10 15 20 25 30 35 40 45 50
tree size (nodes)
number of examples (thousands)
(h) Electricity Dataset
VFDT
ST1
ST2
ICEIS2013-15thInternationalConferenceonEnterpriseInformationSystems
222

5 CONCLUSIONS
In this paper we introduced the StARMiner Tree a
statistical decision tree algorithm for data streams
classification.
The experiments described of both synthetic and
real-world datasets show that the StARMiner Tree is
a good alternative for data streams classification
maintaining good accuracy and execution time.
In all experiments ST presented at least one
configuration with the best mean and final accuracy,
in comparison with VFDT. In terms of execution
time, VFDT was faster than ST only using the
Electricity dataset. Although the good accuracy and
execution time results, ST constructed the biggest
tree in three of four experiments.
Another concern regarding the data stream
classification is the concept drift problem, which
occurs when the concept defining the target being
learned begins to shift over time.
As future work we intent to add an automatic
estimation of the StARMiner parameters. We also
intent to extend StARMiner Tree in order to deal
with the concept drift problem.
ACKNOWLEDGEMENTS
We would like to thank CNPq, CAPES and FAPESP
for the financial support.
REFERENCES
Bifet, A.. 2010. Adaptive Stream Mining: Pattern
Learning and Mining from Evolving Data Streams.
Ebsco Publishing, ISBN 9781607504726.
Chen Li, Zhang, Y., Xue Li, 2009. OcVFDT: one-class
very fast decision tree for one-class classification of
data streams. Proceedings of the Third International
Workshop on Knowledge Discovery from Sensor Data.
Paris, France: ACM.
Domingos, P., Hulten, G, 2000. Mining High-Speed Data
Streams. Proceedings of the Sixth ACM SIGKDD
International Conference on Knowledge Discovery
and Data Mining. Boston, Massachusetts, United
States: ACM: 71-80.
Gama, J., Rocha, R., Medas, P., 2003. Accurate decision
trees for mining high-speed data streams. Proceedings
of The Ninth ACM SIGKDD International Conference
on Knowledge Discovery and Data Mining.
Washington, D.C.: ACM: 523-528.
Hulten, G., Spencer, L., Domingos, P., 2001. Mining time-
changing data streams. Proceedings of the seventh
ACM SIGKDD international conference on
Knowledge Discovery and Data Mining. San
Francisco, California: ACM.
Partil, A., Attar, V., 2011. Framework for Performance
Comparison of Classifiers. In: Proceedings of the
International Conference on Soft Computing for
Problem Solving (SocProS 2011). December 20-22,
2011.
Ribeiro, M. X., Balan, A. G. R., Felipe, J. C., Traina, A. J.
M., Traina Jr., C., 2005. Mining Statistical Association
Rules to Select the Most Relevant Medical Image
Features. First International Workshop on Mining
Complex Data (IEEE MCD'05), Houston, USA. IEEE
Computer Society, 91-98.
Yang, H., Fong, S., 2011. Optimized very fast decision
tree with balanced classification accuracy and compact
tree size. In 3rd International Conference on Data
Mining and Intelligent Information Technology
Applications (ICMiA), 2011, 24-26 Oct. 57-64.
Zia-Ur Rehman, M., Tian-Rui Li, Tao Li, 2012. Exploiting
empirical variance for data stream classification.
Journal of Shanghai Jiaotong University (Science),
vol. 17, 245-250.
AStatisticalDecisionTreeAlgorithmforDataStreamClassification
223
