
Social Data Sentiment Analysis in Smart Environments
Extending Dual Polarities for Crowd Pulse Capturing
Athena Vakali
1
, Despoina Chatzakou
1
, Vassiliki Koutsonikola
1
and Georgios Andreadis
2
1
Informatics Department, Aristotle University, Thessaloniki, Greece
2
School of Engineering, Aristotle University, Thessaloniki, Greece
Keywords: Sentiment Analysis, Social Data Processing and Social Networking, Microblogging Data Analysis, Mobile
Applications.
Abstract: Social networks drive todays opinion and content diffusion. Humans interact in social media on the basis of
their emotional states and it is important to capture people emotional scales for a particular theme. Such
interactions are facilitated and become evident in smart environments characterized by mobile devices and
new smart city contexts. This work proposes a sentiment analysis approach which extends positive and
negative polarity in higher and wider emotional scales to offer new smart services over mobile devices. A
particular methodology and a generic framework is outlined along with indicative mobile applications
which employs microblogging data analysis for chosen topics, locations and time. These applications
capture crowd pulse as expressed in microblogging platforms and such an analysis is beneficial for various
communities such as policy makers, authorities and the public.
1 INTRODUCTION
Social networks have drastically increased online
communication and human interactions, since
millions of users share opinions on a variety of
topics. Such activities embed both objective and
subjective criteria and certainly human reactions
govern social media diffusion. Sentiment analysis in
social media has gained considerable ground lately
since it facilitates human behaviour, responsiveness
and reactions understanding. Positive, negative and
neutral opinions are now declared, triggered and
visualized in most of the current social media
applications. Expressing such opinions and senses is
important to the markets and to stakeholders since
they can accordingly suggest, and apply policies and
services according to the social crowd opinions.
This work addresses the challenge to go beyond
such typical dual (positive and negative) polarity
since humans are certainly acting via wider and
more complicated emotional processes. Detecting,
summarizing and visualizing emotions in a
technically sound manner is important for capturing
social pulse, particularly when certain topics,
locations and timing are critical for decisions and
recommendations. Here, a method for extracting
social media affective knowledge is introduced on
the basis of a wider spectrum of six basic emotions
identified as seminal ones in the psychology
discipline. The purpose of this work is capturing the
crowd pulse by understanding people’s emotions as
expressed in social media platforms. Such capturing
is employed implicitly via computational methods
which overcome limitations of the dual
positive/negative analysis. Emotions’ intensity, is
surely important in social media activities and here
also the emotional states of socially circulated
information is considered with emphasis on the
smart contextual environment (such as a smart city).
The proposed analysis can be applied to a variety
of social media applications and initially
microblogging data streams are considered since
people interact in such platforms in an emotionally
driven freely manner which involves brief
information fragments but in an attitude inherent and
opinionated manner. Moreover, in microblogging
platforms (such as Twitter) people express their
opinions for different events which are underway in
smart different places of the world, and at different
time period. It is evident that mining and analysis of
microblogging data is important and necessary to
recognize interesting trends and opinions for
different topics and mobile smart devices offer
opportunities for instant opinion expression and
175
Vakali A., Chatzakou D., Koutsonikola V. and Andreadis G..
Social Data Sentiment Analysis in Smart Environments - Extending Dual Polarities for Crowd Pulse Capturing.
DOI: 10.5220/0004478401750182
In Proceedings of the 2nd International Conference on Data Technologies and Applications (DATA-2013), pages 175-182
ISBN: 978-989-8565-67-9
Copyright
c
2013 SCITEPRESS (Science and Technology Publications, Lda.)

sentiment indications.
In this context, the contribution of this work is
summarized in the following:
overcome dual (positive and negative) social
networking data analysis with the use of a wider
emotional spectrum;
propose a flexible method which takes into
consideration many linguistic parameters, such
as the intensifiers and the valence shifters
(negation words), in order to understand the
emotions that are being expressed in micro-
blogs;
characterize data fragments (microblogging
posts) in terms of their semantics in relevance to
a defined topic, their emotional intensity and
valence, by the use of particular lexicons and
dictionaries;
propose a generic 3-tier framework which can
support mobile applications development with
inclusion of the proposed methodology which is
emotion-driven.
In the next sections social networks (and
microblogging in particular) sentiment analysis
efforts are summarized with emphasis on the role of
emotion to social networks data analysis. In Section
3, the role of emotions is emphasized for applying
affective analysis in social (microblogging) data
streams. In Section 4 a particular generic
implementation framework is outlined and an
indicative smart environment oriented mobile
application is highlighted in Section 5. Finally
conclusions and future work are summarized in
Section 6.
2 MICROBLOGGING
SENTIMENT ANALYSIS
AND BEYOND
Social networks offer services where users can post
information at anytime and anywhere in various
ways. Especially micro-blogs gain more and more
recognition for their real time characteristics and
short format. Extracting and analyzing the content of
them, so as to capture the emotional trends of
publishers, is considered too important. The goal of
affective analysis is to capture the wisdom of the
crowds, as well as the social pulse and the trends,
since information is valuable for improving social
network services in a wide spectrum of applications.
Defining the term “emotion” is a thoroughly
discussed issue and it certainly covers several angles
of human behaviour, especially when acting at a
social network. Here, we follow the definition given
by (Scherer, 2001), where emotion is defined as “an
episode of interrelated, synchronized changes in the
states of all or most of the five organismic
subsystems in response to the evaluation of an
external or internal stimulus event as relevant to
major concerns of the organism” with the five
subsystems being:
information processing subsystem: is responsible
for internal and external stimulus evaluation. The
system is seen as continuously scanning the
environment and internal feedback signals in
order to determine the significance of stimulus
events;
support subsystem: is responsible for the internal
regulation of the organism, especially the
generation of energy resources for action;
executive subsystem: is involved in planning,
decision making and the preparation of action;
action subsystem: is related to the
communication of reaction and intention through
motor expression and the execution of skeletal
movement for purposeful action;
monitoring subsystem: is conceptualized as a
control system that reflects the current state of all
other subsystems.
These subsystems coordinate human behaviour and
are critical in human reactions so it is important to
proceed to sentiment analysis under their inclusion
in the process of social network data analysis. It is
moreover true that the above subsystems are
interrelated and any change in one subsystem will
lead to corresponding changes in others. So, it seems
reasonably to view emotion as a process with
constantly changing subsystem states. Work carried
out here focuses on capturing the social networking
activities which are of relevance to the information
processing and executive subsystems. This is
employed by integrating affective analysis which
focuses on emotions tracking (relevant to decision
making) with sentiment analysis which focuses on
opinions tracking (relevant to stimulus evaluation).
Microblog posts are of short text but they embed
links to other pieces of information (such as URLs)
and also users linkage can be tracked on the basis of
their common activity. Up to now sentiment analysis
in social networks was carried out targeting mostly
the level of the human emotion information
processing subsystem. For example, this is verified
by the fact that earlier approaches were scanning
human phrases to reveal and estimate their stimulus
triggering ability and they didn’t extend this to the
DATA2013-2ndInternationalConferenceonDataManagementTechnologiesandApplications
176

executive part which involves far more processes
(such as emotion-aware analysis and planning).
Typically, in earlier relevant work document and
resource level sentiment analysis sets as the
objective to determine whether an entire document
or a resource is positive, negative or neutral. This is
aimed in order to identify users stimulus and opinion
state. For example, in (Turney, 2002) an
unsupervised learning algorithm is presented for
classifying reviews into positive and negative ones.
This is carried out by initially extracting phrases
with adjective and adverbs and then estimating
semantic orientation of extracted phrases via a sum
of scores of each phrase. Pang et al. In (Pang, Lee,
and Vaithyanathan 2002) study the problem of
classifying documents based on overall sentiment
(positive/negative) of a document whereas in
(Benamara et al., 2007) an approach focuses on
text’s orientation and a sentiment analysis technique
uses a linguistic analysis of adverbs. Moreover, in
(Godbole et al., 2005) a system that assigns scores
indicating positive or negative opinions from texts
relevant to news and blogs is developed.
In sentence level sentiment analysis usually there
are two basic steps: determine the
subjectivity/objectivity score of each sentence and
further classify and determine whether subjective
sentences are positive or negative. In (Yessenalina
and Cardie 2011) new methods are presented
through which the sentences are categorized based
on how positive, negative or neutral they are. In (Pak
and Paroubek 2010); (O’Connor et al., 2010)
sentiment classifiers are utilized to determine how
positive, negative and neutral the messages derived
from Twitter are. More specifically, in (Pak and
Paroubek, 2010) they build a classifier that is able to
determine positive, negative and neutral sentiments
of tweets. In (O’Connor et al., 2010) a system is
introduced to compare the explicit knowledge taken
from twitter with the polls’ data (use of polls data as
ground truth). In (Yessenalina and Cardie 2011) the
orientation of each sentence of a text corpus is
recognized, but also the intensity of a text in a five-
scale system (very negative, negative, neutral,
positive, and very positive) is determined.
According to the authors’ knowledge, few of
earlier work has followed the direction of
categorizing microblogging based on some specific
primary or basic emotions. In (Gill et al., 2008) and
(Tsagkalidou et al., 2011) emotional classification
sets eight primary emotions (“fear, anger, disgust,
sadness, acceptance, anticipation, joy, surprise”) and
they proceed to affective analysis towards creating
groups of users that share the same emotions on
specific topics in Twitter. In the same context
(Bollen et al., 2010) use a Profile of Mood States
(POMS) as a psychometric instrument, and focus is
placed on six basic emotions, namely the “tension,
depression, anger, vigor, fatigue, confusion”, to
perform affective analysis of tweets.
This work addresses the open problem of
determining specific emotion scales along with their
intensity and valence in a social networking activity
(such as in a microblog), since this is important for
emotionally driven human reaction and execution
decisions, especially in todays smart environments.
The contribution of the proposed work is that users
opinions and orientation are estimated at a fine
grained level which considers the particular
emotions of importance to the information
processing and execution reactions.
3 ROLE OF EMOTIONS IN
MICROBLOGGING DATA
ANALYSIS
For successfully applying sentiment and affective
analysis it is very important to carefully design the
processes of relevance to human behaviour on one
hand and to computational needs on the other. This
is highly required in todays smart environments
which involve multi devices of mobile nature
utilized in technologically advanced contexts (such
as in smart cities).
Figure 1: Role of emotion in social networks ecosystem.
As depicted in Figure 1, at the real social
networking ecosystem many parameters and
activities are involved. If microblogging is used as a
case study, it is obvious that people in such
applications (e.g. in Twitter) post and highlight
SocialDataSentimentAnalysisinSmartEnvironments-ExtendingDualPolaritiesforCrowdPulseCapturing
177

information on the basis of their interests. They do
so at a particular time, place and context. This
emerging and often bursty activity is then perceived
by other people who proceed to specific actions on
the basis of their emotions and opinions. When
employing such microblogging data analysis it is
therefore important to increase awareness in terms of
users emotional drive and its role in decision making
Microblogging data are of brief nature (e.g. tweets
are of maximum 140 characters), and they embed
free text shortcomings mainly due to the users
freestyle and informal writing (e.g. abbreviations,
shortcuts, symbols etc). Therefore, language
inconsistencies are raising challenges in
microblogging data collections generation and no
qualitative guarantees can be ensured for a proper
sentiment and affective analysis.
It is obvious that out of a microblogging dataset,
some part of content will be emotionally relevant
and the rest has no contribution in the sentiment
and/or affect analysis. Therefore, an emotional
characterization of the data is needed in order to
keep and work with the particular data which carry
emotional information and is of importance for users
decisions and actions. To proceed at an emotional
aware microblogging data processing and
understanding, which will show a level of stability,
specific principles are needed and highlighted here.
Figure 2 summarizes the principles required in
sentiment and affect analysis. These principles aim
at understanding the specific emotion relevant
subsystems (described in Section 2) of information
processing and execution which are critical in
humans reaching decisions and actions. The
principles suggested here embed both qualitative and
quantitative criteria in order to cover human
emotional and computational scales. At the
qualitative part, the six emotional scale proposed by
(Eckman et al., 1982) is followed since it is widely
used in the bibliography and it has shown accurate
emotional capturing in text collections. At the
quantitative part, specific measurement for these
emotions are used in order to identify emotional
strength and orientation.
The proposed spectrum of emotions is defined on
the basis of six distinct primary emotions which
form the emotional states in a low-dimensional
space. The six primary emotions used are: “anger”,
“disgust”, “fear”, “joy”, “sadness”, and “surprise”
(Eckman et al., 1982). These emotions set the
ground for the microblogging data analysis, since by
using them each microblogging piece of data (e.g. a
preprocessed tweet content) can be comparatively
expressed with respect to each of these emotions.
Based on the above, we characterize the
emotional nature of each tweet by an emo(tweet)
function (Definition 2.1). This function is easily
used to calculate each tweet’s relevance to each of
the six primary emotions, taking into consideration
the final set of words which represent the tweet.
Figure 2: Sentiment and affect analysis principles.
Definition 2.1: The emotional proximity of a
particular tweet with respect to the particular
emotion scale of six emotions
6,...,1ie
i
is
defined by :
tweet words
ii
j1
emo (tweet) simscore( j, e )
(1)
The
),(
i
ejsimscore
value is proposed to capture
the “distance” of each word j of the tweet for each of
the
6,...,1
ie
i
emotions. To estimate such
distance in practice any semantic lexicon (such as
Wordnet) can be utilized. Such lexicons are typically
organized in groups of words which are sets of
cognitive synonyms (so-called synsets) and on top of
them some similarity measures are suggested. These
similarities return a score which expresses the
semantic proximity of two words, i.e. two words are
considered as similar on the basis of the different
definitions of a word but also on the relationships
among word semantic taxonomies and hierarchies.
Two crucial parameters are used in order to
facilitate a computational procedure which will
complement semantics with emotional scaling:
the intensity, which captures the degree of the
emotional excitement and here intensity is used to
define the tweet’s strength of the emotion, i.e. the
DATA2013-2ndInternationalConferenceonDataManagementTechnologiesandApplications
178
degree and power of a tweet expressed emotion. A
list of intensifiers is available in the bibliography
and a particular list with intensifier scores is used
here (Maite et al., 2010).
Definition 2.2: The emotional intensity of a
particular tweet is characterized by the tweet’s
words which are empowered intensifiers and it is
defined by:
tweet _ words
ii
j1
intens (tweet) int( j)*simscore(j, e )
(2)
where int(j)=1 only if the j word belongs to the
above intensifier set (else it is 0).
Equation (2) analyzes the intensity evaluation for
a tweet so it is obvious that only the words declared
as intensifiers contribute to the tweet’s intensity
characterization.
the valence, which refers to the negative or
positive emotional value assigned by a person to
another person, event, goal, object and outcome,
based on its attractiveness. In our case valence is
used to captures the orientation of a tweet’s
emotion. This is employed by capturing
“semantic orientation” of positiveness or
negativeness embedded in a tweet’s word or
phrases. In practice this can be realized via the so
called valence shifters which are developed here
on the idea that typically, valence shifters reverse
word’s polarities (e.g. words like “not”, “aren’t”
etc) so their shifting capability should be
carefully considered.
Definition 2.3: The valence orientation of a
particular tweet is characterized by the tweet’s
words which are shifting and reverse polarities and it
is defined by:
tweet _ words
ii
j1
valens (tweet) val( j) * simscore( j, e )
(3)
where val(j)=1 only if the j word belongs to the
defined word shifters set (else it is 0).
The above defined measures enable extending
tweets semantics with capabilities of discovering
tweets emotional relevance as well as quantifying
emotional degrees. This is rather important since
social network users surely react driven by their
emotional excitement which leads to strong and
often shifting terms postings.
4 ROLE OF EMOTIONS IN
MICROBLOGGING DATA
ANALYSIS
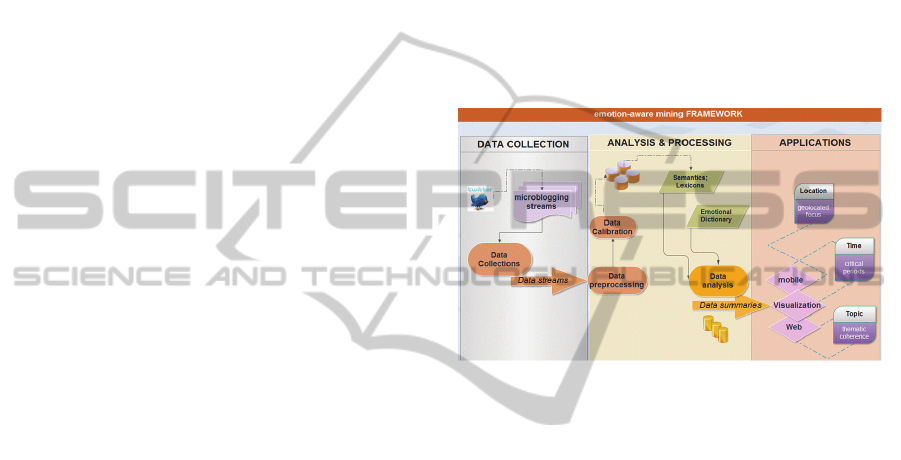
Based on the introduced principles, a generic 3-tier
framework is outlined in Figure 3, involving
appropriate data collection, data analysis and
processing, as well as applications parts. Each of the
tiers interacts with its sequencing tier to proceed
from raw to emotionally relevant and clean data, and
from analysis and processing to particular
applications which can address specific criteria
(such as time, location and topic).
Figure 3: A 3-tier framework for emotion-aware
microblogging analysis and application.
4.1 The Data Collection Tier
The initial tier involves the collection of various
topic-driven datasets derived from microblogging
services (in our case Twitter) as depicted in Figure
3. The data collection is performed using the Twitter
streaming API which collects data on the basis of a
set of keywords which are representatives of the
topics used for analysis. The retrieved data includes
the actual tweets text as well as the timespan and
locality information that will be useful for further
analysis and knowledge extraction. Over such data
collections, the emotional evolution over time along
with the geographical distribution of emotions for a
particular topic can be examined.
The collected datasets can be relevant to various
topics in order to trigger and capture different
emotional behaviours in smart environments. The
proposed methodology is not restricted in a specific
topic set but it can be applied for every theme which
is characterized by a set of keywords. When data
collection is completed, an advanced processing
must take place that will lead to accurate and valid
results. This procedure involves the removal of the
semantically invalid information, eliminating, thus,
SocialDataSentimentAnalysisinSmartEnvironments-ExtendingDualPolaritiesforCrowdPulseCapturing
179

the existing noise. Without the application of an
extended processing of the datasets the resulting
methodology would be time consuming and less
stable. Thus, the datastreams should then proceed to
a particular pre-processing phase.
4.2 The Analysis and Processing Tier
Data collection process is followed by data
processing and analysis. The data calibration
constitutes a very important step in the whole
procedure, resulting to an appropriate data
formulation. As it was referred previously, the data
cleaning contains the removal of the tweet’s words
that are not semantically valid. Such semantically
invalid text involves words with no emotional
substance and also unusual words that do not
correspond to any English formulation according to
a dictionary (here we focus on an analysis outline
which uses content in the English language).
The next step is the similarity capturing of the
“clean tweets” in terms of the six primary emotions.
These primary emotions are able to capture the total
spectrum of expressed emotional situations of each
person in quite satisfactory extent. Given the
semantic lexicons, the calculation of the correlation
degree between the tweet’s words and the six
emotional states is based on the equation (1). For the
calculation of the emotional score of the tweet’s
words, emotional dictionaries are used. For the
scores computation, the intensifiers (equation 2) and
the valence shifters (equation 3) are taken into
consideration.
Given the calculated relations between tweets
and the six primary emotions the next step is the
data analysis through the data summary. Data
analysis may include various methodologies from
mining and machine learning. For example
algorithms such as k-means can be used for
grouping tweets with similar expressions towards
the six primary emotions. Here we follow a simple
classification approach that organizes the tweets by
defining a number of scales. Each scale represents a
different intensity level for each emotion for the
whole set of tweets. Organizing tweets in such a
manner is quite useful in recognizing patterns of
humans’ behaviour in relevance to different issues.
The proposed methodology is quite efficient in
capturing and understanding crowds’ emotions in an
implicit manner via computational methods. The
emotional aware clustering approach on the basis of
the wide spectrum of the primary emotions leads in
extraction of valid information that can be used later
for observing further conclusions.
4.3 The Implementation
and Applications Tier
At this tier particular visualization of the results can
be exposed in Web and/or mobile applications which
can range to various thematic disciplines and which
can be multi-criteria driven . More specifically such
criteria which can be taken into account in todays
social focused applications are location, time, and
topic (as emphasized in Figure 3). It is true that such
intelligent and collective information retrieval
methodologies can be used by a wide range of
applications which will integrate a geolocated
focused and time-aware system, based on a specific
topic. Another criterion is the operating platform, so
an application can be suitable for web, for mobiles
or for both of them.
The emotional patterns detected through the
proposed here methodology is of interest to a wide
range of market stakeholders, such as authorities,
companies, policy makers and the public. These
technologies can support companies to track the
current trends and adjust their communication
strategies, towards increasing quality of services and
their customers’ level of satisfaction. Additionally,
by applying such kind of methodologies in
microblogs’ data, the provided information is
organized in a more efficient way, making people’s
navigation and knowledge extraction easier and
more efficient.
5 CROWD PULSE DETECTION
IN SMART MOBILE
APPLICATIONS
Here, the proposed principles and methodology are
validated by mobile application tools which are
capturing the emotional patterns in microblogging
(twitter’s content) data streams over specific
contexts and smart locations. A more fine-grained
analysis is followed with widening emotions to the
six-class spectrum along with emotion intensity for a
particular topic/product, at a particular area and at a
particular time period. The proposed mobile
application offers further functionality with a map-
based representation, which displays distribution of
emotions for a particular topic and an appealing
visualization which depicts emotions’ dispersion of
a specific topic and/or a specific location. Two case
studies are summarized here, one for a smart city
orientation and the other for an entertainment topic.
These case studies are highlighted since they both
DATA2013-2ndInternationalConferenceonDataManagementTechnologiesandApplications
180
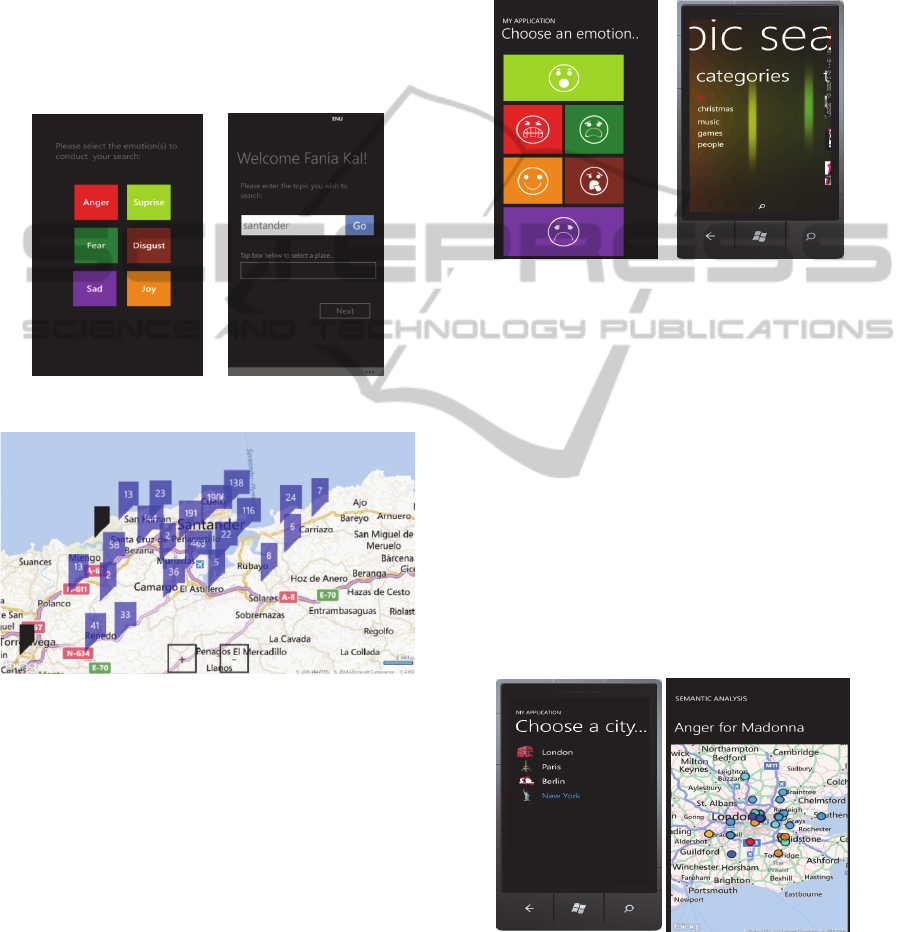
exhibit high emotional users involvement.
5.1 Smart City Pulses
The smart city case study is relevant to the area of
Santander in Spain which is implementing a large
smart city project (http://www.smartsantander.eu/).
Figure 4 summarizes the initial mobile screen of the
mobile application (implemented in Windows 7
environment), where the user can select between the
six primary emotions (anger, disgust, fear, joy,
sadness and surprise) at the Santander area.
Figure 4: A smart city emotion-aware mobile application.
Figure 5: A Smart City emotional dispersion for Surprise.
Upon user’s choice of a sentiment at the back
end of the application the proposed methodology is
applied and the sentiment analysis reveals the
dispersion of tweets in the particular smart city area.
The geographical visualization of tweets
facilitates emotion capturing and understanding. For
example, in Figure 5 the choice of the particular
emotion of “surprise” is depicted with particular
emotion dispersion which also summarizes the
quantitative microblogging activity with respect to
this emotion (expressed in number of twetts).
5.2 Crowd Pulse and Infotainment
Figure 6 summarizes the initial mobile screens of a
mobile application (available in Windows phone and
Android versions), where again user selects among
the six primary emotions (anger, disgust, fear, joy,
sadness and surprise) as well as the particular topic
(out of an indicative list). When the user has selected
a specific emotion, topic and location, a three
options navigation is allowed.
Figure 6: Emotion and criteria selection.
Figure 7 provides the first user’s option which
presents a graphical representation, in the form of
marker map that shows the distribution of emotions.
Each marker in the map represents the emotional
intensity of a tweet which appears on the map
according to its coordinates. The users can zoom-in
in order to see the coordinates and the intensity of
each tweet.
Another option for users will be the graphical
representation in the form of heat maps that
represent the intensity of emotions for a specific
emotion and topic in a particular area. Finally, the
user will have the possibility to see the distribution
of the emotions in city and country level in
relevance to a particular topic.
Figure 7: Location and emotion spectrum visualization.
The proposed application aims at covering
already available mobile tools which suffer from
qualitative results. This holds since the Web and
mobile market is dominated by the dual
SocialDataSentimentAnalysisinSmartEnvironments-ExtendingDualPolaritiesforCrowdPulseCapturing
181

(positive/negative) visualization of trends and
events, with only few of them embedding neutral
opinions. The innovation of the proposed tools is
that it is not limited in a positive-negative scale, but
it is extended in order to capture a wider spectrum of
humans’ emotions.
The graphical representation of humans’
emotions on maps leads to easier understandable and
efficiently organized results. The tool can be useful
for the identification of social trends and events’
impact. It can also provide an unprecedented level of
analytics for companies interested in promoting their
presence and products, authorities interested in
promoting a better way of living in particular
geographical context, and individual users
depending on their specific needs.
6 CONCLUSIONS
Micro-blogging services (especially Twitter) has
brought much attention recently as a hot research
topic in the domain of sentiment analysis. Existing
approaches mainly focus on the evaluation of tweets
emotional orientation on a dual basis i.e. positive or
negative. Our work, offers a 3-tier framework for
emotion-aware microblogging analysis, and extends
this emotional spectrum in six emotions, offering
thus a more fine-grained analysis of users’ emotions.
The overall process is based on emotional
dictionaries and considers linguistic parameters,
(intensifiers and valence shifters), to result in a more
accurate evaluation of the expressed emotions. The
proposed framework is the basis for mobile
applications which summarize and depict crowds’
emotions towards a specific topic and within a
certain locality. Such mobile application tools are of
great importance in capturing branding success,
diffusion in market and emotional states in relevance
to different topics (such as events, campaigns etc),
as expressed by people.
In the future we aim to extend our work by
incorporating more multi-language dictionaries that
will make possible the analysis of tweets written in
languages other than English and also to enhance
offered services to more areas and thematic
categories. Particular clustering algorithms are under
development for summarizing microblogging posts
in a more efficient manner.
REFERENCES
Benamara F., Cesarano C., and Reforgiato D., 2007.
“Sentiment Analysis: Adjectives and Adverbs are
better than Adjectives Alone”, AAAI International
Conference on Weblogs and Social Media Boulder,
CO USA.
Bollen J., Pepe A., and Mao H. 2010. “Modeling public
mood and emotion: Twitter sentiment and socio-
economic phenomena”, International Conference on
WWW2010, April 26-30, 2010, Raleigh, North
Carolina.
Ekman, P., Friesen, W. V., & Ellsworth, P., 1982. “What
emotion categories or dimensions can observers judge
from facial behavior?” In Emotion in the human face,
pp. 39-55. Cambridge University Press, 1982.
Gill A. J., French R. M., Gerle D. and Oberlander J., 2008.
“Identifying Emotional Characteristics from Short
Blog Texts”, Proc. of the 30th Annual Conference of
the Cognitive Science Society, 2237-2242, 2008.
Godbole N., Srinivasaiah M., and Skiena S., 2007. “Large-
Scale Sentiment Analysis for News and Blogs”, AAAI
International Conference on Weblogs and Social
Media (ICWSM’ 2007) Boulder, Colorado, USA.
Maite T., Julian B., Milan T., Kimblerly V., Manfred S.,
2010. “Lexicon-Based Methods for Sentiment
Analysis”, Association for Computational Linguistics.
O’ Connor B., Balasubramanyan R., Routledge B. R. and
Smith N. A., 2010. “From Tweets to Polls: Linking
Text Sentiment to Public Opinion Time Series”, Proc.
of the International AAAI conference on Weblogs and
Social Media, Washington DC, 2010
Pak A., Paroubek P., 2010. “Twitter as a corpus for
Sentiment Analysis and Opinion Mining”, Proc. of the
7th conference on International Language Resources
and Evaluation, 1320-1326, 2010.
Pang B., Lee L., and Vaithyanathan S., 2002. “Thumbs
up? Sentiment Classification using Machine Learning
Techniques”, Proc. of the Conference on Empirical
Methods in Natural Language Processing (EMNLP).
Scherer, K.R., 2001. “Appraisal Considered as a Process
of Multi-Level Sequential Checking”, in Appraisal
Processes in Emotion: Theory, Methods, Research, pp.
92–120, Oxford University Press.
Tsagkalidou K., Koutsonikola V., Vakali A., Kafetsios K.,
2011. “Emotional aware clustering on micro blogging
sources”, In ACII'11 Proceedings of the 4th
International conference on Affective Computing and
Intelligent Interaction pp.387-396.
Turney, P., 2002. “Thumbs Up or Thumbs Down?
Semantic Orientation Applied to Unsupervised
Classification of Reviews”, Proc. 40th Annual Meeting
of the Association for Computational Linguistics.
Yessenalina A., Cardie C., 2011. “Compositional Matrix-
Space Models for Sentiment Analysis”, Proc. of the
2011 Conference on Empirical Methods in Natural
Language Processing, pages 172-182, 2011.
DATA2013-2ndInternationalConferenceonDataManagementTechnologiesandApplications
182
