Multiscale Models of Electrochemically-Promoted
Large Catalytic Surfaces
Ioannis S. Fragkopoulos
and Constantinos Theodoropoulos
School of Chemical Engineering and Analytical Science, University of Manchester, Sackville Street, Manchester, U.K.
Keywords: Electrochemical Promotion of Catalysis, CFD-KMC Coupling, Gap-tooth Method, Lattice-lattice
Interactions, CO Oxidation on Pt/YSZ.
Abstract: In the current work a multiscale framework for electrochemically promoted catalytic systems is formulated.
It integrates a macroscopic model based on commercial CFD software, which simulates the charge transport
in the system, and an in-house developed efficient implementation of the kinetic Monte Carlo method for
the simulation of reaction-diffusion micro-processes taking place on the catalyst. The “large” catalytic
surface is split into a number of smaller “representative” lattices whose total area is only a fraction of the
actual catalytic area. Efficient coarse-graining methodologies based on equation free methods (Gear et al.,
2002) are employed to simulate the interactions between these lattices including lateral (lattice-to-lattice)
transport through diffusion. Hence, the computationally intensive microscopic simulations are handled with
efficiency.
1 INTRODUCTION
The aim of this work is the construction of an
accurate multiscale framework for electrochemically
promoted large catalytic systems. Electrochemical
Promotion of Catalysis (EPOC), also termed as Non-
Faradaic Electrochemical Modification of Catalytic
Activity (NEMCA), is the enhancement of catalytic
activity due to an electrochemically controlled
migration of ''backspillover'' species, i.e. [O
δ-
- δ+],
from the solid electrolyte to the catalytically active,
gas exposed, electrode surface, when potential is
applied between the two electrodes of the solid
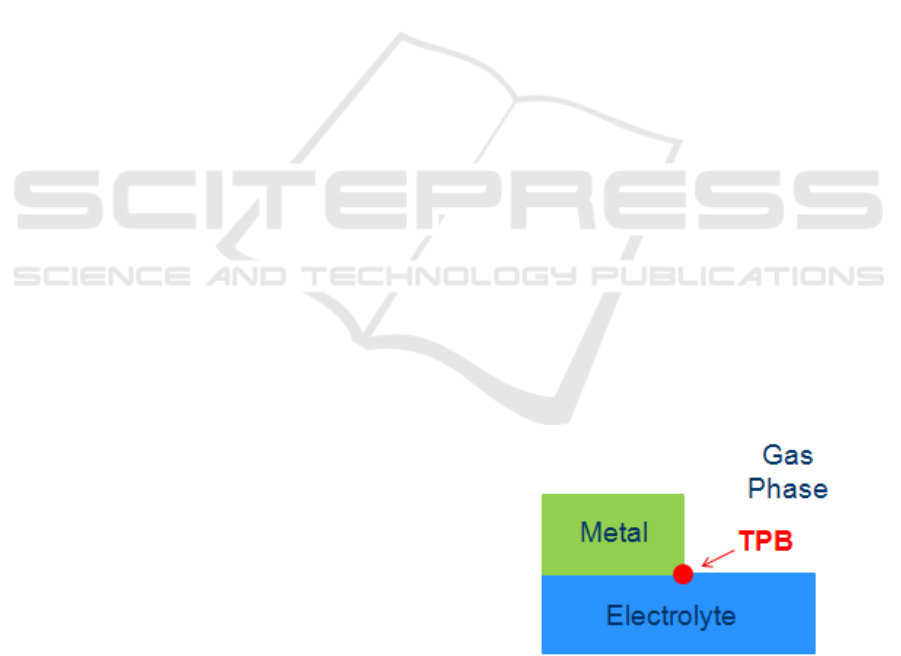
electrolyte cell. Oxygen anions are excorporated
from the Triple Phase Boundaries (TPBs), i.e. places
where gas phase, metal and electrolyte meet (Fig.1),
forming BackSpillover Species (BSS). The BSS spill
over the catalytic surface forming an effective
double layer, which affects the binding strength of
the chemisorbed reactants. The EPOC phenomenon
was first observed by Stoukides and Vayenas (1981)
and has since been of increasing interest in the field
of modern electrochemistry (Poulidi et al., 2011). It
was also found that EPOC can lead to up a 600%
increase in the surface reaction rate and sometimes
is maintained under current interruption (Yentekakis
et al., 1994). Few modelling studies have addressed
this phenomenon. Most relevant works focus on the
kinetics of the catalytic surface.
Figure 1: The Triple Phase Boundary.
In previous work (Fragkopoulos et al., 2012) we
have proposed, for the first time, an accurate
multiscale model of electrochemical promotion,
taking explicitly into account all interactions
between different length scales. In this work we
extend our multiscale model to handle larger
catalytic surfaces employing intelligent interpolation
techniques (Gear et al., 2003); (Armaou et al., 2005).
Thus, the computationally expensive (or even
intractable) large microscopic simulations are
performed with efficiency.
155
S. Fragkopoulos I. and Theodoropoulos C..
Multiscale Models of Electrochemically-Promoted Large Catalytic Surfaces.
DOI: 10.5220/0004485401550162
In Proceedings of the 3rd International Conference on Simulation and Modeling Methodologies, Technologies and Applications (SIMULTECH-2013),
pages 155-162
ISBN: 978-989-8565-69-3
Copyright
c
2013 SCITEPRESS (Science and Technology Publications, Lda.)
2 PHYSICS OVERVIEW
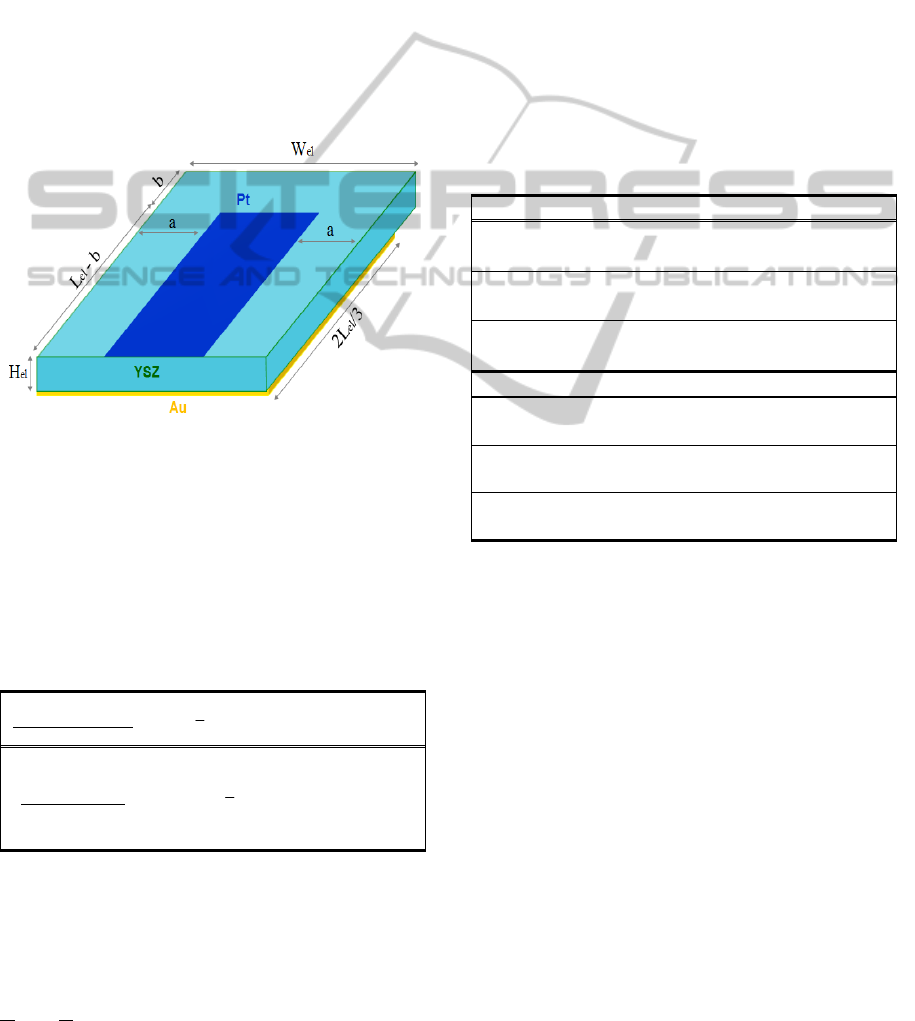
2.1 The Computational Domain
The 3D computational domain of the solid oxide
single pellet we consider here is depicted in Fig. 2. It
consists of an electrolyte (YSZ), an adjacent
catalytic film (Pt) as working electrode and an (also
adjacent) counter electrode (Au) which is assumed
to be inert. Both Pt and Au electrodes are considered
as 2D surfaces with infinitesimal heights. The
physical dimensions of the system are illustrated in
Fig. 2 where L
el
=500nm, W
el
=100nm, H
el
=5μm,
a=34nm and b=152nm. CO oxidation on Pt/YSZ is
the reaction framework of choice.
Figure 2: The 3-D Computational Domain.
2.2 The Electrochemical Process
When potential is applied between the anodic and
cathodic electrodes of the pellet, charge is
transferred throughout, due to electrochemical
reactions (presented in Table 1) taking place at the
TPBs of anode and cathode.
Table 1: The scheme of electrochemical reactions.
Cathodic TPB: (1)
(2)
Anodic TPB: (3)
(4)
The parallel electrical circuit analogy (Achenbach,
1994) is used for the calculation of the total current
density distributions of the anode and the cathode:
1234
3
,
C C A AAA
J
J JJJJ
(5)
where J
i
A/C
are the current densities at the
Anode/Cathode, respectively and are given by the
Butler–Volmer equation (Tseronis et al., 2012).
2.3 The Catalytic Surface Dynamics
Due to potential application in the pellet and after
electrochemical reaction (4) takes place, BSS is
formed at the TPB of the anode and migrates over
the catalytic film. While diffusing over the catalyst,
it can either react with co-adsorbed CO forming CO
2
(the desorption of which is considered as
immediate), or desorbs to the gaseous phase as O
2
.
These reactions are augmented by the main
heterogeneous CO oxidation mechanism (Kaul et al.,
1987). The micro-processes that describe the
combined, closed-circuit, Electro-Catalytic CO
oxidation mechanism are illustrated in Table 2.
Table 2: The scheme of Electro-Catalytic micro-processes.
Open-circuit CO oxidation micro-processes
O
2
(
g
)
2*
k
6
k
6
2
O
*
(6)
CO
(
g
)
*
k
7
k
7
CO
*
(7)
8
()
2
** 2*
g
k
OCO CO
(8)
Closed-circuit additional micro-processes
9
()
-
2
-* * 2*
g
k
OCOCO
(9)
10
()
-
2
2-* 2*
g
k
OO
(10)
(11)
The transition probabilities of the micro-processes
(6-8) can be found in the literature (Reese et al.,
2001; Hari and Theodoropoulos, 2009) while the
closed-circuit additional ones are expressed as:
9
9**/* **/*
10
10 * */ *
,
,**/***/*
CO BSS CO BSS CO BSS
BSS BSS BSS
Xdiff
Xdiff X X X
kP P P P
kP P
kPPPP
(12)
where P
X*
and P
X*/Y*
are one and two-site conditional
probabilities respectively.
3 ELECTROCHEMICALLY
PROMOTED CO OXIDATION
The proposed multi-scale framework integrates a 3D
-2
()
1
2
2
32
YSZ
g
OeO
2-
()
()
2
2
YSZ g
g
OCO CO e
2-
()
1
2
2
2
YSZ
g
OOe
2--
-2
YSZ
OO e
* * * * , ,
diff
k
XXXCOBSS
SIMULTECH2013-3rdInternationalConferenceonSimulationandModelingMethodologies,Technologiesand
Applications
156
macroscopic model which employs the Finite
Element Method (FEM) for the simulation of charge
conservation in the system and a 2D microscopic
one which employs the kinetic Monte Carlo (kMC)
method in combination with Gap-Tooth
interpolation techniques for the simulation of the
reaction-diffusion micro-processes taking place on
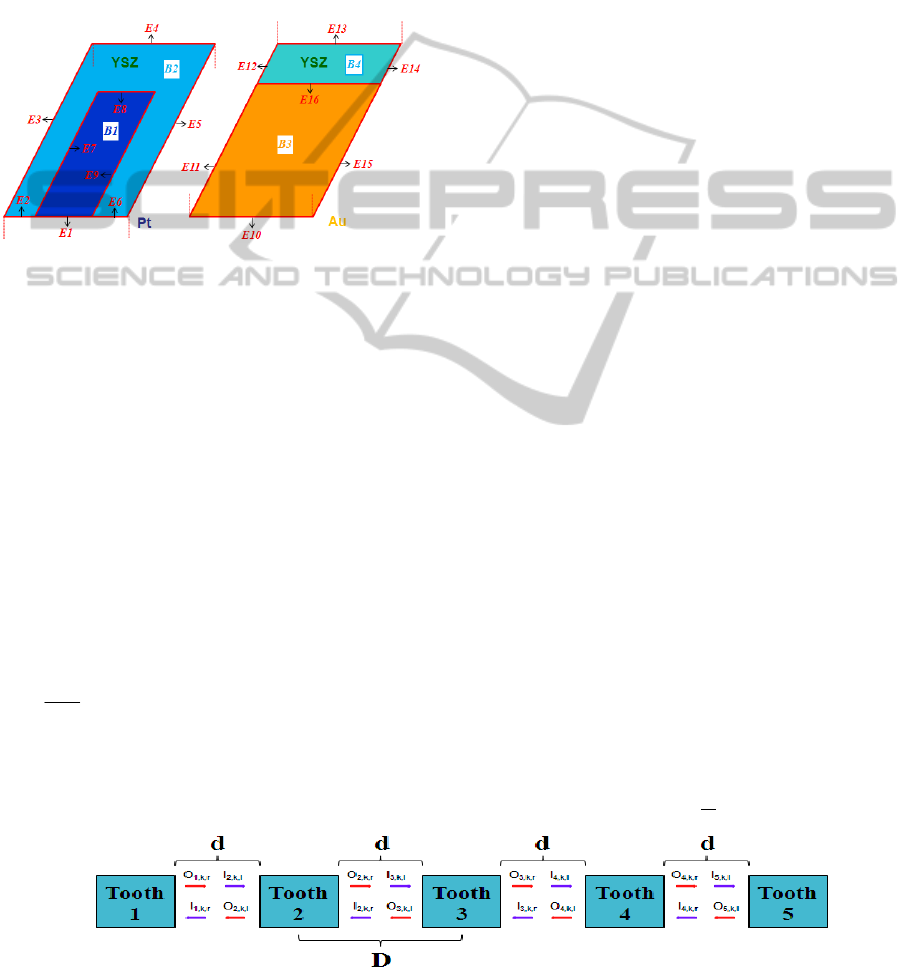
the catalytic surface. The numbering of the
boundaries (B) and edges (E) of the 3D
computational domain is presented in Fig. 3.
Figure 3: Numbering of Boundaries and Edges.
There are in total 8 boundaries and 20 edges where 4
of which (E7-9 & E16) represent TPBs. Boundaries
B1 and B3 represent the Pt and Au electrodes
respectively.
3.1 Macroscopic Modelling
3.1.1 Charge Transfer
Under potential application in the pellet,
electrochemical reactions take place at the TPBs and
ionic as well as electronic charge transport in the
electrolyte and the electrodes, respectively.
Considering a no charge source, the charge
conservation equation of a phase j, takes the
following form:
, ,
j
jj
d
j
el io
dt
(13)
where ρ
j
, σ
j
and Φ
j
are the charge density, the charge
conductivity and the local electrostatic potential
respectively, of the phase j. Also, el (B1&B3) and io
(YSZ) denote electronic and ionic current,
respectively.
3.1.2 Boundary Conditions
Under closed-circuit conditions, the electronic
potential is fixed to the value of the operating
potential Φ
pellet
(Φ
el
C
= Φ
pellet
) at E10 and electronic
charge is transferred through the cathodic electrode
(B3). At E16, the electrochemical reduction of O
2
takes place (Rxn 1) and resulting in the conversion
of current from electronic to ionic (Eq. 14).
(14)
Ionic charge is then transferred throughout YSZ.
Consequently, ionic current is converted to
electronic at E7-9 (Eq. 15), due to the electro-
chemical reactions (Rxns 2-4).
(15)
Electronic charge is transferred through the anodic
electrode (B1). At E4 the electronic potential is fixed
to zero (Φ
el
A
= 0). Insulation is imposed for all the
remaining boundaries and edges for both electronic
and ionic phases.
3.2 Microscopic Modelling
Species reaction and diffusion on the catalytic
surface are simulated a spatial version of kMC
(Reese et al., 2001). Furthermore, to enable our
multi-scale simulator to handle relatively large
surfaces (on the order of μm or even mm) we have
employed the gap-tooth method (Gear et al., 2002,
2003). Here, we represent the catalytic lattice
consisting of 1100 by 100 sites with 5 smaller
lattices (teeth) of 100 by 100 sites. The distance
(gap) between the teeth is constant and equal to 150
sites (d=150, D=250). The schematic representation
of the gap-tooth geometry is depicted in Fig. 4.
The lateral interactions between the teeth, i.e.
diffusion of species amongst the lattices, are
described by exchange fluxes of particles (as in Fig.
4), here noted as O
s,i,k
, I
s,i,k
(Outgoing
(side, tooth, particle)
,
Figure 4: Schematic of the gap-tooth geometry.
CC C C
el el io io
J
J
nn- - , - - -
AAAA
io io el el
J
J
nn- - , - - -
MultiscaleModelsofElectrochemically-PromotedLargeCatalyticSurfaces
157
Ingoing
(side,tooth,particle)
). The expressions that describe
the exchange fluxes between two teeth are based on
linear interpolation and can be written as:
,, , 1, ,,
,, , 1, ,,
(1 )
(1 )
R
ik x Li k x Lik
L
ik x Ri k x Rik
IO O
IO O
(16)
where a
x
is an interpolation coefficient which
depends on the gap-tooth geometry and is expressed
as a
x
=d/D=0.4, where d is the length of each tooth
and D is the distance between the centre of two teeth
(Fig. 4). These exchange fluxes are updated at 1/10
of the reporting horizon (T=1e-5 s) of the kMC
simulator.
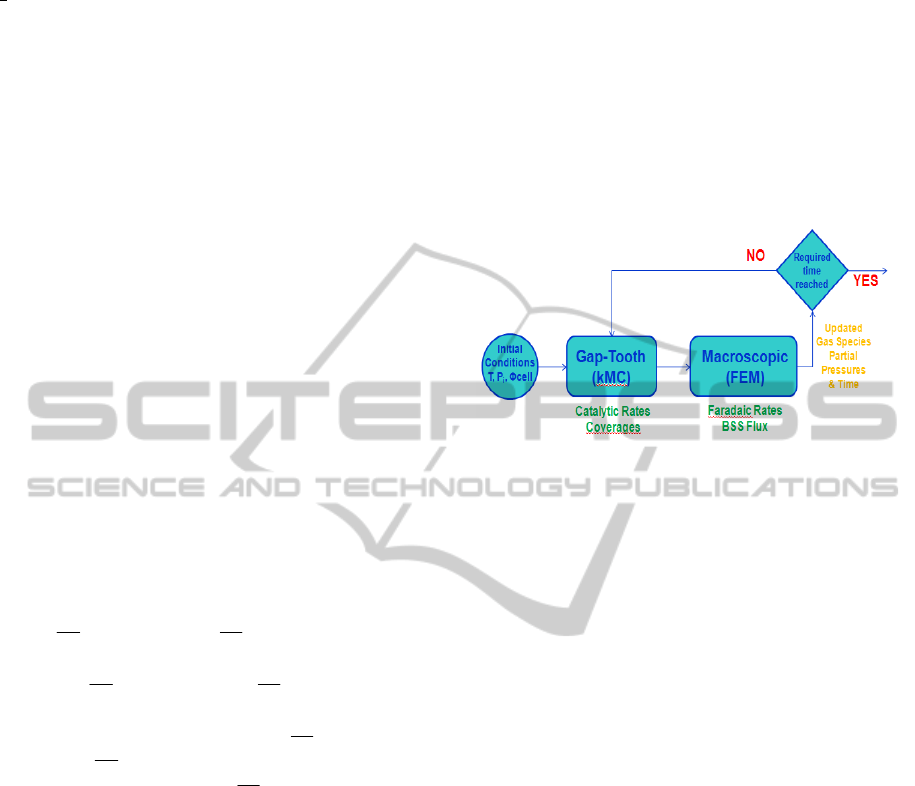
3.3 The Multiscale Framework
The multiscale framework is illustrated in Fig. 5.
Initial conditions such as temperature, T, partial
pressures in the gas phase mixture, P
i
, and applied
potential, Φ
pellet
, are fed into the microscopic
simulator, which employs lattice kMC combined
with the Gap-Tooth method to model reaction and
diffusion phenomena on the catalyst. At the end of a
time reporting horizon (T) the partial pressures are
updated due to the Non-Faradaic electro-catalytic
rates:
2
22
2
78
00
2
66
00
3
559
00
/
( ) dxdz
2
( ) dxdz
2
( ) dxdz
4
+
4
Pt Pt
Pt Pt
Pt Pt
WL
A
A
CO S
d
WL
A
Ain
CO CO S
d
WL
A
S
AC in
OO
C
d
J
RT
PN
FF
J
RT
PP N
FF
J
N
F
RT
PP
F
J
00
dxdz
Au Au
WL
F
(17)
where P
i
is the partial pressure of species i, F
d
is the
volumetric flowrate of gas mixture in the inlet/outlet
of the reactor, N
S
is the concentration of the active
surface sites on the catalytic surface, W and L are the
width and the length of the each electrode
respectively, J
i
/n
e
F is the Faradaic rate resulting by
the electrochemical reactions i. The expressions in
the curly brackets represent the consumption and
production rates of each species.
The computed partial pressures are subsequently
fed into the macroscopic simulator, constructed in
COMSOL Multiphysics, which employs the FEM
for the simultaneous solution of the set of electronic
and ionic charge balances. At the end of the same
time reporting horizon, T, partial pressures are
updated again and fed back to the microscopic
simulator also providing a flux for BSS:
E7-9:
1
4
-- (2 )
A
BSS BSS s S TPB
DJAFNl
n
(18)
where J
4
A
is the anodic current density due to BSS
formation at the anodic TPB, A
s
is the Pt surface
area, l
TPB
is the TPB length, N
s
is the molar
concentration of surface sites. These macroscopic
inward fluxes are translated as BSS molecules per
unit time so as to be used in the microscopic model.
This process is repeated until the desired time is
reached.
Figure 5: Schematic of the multi-scale framework.
4 COMPUTATIONAL RESULTS
Before applying the gap-tooth method in the multi-
scale framework, we have undertook a validation of
our gap-tooth simulator against a single (large)
lattice using only the diffusion micro-process for
only one species and for a very high - 10
6
- diffusion
probability.
In Fig. 6a-e a comparison between the coverage
of the diffusing species computed by the single
lattice simulation (1100x100 sites) and that
computed by the Gap-Tooth simulation (as
presented in Fig. 4), utilizing an influx of 100
species per 10
-4
sec at the left side boundary of tooth
1 and at the left side boundary of the single lattice,
respectively, is depicted. As we can see the Gap-
Tooth simulator can accurately capture both short
and long term dynamics of the diffusing species.
This allows us to use the Gap-Tooth simulator in our
main modelling study for simulation time up to 10
-2
sec with confidence. We should note that the for the
validation presented here a high -10
6
- diffusion
probability has been used on purpose to enables us
to detect the features of the system for the simulated
times.
In our multi-scale framework, the macro- and
micro-scopic models are linked through a Matlab
interface and are simulated iteratively. The gas
phase of the system (Fig. 2) was assumed to be well
mixed at 1atm, 623.15K, P
CO
=500Pa, P
O
2
=5kPa and
SIMULTECH2013-3rdInternationalConferenceonSimulationandModelingMethodologies,Technologiesand
Applications
158

an applied potential of 500mV. The chosen reaction
coefficients are tabulated in Table 3, while the
diffusion probabilities of CO and of BSS were
chosen as 1, 10
3
and 10
6
in order to illustrate the
diffusional effects on the lateral (lattice-to-lattice)
interactions between the kMC teeth.
Table 3: The model parameters.
γ
2
= 6.4
.
10
8
A/m
2
γ
3
= 5.2
.
10
7
A/m
2
γ
4
= 5
.
9.10
5
A/m
2
S
CO
= 0.3623
S
O
2
= 0.0106
E
-6
= 222265 J/mol
E
-7
= 109954 J/mol
E
8
= 39777 J/mol
k
9
= 1.0310
-2
s
-1
k
10
= 8.810
-3
s
-1
In Fig. 7a-e a comparison between the coverage of
CO (main diffusing adsorbate) computed by the
multi-scale simulation of the large (1100x100 sites)
lattice and that computed by the CFD-kMC-gap-
tooth scheme is depicted. As we can see the latter
can accurately capture the long and short term
dynamics of the main diffusing species (CO) for the
whole time range, at a fraction of the computational
cost (approximately 16% of the CPU time used by
the full-scale simulator) even for the very high - 10
6
– diffusion probability.
We have also investigated the effect of the
lattice-to-lattice interactions on the selected system
and operating conditions. Thus, we have performed
a gap-tooth simulation not considering any lateral
interactions (only CO diffusion within each lattice
was allowed).
A comparison between the CO average coverage
profiles in the single (large) lattice (red lines) and in
teeth 1-5 with (green diamonds) and without (blue
lines) lattice-to-lattice interactions is presented in
Fig. 8. The value of 10
6
was selected as a diffusion
probability because for this value, diffusion events
represent 60% of the total micro-processes on the
lattice, hence we can more clearly see the effect of
diffusion on the system. As we can observe in Fig. 7
the single lattice is very well represented using the
gap-tooth simulator, with lateral interactions, while
some differences exist for the case of no lateral
interactions as expected. Nevertheless, due to the
dominant presence of catalytic reactions (6-8) these
differences are small.
Figure 6: Diffusing species average coverage profiles comparison, between a Single Lattice and, (a) Tooth 1, (b) Tooth 2,
(c) Tooth 3, (d) Tooth 4, (d) Tooth 4, (e) Tooth 5, for a 10
6
chosen diffusion probability.
0,0
0,1
0,2
0,3
0,4
0,5
0,6
0,7
0,8
0 0,005 0,01
Diffusing Species
t (s)
Tooth 1
Single Lattice
Tooth 1
(a)
0
0,05
0,1
0,15
0,2
0,25
0 0,005 0,01
Diffusing Species
t (s)
Tooth 2
Single Lattice
Tooth 2
(b)
0
0,02
0,04
0,06
0,08
0,1
0,12
0,14
0 0,005 0,01
Diffusing Species
t (s)
Tooth 3
Single Lattice
Tooth 3
(c)
0
0,02
0,04
0,06
0,08
0,1
0 0,005 0,01
Diffusing Species
t (s)
Tooth 4
Single Lattice
Tooth 4
(d)
0
0,01
0,02
0,03
0,04
0,05
0,06
0,07
0,08
0 0,005 0,01
Diffusing Species
t (s)
Tooth 5
Single Lattice
Tooth 5
(
e
)
MultiscaleModelsofElectrochemically-PromotedLargeCatalyticSurfaces
159
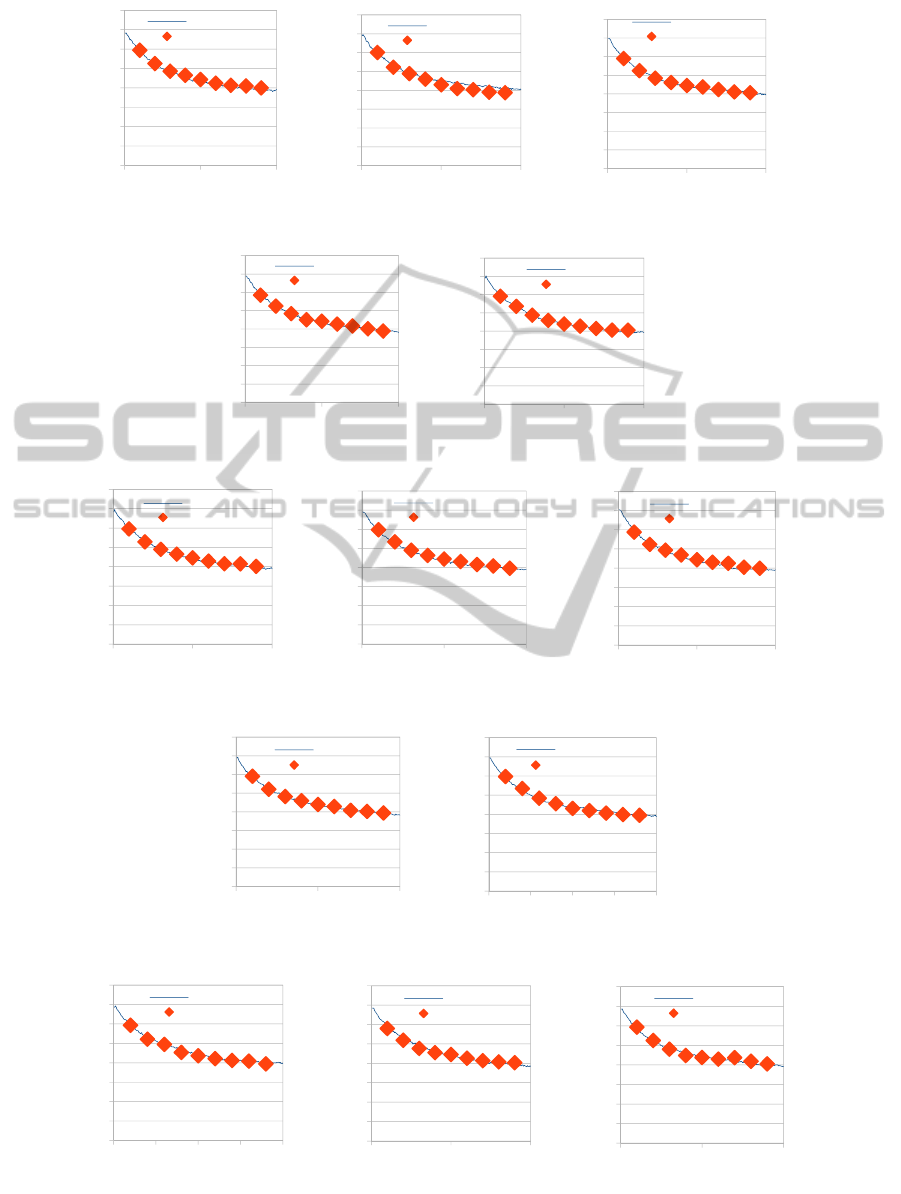
Figure 7: CO average coverage profiles comparison, between a Single Lattice and (a) Tooth 1, (b) Tooth 2, (c) Tooth 3,
(d) Tooth 4, (e) Tooth 5. The (i), (ii) and (iii) represent results utilizing 1, 10
3
and 10
6
diffusion probabilities respectively.
0,0
0,1
0,2
0,3
0,4
0,5
0,6
0,7
0,8
0,0E+0 1,0E-3 2,0E-3
CO coverage
t (s)
Single Lattice
Tooth 1
(a‐i)
0,0
0,1
0,2
0,3
0,4
0,5
0,6
0,7
0,8
0,0E+0 1,0E-3 2,0E-3
CO coverage
t (s)
Single Lattice
Tooth 2
(b‐i)
0,0
0,1
0,2
0,3
0,4
0,5
0,6
0,7
0,8
0,0E+0 1,0E-3 2,0E-3
CO coverage
t (s)
Single Lattice
Tooth 3
(c‐i)
0,0
0,1
0,2
0,3
0,4
0,5
0,6
0,7
0,8
0,0E+0 1,0E-3 2,0E-3
CO coverage
t (s)
Single Lattice
Tooth 4
(d‐i)
0,0
0,1
0,2
0,3
0,4
0,5
0,6
0,7
0,8
0,0E+0 1,0E-3 2,0E-3
CO coverage
t (s)
Single Lattice
Tooth 5
(e‐i)
0,0
0,1
0,2
0,3
0,4
0,5
0,6
0,7
0,8
0,0E+0 1,0E-3 2,0E-3
CO coverage
t (s)
Single Lattice
Tooth 1
(a‐ii)
0,0
0,1
0,2
0,3
0,4
0,5
0,6
0,7
0,8
0,0E+0 1,0E-3 2,0E-3
CO coverage
t (s)
Single Lattice
Tooth 2
(b‐ii)
0,0
0,1
0,2
0,3
0,4
0,5
0,6
0,7
0,8
0,0E+0 1,0E-3 2,0E-3
CO coverage
t (s)
Single Lattice
Tooth 3
(c‐ii)
0,0
0,1
0,2
0,3
0,4
0,5
0,6
0,7
0,8
0,0E+0 1,0E-3 2,0E-3
CO coverage
t (s)
Single Lattice
Tooth 4
(d‐ii)
0,0
0,1
0,2
0,3
0,4
0,5
0,6
0,7
0,8
0,0E+05,0E-41,0E-31,5E-32,0E-3
CO coverage
t (s)
Single Lattice
Tooth 5
(e‐ii)
0,0
0,1
0,2
0,3
0,4
0,5
0,6
0,7
0,8
0,0E+05,0E-41,0E-31,5E-32,0E-3
CO coverage
t (s)
Single Lattice
Tooth 1
(a‐iii)
0,0
0,1
0,2
0,3
0,4
0,5
0,6
0,7
0,8
0,0E+0 1,0E-3 2,0E-3
CO coverage
t (s)
Single Lattice
Tooth 2
(b‐iii)
0,0
0,1
0,2
0,3
0,4
0,5
0,6
0,7
0,8
0,0E+0 1,0E-3 2,0E-3
CO coverage
t (s)
Single Lattice
Tooth 3
(c‐iii)
SIMULTECH2013-3rdInternationalConferenceonSimulationandModelingMethodologies,Technologiesand
Applications
160
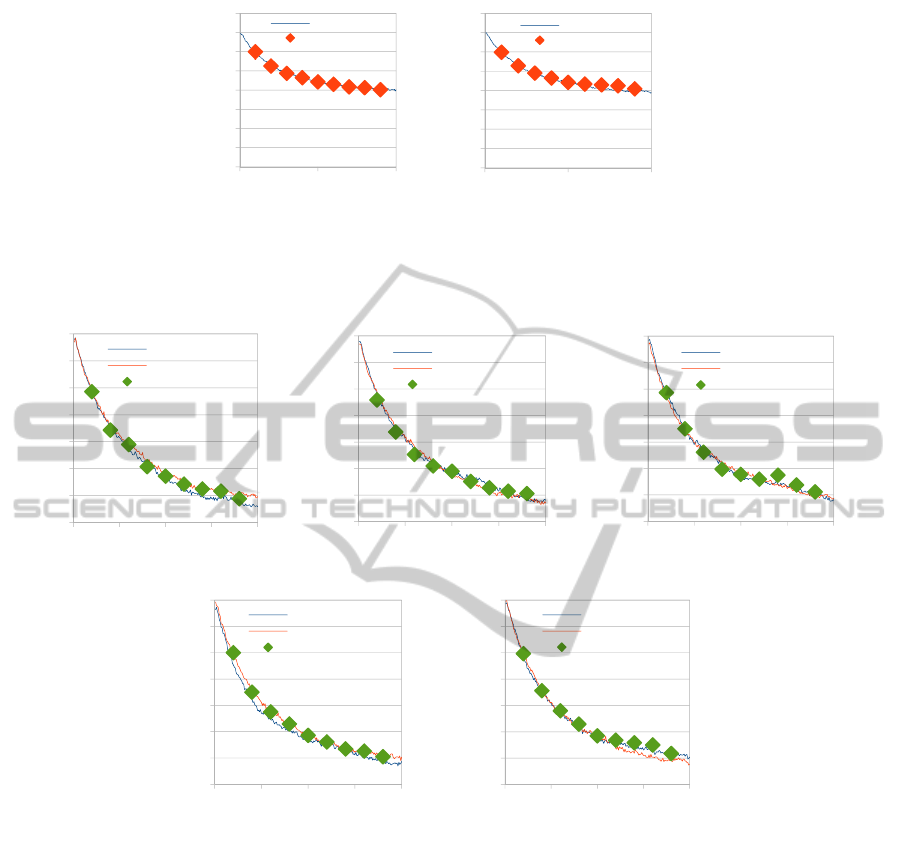
Figure 7: CO average coverage profiles comparison, between a Single Lattice and (a) Tooth 1, (b) Tooth 2, (c) Tooth 3,
(d) Tooth 4, (e) Tooth 5. The (i), (ii) and (iii) represent results utilizing 1, 10
3
and 10
6
diffusion probabilities respectively.
(Cont.)
Figure 8: CO average coverage profiles comparison, between a Single Lattice and, (a) Tooth 1, (b) Tooth 2, (c) Tooth 3, (d)
Tooth 4, (e) Tooth 5, with and without lattice-to-lattice internal interactions, for a 10
6
chosen diffusion probability.
5 CONCLUSIONS
A multiscale framework for an Electrochemically
Promoted system has been presented. It integrates a
macroscopic model for the simulation of charge
conservation in the system and a microscopic one
using an in house developed lattice kMC simulator
and the Gap-Tooth method for the simulation of the
catalytic surface dynamics. This simulator can
accurately capture the surface dynamics with
computational efficiency enabling us to simulate
larger realistic systems. This framework in
conjunction with high-fidelity experiments
(currently underway) will lead to the computation of
reliable system parameters and towards optimal and
robust system design scale-up and control or
electrochemically-promoted systems.
ACKNOWLEDGEMENTS
The financial support of EPSRC (grant
EP/G022933/1) is gratefully acknowledged.
0,0
0,1
0,2
0,3
0,4
0,5
0,6
0,7
0,8
0,0E+0 1,0E-3 2,0E-3
CO coverage
t (s)
Single Lattice
Tooth 4
(d‐iii)
0,0
0,1
0,2
0,3
0,4
0,5
0,6
0,7
0,8
0,0E+0 1,0E-3 2,0E-3
CO coverage
t (s)
Single Lattice
Tooth 5
(e‐iii)
0,35
0,40
0,45
0,50
0,55
0,60
0,65
0,70
0,0E+0 5,0E-4 1,0E-3 1,5E-3 2,0E-3
CO coverage
t (s)
No Interactions
Single
Interactions
(a)
0,35
0,40
0,45
0,50
0,55
0,60
0,65
0,70
0,0E+0 5,0E-4 1,0E-3 1,5E-3 2,0E-3
CO coverage
t (s)
No Interactions
Single
Interactions
(b)
0,35
0,40
0,45
0,50
0,55
0,60
0,65
0,70
0,0E+0 5,0E-4 1,0E-3 1,5E-3 2,0E-3
CO coverage
t (s)
No Interactions
Single
Interactions
(c)
0,35
0,40
0,45
0,50
0,55
0,60
0,65
0,70
0,0E+0 5,0E-4 1,0E-3 1,5E-3 2,0E-3
CO coverage
t (s)
No Interactions
Single
Interactions
(d)
0,35
0,40
0,45
0,50
0,55
0,60
0,65
0,70
0,0E+0 5,0E-4 1,0E-3 1,5E-3 2,0E-3
CO coverage
t (s)
No Interactions
Single
Interactions
(e)
MultiscaleModelsofElectrochemically-PromotedLargeCatalyticSurfaces
161

REFERENCES
Achenbach, E., 1994. Three-dimensional and time-
dependent simulation of a planar solid oxide fuel cell
stack. Journal of Power Sources, 49, (1-3): 333-348.
Armaou, A., Kevrekidis, I. G., Theodoropoulos, C., 2005.
Equation-free gaptooth-based controller design for
distributed complex/multiscale processes. Computers
and Chemical Engineering, 29, (4): 731-740.
Fragkopoulos, I. S., Bonis, I., Theodoropoulos, C., 2012.
Multiscale modelling of spillover processes in
heterogeneous catalytic systems. Computer Aided
Process Engineering, 30, 1013-1017.
Gear, C. W., Kevrekidis, I. G., Theodoropoulos, C., 2002.
'Coarse' integration/bifurcation analysis via
microscopic simulators: Micro-Galerkin methods.
Computers and Chemical Engineering, 26, (7-8): 941-
963.
Gear, C. W., Li, J., Kevrekidis, I. G., 2003. The gap-tooth
method in particle simulations. Physics Letters A, 316,
190-195.
Hari, B., Theodoropoulos, C., 2009. Integrated multi-scale
models for simulation and design of microreactor
systems. Chemical Engineering Transactions: 9th
International Conference on Chemical and Process
Engineering, 17, 1269-1274.
Kaul, D. J., Sant, R., Wicke, E. E., 1987. Integrated
kinetic modeling and transient FTIR studies of CO
oxidation on Pt/SiO
2
. Chemical Engineering Science,
42, (6): 1399-1411.
Poulidi, D., Rivas, M. E., Metcalfe, I. S., 2011. Controlled
spillover in a single catalyst pellet: Rate modification,
mechanism and relationship with electrochemical
promotion. Journal of Catalysis, 281, (1): 188-197.
Reese, J. S., Raimondeau, S., Vlachos, D. G., 2001. Monte
Carlo Algorithms for Complex Surface Reaction
Mechanisms: Efficiency and Accuracy. Journal of
Computational Physics, 173, (1): 302-321.
Stoukides, M., Vayenas, C. G., 1981. The effect of
electrochemical oxygen pumping on the rate and
selectivity of ethylene oxidation on polycrystalline
silver. Journal of Catalysis, 70, (1): 137-146.
Tseronis, K., Bonis, I., Kookos, I. K., Theodoropoulos, C.,
2012. Parametric and transient analysis of non-
isothermal, planar solid oxide fuel cells. International
Journal of Hydrogen Energy, 37, (1): 530-547.
Yentekakis, I.V., Moggridge, G., Vayenas, C.G., Lambert,
R.M., 1994. In Situ controlled promotion of catalyst
surfaces via NEMCA: The effect of Na on Pt-catalyzed
CO oxidation. Journal of Catalysis, 146, (1): 292-305.
SIMULTECH2013-3rdInternationalConferenceonSimulationandModelingMethodologies,Technologiesand
Applications
162
