
An Elastic Cache Infrastructure through Multi-level Load-balancing
Carlos L
¨
ubbe and Bernhard Mitschang
IPVS, University of Stuttgart, Universit
¨
atsstraße 38, 70569 Stuttgart, Germany
Keywords:
Load-balancing, Spatial Cache, Spatial Data Processing, Peer-to-Peer System.
Abstract:
An increasing demand for geographic data compels data providers to handle an enormous amount of range
queries at their data tier. In answer to this, frequently used data can be cached in a distributed main memory
store in which the load is balanced among multiple cache nodes. To make appropriate load-balancing deci-
sions, several key-indicators such as expected and actual workload as well as data skew can be used. In this
work, we make use of an abstract mathematical model to consolidate these indicators. Moreover, we propose
a multi-level load-balancing algorithm which considers the different indicators in separate stages. Our eval-
uation shows that our multi-level approach significantly improves the resource utilization in comparison to
existing technology.
1 INTRODUCTION
Geographic data is becoming increasingly important,
since the rapid proliferation of Internet-ready mobile
devices have made location based services (LBS) ac-
cessible to a large crowd of users. As LBS typically
operate on data referring the user’s current vicinity,
data providers need to be able to cope with a massive
amount of requests for data of specific geographic re-
gions. A lot of these requests can be cached in a
distributed main memory store which provides effi-
cient access to most frequently used data. Key play-
ers make use of similar concepts to cope with massive
load, e.g. Facebook uses Memcached to cache fre-
quently used data in main memory and many others
make highly requested data on dedicated edge servers
available. In such a distributed system, it is essential
to balance incoming load among participating cache
nodes to provide high throughput during the entire ex-
ecution process. For that matter, specific challenges
have to be considered.
First of all, spatial data is not spread uniformly
across the world but rather relates to the density of
geographic features or the degree of development of
represented areas. As obviously more cache mem-
ory is needed to cover regions with high data density
than sparsely occupied areas, it is essential to con-
sider data skew to adequately allocate cache memory
during load-balancing. Furthermore, the workload is
not equally scattered throughout the data space. In
fact, large areas are likely to be not requested at all,
as approximately 70% of the world is covered by wa-
ter being typically of little interest by the majority of
people. Thus, it is crucial to consider the expected
workload and reserve resources for those areas which
are most likely to be requested. Finally, effective
load balancing must also react to dynamic load peaks
when the actual workload deviates from anticipated
patterns.
Existing load-balancing mechanisms are limited
to one of the three above-mentioned indicators. For
instance, (Aberer et al., 2005), focuses on data skew
only, (Scholl et al., 2009), addresses only expected
workload and many other approaches, such as (L
¨
ubbe
et al., 2012; Wang et al., 2005), solely focus on dy-
namic load-peaks. Fully relying on a single indica-
tor can lead to inadequate resource allocation during
load-balancing.
To substantiate our argument, we use an example
of a maritime region comprising little islands and a
huge offshore portion. In this area, the data is dis-
tributed nonuniformly with higher concentration in
insular regions. An oil spill, ship wreckage or any
other critical event will suddenly raise disproportion-
ately high interest in the area around the event’s lo-
cation. In consequence, a purely dynamic approach
clusters a huge amount of memory to cache data in
the sea area around the accident, although at that lo-
cation only marginal data exists. This overcompensa-
tion can lead to poor resource utilization which com-
promises the overall performance of the system, as the
resources would have been needed elsewhere, e.g., to
183
Lübbe C. and Mitschang B..
An Elastic Cache Infrastructure through Multi-level Load-balancing.
DOI: 10.5220/0004486001830190
In Proceedings of the 2nd International Conference on Data Technologies and Applications (DATA-2013), pages 183-190
ISBN: 978-989-8565-67-9
Copyright
c
2013 SCITEPRESS (Science and Technology Publications, Lda.)
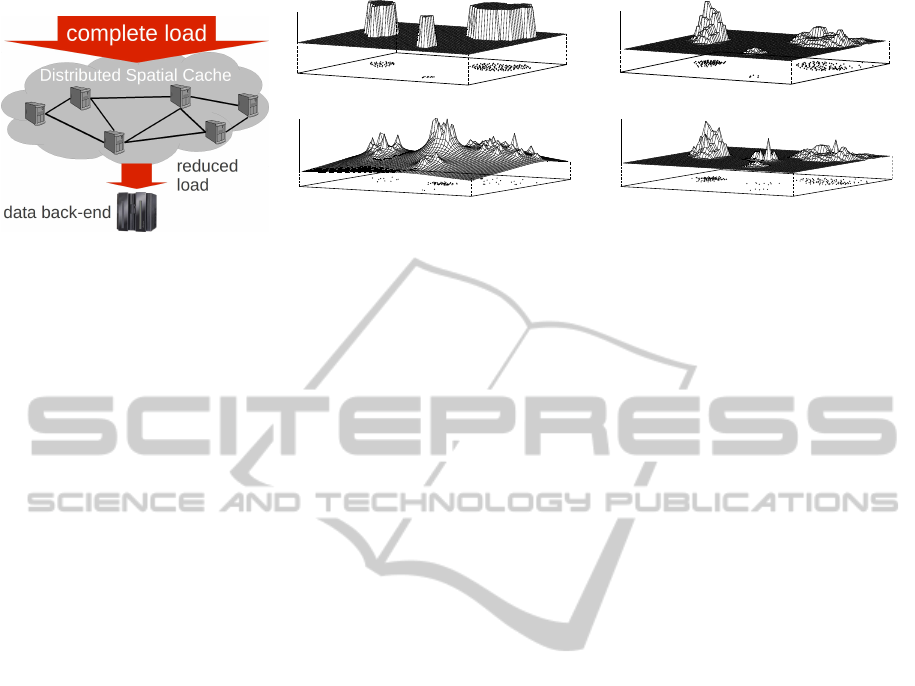
Figure 1: Overview.
load
x
y
(a) Land mass ρ
g
load
x
y
(b) Data density ρ
c
load
x
y
(c) Actual workload ρ
d
load
x
y
(d) Holistic distribution ρ
h
Figure 2: Examples for distribution functions (L
¨
ubbe et al., 2013).
cache data of insular regions.
The different load-balancing indicators data skew,
expected workload and dynamic load peaks can all
be consolidated into a comprehensive mathematical
model (L
¨
ubbe et al., 2013). In this work, we im-
plement a distributed and elastic main memory cache
supporting multi-level load-balancing which consid-
ers the different indicators of the abstract model in
separate stages. The first stage prepares the cache net-
work for expected workload while the second adapts
to unexpected load peaks. We systematically evalu-
ate the approach in the above-mentioned realistic sce-
nario. Our evaluation shows that our implementation
significantly improves the resource utilization in com-
parison to a conventional algorithm.
2 FOUNDATIONS
As this paper builds upon the ideas of previous work
(L
¨
ubbe et al., 2011; L
¨
ubbe et al., 2012; L
¨
ubbe et
al., 2013), this section outlines their major contribu-
tions. First, we describe the general architecture of
the distributed main memory cache. Then, we present
a strategy to to control the overall cache content of
participating cache nodes. Finally, we summarize our
abstract load-balancing model.
Overview. (L
¨
ubbe et al., 2011) introduced data struc-
tures and algorithms to store spatial data on a single
node. The work bases on a general data model com-
prising objects which contain an obligatory attribute
delineating the spatial extend of the object and arbi-
trary additional non-spatial attributes. Thus, a single
node can use the cached objects of previous queries
to process a given range query. Combining multi-
ple of these cache nodes to a distributed spatial main
memory cache, allows scalable access to frequently
used data. Figure 1 depicts the general architecture
of such a system. In the distributed infrastructure,
cache nodes process requests cooperatively using the
cached data of previous queries and may fetch miss-
ing data from the data back-end which stores the com-
plete data set. Due to the considerable high spatial and
temporal overlap between succeeding queries, most
requests can be served by the distributed spatial cache
which leads to a reduction of back-end accesses. To
achieve a high cache hit-rate during execution, it is
essential to control the cache content of participating
nodes as elaborated in the following.
Cache Content Control. To control the overall cache
content of the distributed spatial cache, (L
¨
ubbe et al.,
2012) introduced a dedicated replacement strategy,
denoted as focused caching. In this strategy, we as-
sign each cache node a point in space, denoted as its
cache focus. Once the capacity of a node has been
reached, the node replaces the data with the highest
Euclidean distance to its cache focus in order to free
up space for new data. As a single node will thus
rather keep data near its cache focus, the overall cache
content can be controlled by moving the cache foci of
participating nodes into certain regions. Increasing
the density of cache foci in a geographic area also en-
larges the amount of memory allocated for that region
and thus raises the cache hit-rate for queries which
request data of that particular region. This observa-
tion forms the basis of this paper’s approach which
positions the cache foci according to dedicated distri-
bution functions characterized in the following.
Abstract Distribution Model. In (L
¨
ubbe et al.,
2013), we introduced an abstract mathematical model
to describe load distributions as probability density
functions. Formally, such a distribution function can
be defined as a two-dimensional function ρ : R
2
→ R
which maps geographic coordinates to an abstract
measure representing load. To balance load, we can
use such distribution functions to distribute the re-
sources, i.e. the cache foci, in the same way.
Load distribution functions can be classified into
anticipated, dynamic and holistic distributions. An-
ticipated distributions express statistical analysis of
previous workloads, heuristic assumptions about the
expected workloads or prior knowledge on data skew.
DATA2013-2ndInternationalConferenceonDataManagementTechnologiesandApplications
184

1
C
ρ
v
(z)
z
uniform distribution
0
custom distribution
r
z
r
(a) Cumulative distribution
0 1 4 5
2 3
z
r
=6
7
8 9 12 13
10 11 14 15
x
y
(b) Z-Curve
Figure 3: Generate custom distributions of cache foci.
These indicators play an important role in finding an
adequate resource allocation, as they enable to pre-
pare for expected situations before the actual load
strikes the system. For instance, assuming that users
mainly request onshore data we can define ρ
g
which
returns 1 in onshore regions 0 otherwise, as depicted
in Figure 2(a). A resource allocation according to this
function distributes the cache foci uniformly within
land parts and cuts out the sea areas. This coarse
model can be refined by function ρ
c
which returns
the number of objects per area. As shown in the bot-
tom part of Figure 2(b) this clusters the cache foci
in regions with high density and thus increases the
cache memory for data-intensive areas. Dynamic dis-
tributions measure the actual workload at a certain
point in space. Our example ρ
d
uses the positions of
the cache foci to situate the node’s current workload
(queries per second) in space. Due to unforeseen load
peaks, the actual workload may deviate from antici-
pated patterns, as visualized by the high peak in the
middle of Figure 2(c). With regard to the negligible
amount of data present in this area, we can observe a
clear oversupply of cache memory. For this reason, it
can be beneficial to fuse multiple aspects into a sin-
gle holistic distribution. Our example ρ
h
incorporates
ρ
c
and ρ
d
in equal shares. Thus, we obtain an allo-
cation which prioritizes regions where both workload
and data density is high, as observable in Figure 2(d).
3 IMPLEMENTATION
This section describes the concrete implementation of
the abstract load-balancing model. For that we inte-
grated the example distribution functions of the ab-
stract model into our system (see Section 3.1). Based
on link structures among the nodes of the cache net-
work, we propose a flexible reorganisation scheme
supporting multi-level load-balancing (see Section
3.2). Finally, we implement an algorithm which uses
the distribution functions of the abstract model to re-
alize multi-level load-balancing (see Section 3.3).
3.1 Integrating Distributions
The distribution functions of Figure 2 form an ex-
ample of a concrete load-balancing model which is
likely to be needed by a service provider of an LBS.
Other application domains may require different mod-
els, however. For this reason, our system supports ar-
bitrary load-balancing models by the inclusion of cus-
tom distribution functions. From these custom distri-
bution functions, we derive resource allocations (i.e.
distributions of cache foci) which are tailored towards
the service provider’s specific needs. In the follow-
ing, we present a method to calculate the positions of
cache foci using custom distributions. During our ex-
ample, we use a two-dimensional Gaussian distribu-
tion, denoted as ρ
v
, as representative for an arbitrary
custom distribution.
With probabilistic methods, a standard uniform
random number generator can be extended to do this
task. Best practices for the one-dimensional case can
be found in (Grinstead et al., 2006). However, ad-
ditional efforts are required for our two-dimensional
functions. For this reason, we applied a z-ordering
(Morton, 1966) to discretize a given distribution func-
tion ρ
v
and to map the two-dimensional coordinates
to one dimension. For each of the z-numbers, we
precomputed the corresponding function values of
ρ
v
and composed the cumulative distribution func-
tion C
ρ
v
(z) =
∑
i=z
i=0
ρ
v
(x
z
i
, y
z
i
), where x
z
i
, y
z
i
represent
the two-dimensional coordinates of the z-number z
i
.
The inverse of C
ρ
v
can be used to obtain random z-
numbers according to the original distribution func-
tion ρ
v
. As depicted in Figure 3(a), the z-numbers
which correspond to the uniform samples of the or-
dinate have the same frequencies as defined by our
Gaussian distribution function ρ
v
. Thus, for a given
uniform random number r with 0 ≤ r < 1, we used
C
−1
ρ
v
to retrieve the corresponding the z-number z
r
. To
obtain the final result, we generate a uniformly dis-
tributed random point within the corresponding cell
of z
r
(see Figure 3(b)). These points closely match
the distribution function ρ
v
(minus a negligible dis-
cretization error). With this method, we can produce
scattered point sets of any distribution function, such
as our examples of Figure 2. Note, that any space-
filling curve could have been used for this task. We
used a z-ordering because it is straightforward to im-
plement and yet very efficient to compute. For our
evaluation scenario (see Section 4) we achieved suffi-
cient results in terms of transformation accuracy with
a 5th order z-curve which comprises 32 cells in each
dimension, i.e., 1024 cells in total.
AnElasticCacheInfrastructurethroughMulti-levelLoad-balancing
185

3.2 Network Structure
In our system model, we assume the cache nodes to be
connected via a communication protocol such as the
Internet Protocol (IP), i.e., nodes can send or receive
messages using distinct network addresses. On top
of this communication structure, we assume a large
number of nodes that can unexpectedly join or leave
our network of cache nodes. Each node keeps the net-
work addresses of a respectably small subset of nodes,
thus limiting the impact of unexpected node join or
departure to local parts of the cache network. When
two nodes mutually know their network addresses, we
say they are connected via a link. Similar to com-
mon peer-to-peer models such as (Stoica et al., 2001),
every node in the cache network can be reached via
multiple-hop routing over the links. We continue with
a detailed description of distributed request process-
ing, describe how to maintain the cache network and
finally propose a mechanism to reorganize the net-
work structure during load-balancing.
Distributed Query Processing. To enable efficient
processing of range queries, the geographic relation
of the data being cached by the nodes has to be re-
flected in the link structure of the cache network. A
Delaunay triangulation of the cache foci constitutes
such a link structure which preserves the topological
relationship. Figure 4 depicts a Delaunay triangula-
tion where triangle vertices (black dots) represent the
cache foci and the triangle edges (bold lines) repre-
sent links between the corresponding nodes. The De-
launay property is met when no vertex exists which is
inside the circumcircle of any other triangle (a formal
definition can be found in e.g. (de Berg et al., 2000)).
In a Delaunay-based link topology, it is possible to
apply greedy routing, i.e., a node forwards a given
query to the neighbor that has the closest cache focus
to the requested query region until no closer neighbor
is found. The node at which greedy routing termi-
nates processes the query, as it has the closest cache
focus and thus most likely keeps the requested data in
its cache. In case of cache misses, the node fetches
missing data from the data back-end. On an arbitrary
graph greedy routing does not always find the global
optimum, but prematurely terminates at a local opti-
mum which is not closest to the query region. How-
ever, it is proven in (Bose et al., 1999) that greedy
routing always succeeds to find the closest node for
Delaunay-based link topologies.
For performance reasons, we do not force the
whole link topology to be coherent to the Delaunay
property all the time, but occasionally allow minor
deviations from that property in certain parts of the
link structure. Consequently, the accuracy of greedy
d
c
e
b
f
a
(a) Greedy routing
d
c
e
b
f
a
(b) Delaunay test
b
f
e
a
c
d
(c) Link reorganization
Figure 4: Move a node’s cache focus position.
routing will degrade, as the global optimum can not
always be found in a non-perfect Delaunay triangu-
lation. Nevertheless, this does not influence the cor-
rectness of the query results as every node is able to
request missing data from the data back-end. Yet, in-
accurate routing may decrease the cache hit-rate, as
a mislead query will be processed by a node whose
cache focus is not closest to the query region and thus
may not have cached as much of the requested data
as the optimal node. In our system, the movement
of cache foci may violate the Delaunay property in
certain regions and thus decrease the cache hit-rate.
Therefore it is necessary to reorganize the link struc-
ture once the routing accuracy has been decreased too
much.
Network Maintenance. Particularly for application
fields that can cope with partial routing inaccuracy, a
set of protocols were devised which are able to estab-
lish and maintain a Delaunay-based link topology in a
distributed setting under node churn, so that nodes can
join or leave unexpectedly (Lee et al., 2008). More-
over, it has been shown that the topology converges to
an accurate Delaunay topology once the churning has
stopped. In particular, this property is extremely use-
ful for our purposes, as it ensures that the system’s
efficiency returns to normal after adapting to node
churn or repositioned cache foci. Thus, this mainte-
nance protocol can be used for node joins and depar-
tures. However, to provide the flexibility needed for
our multi-level load-balancing, we extend this proto-
col in the following section.
Network Reorganisation. The maintenance protocol
outlined in the previous section can be extended by a
new primitive MOVE which moves a node’s cache fo-
cus to a certain position and updates the link structure
if required. Figure 4(a) depicts an exemplary network
before a node has moved. Suppose that the cache fo-
cus of node a ought to be moved into the center of
triangle (c, d, e). With greedy routing (visualized as
red arrows) we are able to find the closest node to
DATA2013-2ndInternationalConferenceonDataManagementTechnologiesandApplications
186

the destination position which is node d in our exam-
ple. Node d splits the destination triangle into three
new triangles and checks whether the new triangles
violate the Delaunay property. In our example it dis-
covers that the triangles (c, a, d) and (a, e, d) violate
the Delaunay property as b and f are contained by the
circumcircle as shown in Figure 4(b). Then node d
flips the edges (c, d) and (d, e) to obtain a triangula-
tion as depicted in Figure 4(c). As the flipped edges
may in turn violate the Delaunay property of differ-
ent triangles this process is recursively repeated until
no violations are found anymore. Then node d in-
forms the involved nodes (i.e., nodes b, c, e and f )
about the changed link structure. As the flipped edges
may in turn violate the Delaunay property of different
triangles this process is recursively repeated until no
violations are found anymore.
3.3 Multi-level Load-balancing
Our multi-level load-balancing approach operates in
two stages. The first stage determines a node’s ini-
tial cache focus when joining the cache network. The
second stage organizes the continuous repositioning
of cache foci during run-time.
Initial Cache Focus Positions. When a node joins
the cache network, we use an anticipated distribution,
such as our examples ρ
g
or ρ
c
of Figure 2 to calculate
the initial position. Greedy routing finds the closest
node which inserts the new node into the encircling
triangle of the calculated position. We assume that
each node determines its initial cache focus position
individually. Thereby it is crucial that all nodes use
the same anticipated distribution to determine their
initial position. In this manner, the nodes can au-
tonomously organise the positions of their cache foci
during the network construction and thus prepare the
system layout for anticipated load patterns.
Cache Focus Update. The general idea is that nodes
use ρ
h
of Figure 2 to periodically calculate a new po-
sition and move their cache focus towards it. To avoid
rapid zig-zag movements of cache foci and to ob-
tain a smooth distribution of resources, we base upon
standard k-means (Macqueen, 1967), which we ex-
tended to our distributed environment. Subsequently,
we sketch the procedure in pseudo code:
1: procedure UPDATEPOSITION(P =
{p
1
, p
2
, . . . p
k
})
2: Initialize indices i
j
← 1, ∀ j = 1, 2 . . . k
3: repeat
4: r ← Random point according to ρ
h
5: Find the closest point p
j
∈ P to r
6: p
j
←
i
j
∗p
j
+r
i
j
+1
7: i
j
← i
j
+ 1
8: until Average distance of the last λ move-
ments is lower than threshold τ
9: Initiate topology re-organisation for all
changed p
j
.
10: end procedure
Each node periodically executes UpdatePosition,
where P comprises the position of its cache focus
and all the cache foci of its direct neighbors. In the
interpretation of k-means, these positions resemble
the centers of k clusters. In each iteration, the al-
gorithm generates a random point r according to ρ
h
,
finds the closest cluster and updates the cluster cen-
ter p
j
. The iteration stops when the average distance
of the last λ movements is lower than a threshold τ.
In other words, the algorithm converges when our ac-
curacy criterion defined by λ and τ is met. This is
the state in which the points are smoothly distributed
according to ρ
h
. If the position of a node’s cache fo-
cus has changed during the computation, it initiates
a topology re-organization using the MOVE primitive
(see Section 3.2). Empirical analysis exposed that
the algorithm produces sufficient results for the val-
ues λ = 20 and τ = 50 m which we used throughout
all our experiments. In addition, we obtained accept-
able adaption rates using an update period of 5 s.
4 EVALUATION
In this section, we focus on examining the system
properties in respect to adequate resource allocation.
To measure the quality of resource allocation, we
begin with characterizing the adequateness of our
caching strategy in respect to given data requests. To
measure this aspect, we use the cache hit-rate. For a
given query, we define the hit-rate as the number of
objects retrieved from the cache divided by the num-
ber of objects satisfying the query. If no object sat-
isfies the query, nodes can often avoid sending a re-
quest to the data back-end, as they internally mark
empty regions. Thus, to avoid undefined values in the
empty result case, we define the cache hit-rate as 1 if
no back-end request was sent and 0 otherwise.
Furthermore, we look into the distribution of
workload among the nodes. Thereupon, we measure
the deviation of all nodes from the average workload
in the system. Let avg
t
be the average workload of all
n nodes at a time t and ω
t j
the workload of node j at
time t, then the average deviation can be defined as:
dev(t) =
∑
n
j=1
|ω
t j
− avg
t
|
n
(1)
From that we obtain
AnElasticCacheInfrastructurethroughMulti-levelLoad-balancing
187
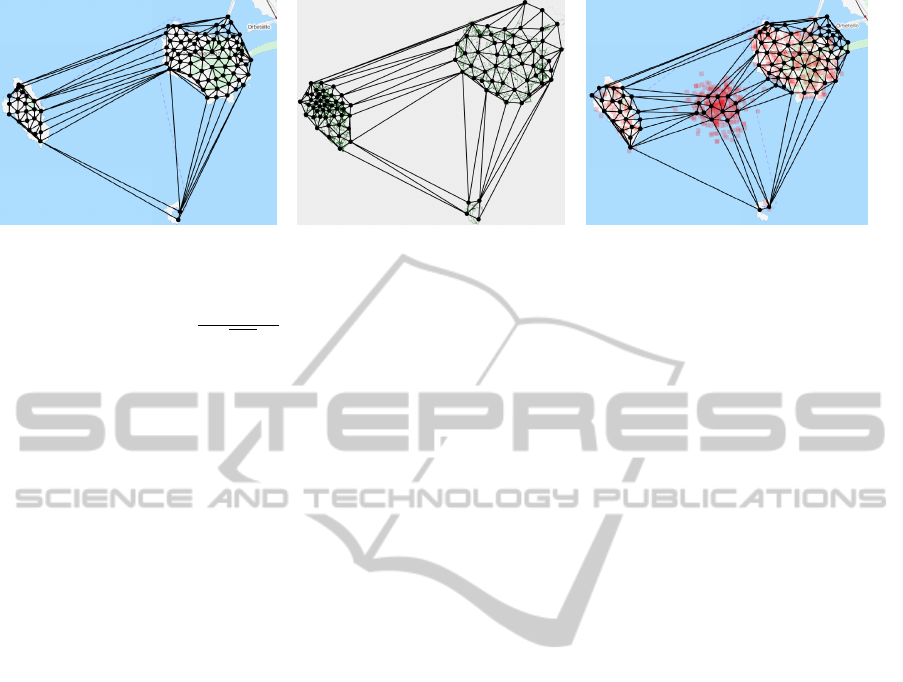
(a) Resource initialization with ρ
g
(b) Resource initialization with ρ
c
(c) Hot spot adaptation using ρ
h
Figure 5: Visualization of the cache network.
dev(t) =
1
1 + dev(t)
(2)
which constitutes our normalized optimality measure
for workload distribution.
We evaluated our approach by simulation using
PeerSim (Montresor et al., 2009), which bases on a
discrete event-driven simulation model. PeerSim is
able to simulate peer-to-peer networks. We extended
PeerSim in order to simulate our density-based spatial
cache network. The simulation bases on real world
data of the Italian island Giglio and its surroundings
extracted from OpenStreetMap. The data set com-
prises a total number of 36 777 objects. It covers
an area of roughly 32 × 35 km, in which data is not
spread evenly, but rather resembles the density of ge-
ographic features in the land parts of the coastal re-
gion. On top of this data, we emulate range queries
(500 x 500 m) at a rate of approximately 83 queries
per second. I.e. every 12 ms a query is sent to a ran-
domly chosen node in the cache network. The cache
network comprises a total number of 100 nodes which
are initialized with empty caches.
To compare our multi-level load-balancing al-
gorithm with a purely dynamic approach, we used
the load-balancing mechanism of our previous work
(L
¨
ubbe et al., 2012) which bases upon a particle-
spring model. In this model, the particles represent
the cache foci which are interconnected by springs.
Load-balancing is achieved by spring contraction in
regions with high load. Furthermore, we initialized
the particle-spring system by distributing the cache
foci uniformly across the space in rows of 10 cache
foci in each dimension. The optimization goal of the
load-balancing algorithm can be tuned towards work-
load and cache occupancy. Workload is defined as
queries per second, while cache occupancy is defined
as the number objects cached by a single node divided
by the area it covers. For spatial data sets that do
not contain vast empty areas this is a good approxi-
mation of the data density. However, in our scenario
which contains huge empty regions, this measure is
imprecise which leads to faulty load-balancing. For
that reason, we used a workload-only setting for all
our experiments. Through a specific parameter, β, the
stiffness of the particle-spring system and thus influ-
ences the adaption speed of the load-balancing algo-
rithm can be influenced. For each of the following
experiments, we empirically determined the most ad-
vantageous setting for β and compared the best results
of this parameter setting with the results of our multi-
level approach. In the following, we first examine the
system behavior when the actual load matches antici-
pated workload patterns. Then we study the effects of
deviation from the anticipated workload patterns.
4.1 Anticipated Workload
To examine the system behavior under anticipated
workload, we initialized our system with a node ca-
pacity of 800 objects per node and distributed the
cache foci according to ρ
g
, i.e. a uniform distribution
within land parts as visualized in Figure 5(a), and ρ
c
,
i.e. a data density-based distribution as depicted in
Figure 5(b). Then we emulated a uniform distribution
of 5 000 queries within the land parts. The simulation
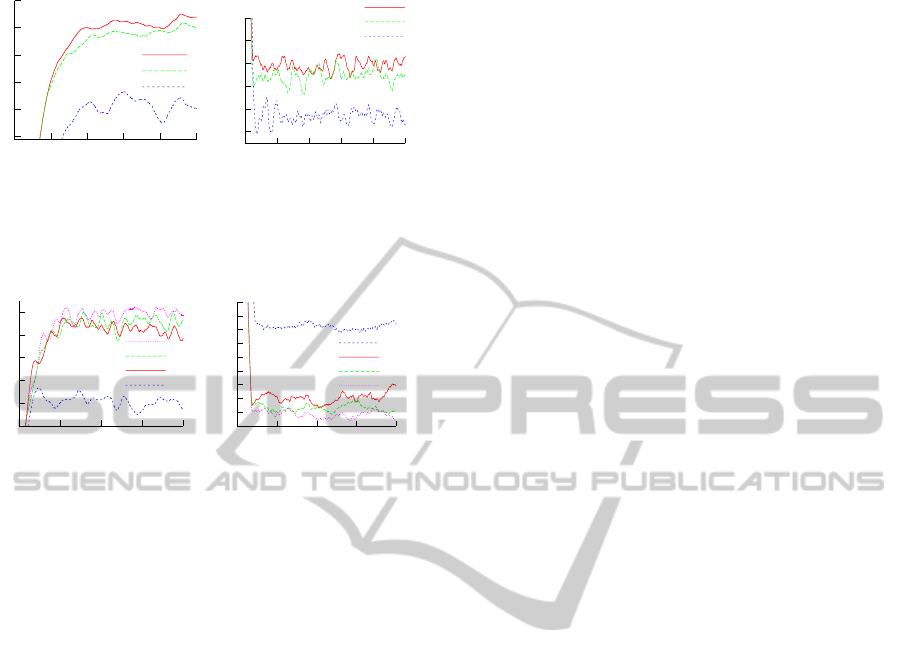
lasts for 1 min of simulation time. Figure 6(a) depicts
the hit-rate during the simulation. One can observe a
slightly better hit-rate for the data density-based dis-
tribution ρ
c
. The reason for this is the concentration
of cache memory in regions with a lot of data which
is a more suitable resource allocation strategy for our
data set. As it can be observed in Figure 5(b) data is
not distributed evenly within land parts, but is slightly
denser on the western island. Obviously, the more
non-uniformly the data is spread within land parts, the
better the data density-based resource allocation will
get. Moreover, we examined the optimality of work-
load distribution in Figure 6(b). The geometry-based
resource allocation slightly outperforms the density-
based allocation, as it distributes the resources uni-
formly within the land parts which match exactly
our expected workload. Alongside, we examined
DATA2013-2ndInternationalConferenceonDataManagementTechnologiesandApplications
188
0.5
0.6
0.7
0.8
0.9
1
0 0.2 0.4 0.6 0.8 1
hit-rate
simulation time [min]
ρ
o
ρ
G
PS
(a) width=3.5cm
0.52
0.54
0.56
0.58
0.6
0.62
0 0.2 0.4 0.6 0.8 1
dev(t)
simulation time [min]
ρ
G
ρ
o
PS
(b) Workload distribution
Figure 6: System parameters under anticipated workload
[capacity=800].
0.1
0.2
0.3
0.4
0.5
0.6
0 0.5 1 1.5 2
hit-rate
simulation time [min]
δ=1.0
δ=0.5
δ=0
PS
(a) Hit-rate
0.48
0.49
0.5
0.51
0.52
0.53
0.54
0.55
0.56
0.57
0 0.5 1 1.5 2
dev(t)
simulation time [min]
PS
δ=0
δ=0.5
δ=1.0
(b) Workload distribution
Figure 7: System parameters under deviated workload [ca-
pacity=300].
our purely dynamic particle-spring approach (PS) of
previous work (L
¨
ubbe et al., 2012) under the given
workload using β = 13. The results show the clear
supremacy of static load-balancing provided that the
actual workload meets the anticipated patterns.
4.2 Deviated Workload
To examine the system performance when the actual
workload deviates from anticipated patterns, we emu-
lated a hot spot of 5 000 queries in the sea area accord-
ing to a Gaussian distribution with a standard devia-
tion of 1 500 m. The hot spot workload comes on top
of anticipated workload, thus adding up to total work-
load of 10 000 queries. Moreover, we inspect the im-
pact of scarce resources on the system performance.
For that reason, we reduced the node capacity to 300
objects per node, i.e. with a total number of 100
nodes, the overall capacity of the cache memory sums
up to 30 000 objects which is approximately 80 % of
the complete data set size. We initialized our sys-
tem with ρ
g
(uniform distribution within land parts)
and used ρ
h
continuous adaptation towards the actual
load. In our example ρ
h
incorporates both ρ
g
and ρ
d
.
The parameter δ allows weighting between these two
aspects. Figure 7(a) depicts the hit-rate during the
simulation. The most obvious result is that compared
to Figure 6(a) all hit-rates have decreased. This is due
to the reduced node capacity. However, the best hit
rate is achieved by δ = 1, i.e. when the system favors
anticipated workload during load-balancing. This is
because most of the cache memory is preserved for
land parts where it is needed most. The hit-rate de-
grades slightly for lower values of δ. Contrary results
can be observed for the optimality of workload dis-
tribution in Figure 7(b) where low values of δ lead to
better results. In this case more nodes are assigned to
process the workload of the sea area which leads to
a better overall distribution of the workload between
the nodes. The particle-spring approach (β = 4) per-
forms quite well in terms of optimality of workload
distribution, as it is solely focused on distributing the
workload evenly among the nodes, but completely ig-
nores other aspects. The consequence is a disastrous
hit rate provoked by inadequate memory allocation.
5 CONCLUSIONS
The key aspects of load-balancing – data skew, antici-
pated workload and dynamic load peaks – can be con-
solidated into a single abstract mathematical model.
Static load-balancing techniques can only handle the
first two aspects, but are useless in the face of un-
predictable load peaks. Dynamic approaches solely
focus on the last issue and suffer from inadequate re-
source allocation.
In this paper, we take advantage of an abstract
load-balancing model to implement a distributed and
elastic cache infrastructure which supports multi-
level load-balancing. Through multi-level load-
balancing, the advantages of both static and dy-
namic approaches can be exploited to achieve supe-
rior load-balancing facilities. We examined our ap-
proach in a scenario of skewed data, anticipated and
unpredictable workload. Compared with the purely
dynamic approach of previous work (L
¨
ubbe et al.,
2012), we achieved significantly better resource uti-
lization. In our concrete scenario, we could save up
to 40 % of back-end accesses in comparison to the dy-
namic approach.
We conducted our work with focus on the appli-
cation field of spatial data processing. Beyond that,
our approach can be generalized to other application
fields which require high scale processing of data re-
quests over ranges, e.g., eScience applications in the
field of astrophysics. In principle, the only require-
ment is that the data can be numerically ordered and
a distance metric exists. Thus, it is even possible to
consider high-dimensional data with more than two
dimensions. For future work we plan to explore dif-
ferent application fields and to analyse the impact of
high dimensionality on our mechanism.
AnElasticCacheInfrastructurethroughMulti-levelLoad-balancing
189

REFERENCES
Aberer, K. et al. (2005). Indexing data-oriented overlay net-
works. In VLDB, pages 685–696. VLDB Endowment.
Bose, P. et al. (1999). Online routing in triangulations.
In ISAAC, pages 113–122, London, UK. Springer-
Verlag.
de Berg, M. et al. (2000). Computational Geometry: Algo-
rithms and Applications. Springer.
Grinstead, C. M. et al. (2006). Grinstead and Snell’s Intro-
duction to Probability. AMS.
Lee, D.-Y. et al. (2008). Efficient and accurate protocols
for distributed delaunay triangulation under churn. In
ICNP, pages 124–136.
L
¨
ubbe, C. et al. (2012). Elastic load-balancing in a dis-
tributed spatial cache overlay. In MDM ’12, pages
11–20, Washington, DC, USA. IEEE.
L
¨
ubbe et al., C. (2011). DiSCO: A Distributed Semantic
Cache Overlay for Location-based Services. In MDM
’11, pages 17–26, Washington, DC, USA. IEEE.
L
¨
ubbe et al., C. (2013). Holistic Load-Balancing in a Dis-
tributed Spatial Cache. In MDM ’13, Washington, DC,
USA. IEEE.
Macqueen, J. B. (1967). Some methods of classification
and analysis of multivariate observations. In Berke-
ley Symp. on Mathematical Statistics and Probability,
pages 281–297.
Montresor, A. et al. (2009). PeerSim: A scalable P2P sim-
ulator. In P2P, pages 99–100, Seattle, USA.
Morton, G. (1966). A Computer Oriented Geodetic Data
Base and a New Technique in File Sequencing. IBM.
Scholl, T. et al. (2009). Workload-aware data partitioning in
community-driven data grids. In EDBT, pages 36–47,
New York, USA. ACM.
Stoica, I. et al. (2001). Chord: A scalable peer-to-peer
lookup service for internet appl. In SIGCOMM, pages
149–160, New York. ACM.
Wang, H. et al. (2005). Aspen: an adaptive spatial peer-to-
peer network. In ACM GIS, pages 230–239, NY, USA.
ACM.
DATA2013-2ndInternationalConferenceonDataManagementTechnologiesandApplications
190
