
Crowd Simulation on a Graphics Processing Unit based
on a Least Effort Model
Sankha B. Dutta and Robert D. McLeod
Department of Electrical and Computer Engineering, University of Manitoba, Winnipeg, Canada
Keywords: Pedestrian Simulation, Agent based Modelling, Graphics Processing Unit (GPU), CUDA.
Abstract: Large crowd simulation is becoming a very important field of study for many researchers. In this paper we
endeavour to study large crowds and their interactions with each other and the environment. The interaction
is based on a very simple Least Effort Model inspired from a real world pedestrian modelling scenario. The
simulation of the crowd is computationally very expensive and GPU modelling and simulation is a viable
alternative computational means to accelerate the simulation process. Compute Unified Device Architecture
or CUDA is used for GPU implementation.
1 INTRODUCTION
Simulation of crowd movement is very important in
the areas of traffic and pedestrian interaction, game
design, animation and within crowd management
industries. Pedestrian crowds are ubiquitous and can
be observed in many different scenarios such as
crosswalks, streets, sporting and other mass
gathering events, etc. When crowd densities become
very large the situation can become vulnerable to
unpredictable behaviour with a chance for disaster
and so it is very important to obtain knowledge of
this type of situation. As it is not possible to emulate
this situation in the real world, simulation is possibly
the only solution for understanding behaviour of
large crowds. Crisis situations such as building
evacuation (Pelechano and Badler, 2006) are also
very important areas of study with added difficulty
due to the potential of panic. Researchers are finding
simulation of pedestrian movement to be very
promising and as such, there are several models to
simulate the movement of pedestrians in routine
and/or emergency situations. There are several
pedestrian models such as, cellular automata (Blue
and Alder, 2001; Weifeng and Hai, 2007), social
force models (Helbing, 1991; Helbing et al., 2002)
and agent based models (Cherif and Chighoub,
2010) each having their own advantages and
disadvantages.
While modelling the movement of pedestrians
there are several things that are important to keep in
mind. Pedestrians in their movement typically have
a goal towards which they move but at the same
time they try to avoid collisions with other
pedestrians. Taking these factors into account
pedestrians often try to make least effort decisions to
reach their goals or destinations. In this manner
pedestrians are able to have a somewhat optimized
path to their destination.
In our model the environment is divided into
regular cell grids and each agent or pedestrian
occupies a cell grid. The model is based on Least
Effort Model (LEM) (Sarmady et al., 2009). The
agents move by minimizing deviation along an
optimal path to their goal. In our model there are
minor modifications to this basic model that are
implemented.
Modelling pedestrian movement is
computationally expensive and the computation time
increases with the number of agents. To gain an
advantage in computation, a Graphics Processing
Unit (GPU) (Sanders and Kandrot, 2010; Kirk and
Hwu, 2010) is often used. GPU were developed for
graphics purposes and take advantage of many
processing cores. The introduction of Compute
Unified Device Architecture or CUDA (NVIDIA,
2012) by NVIDIA opened avenues for general
purpose GPU (GPGPU) parallel programming.
GPGPU programming is becoming a viable
alternative in fields which are very computationally
expensive. Modelling of crowds is one of those
applications well suited to GPUs. This work
addresses modelling difficulties and accelerated
369
B. Dutta S. and D. McLeod R..
Crowd Simulation on a Graphics Processing Unit based on a Least Effort Model.
DOI: 10.5220/0004488903690376
In Proceedings of the 3rd International Conference on Simulation and Modeling Methodologies, Technologies and Applications (SIMULTECH-2013),
pages 369-376
ISBN: 978-989-8565-69-3
Copyright
c
2013 SCITEPRESS (Science and Technology Publications, Lda.)

crowd behaviour modelling using a GPU.
Considerable emphasis is placed on attempting to
make CPU and GPU ABMs match (Wilensky and
Rand, 2007).
The paper is organized as follows, in section 2 a
discussion about the LEM is provided, in section 3
there is a brief discussion about GPU and CUDA, in
section 4 the detailed GPU implementation of the
crowd model is given. Section 5 contains the
speedup obtained using GPU and section 6 contains
the simulation results.
2 LEAST EFFORT ALGORITHM
AND MODEL DESCRIPTION
In our model, the environment is divided into a
lattice of rigid regular cells. Pedestrians or agents
(Hayes, 1999) are placed in the environment and
occupy a single cell. For simplicity all agents are of
same size. At the beginning of a simulation the
agents have an initial position and also a target or
goal. They move in the environment and try to reach
their goal or destination using a least effort model
(LEM).
A situation is emulated where the agents are on one
side of the environment and they are trying to reach
the other side of the environment. Agents
(pedestrians) have 8 neighbour cells as shown in
Figure 1.
Figure 1: Pedestrian agent with 8 neighbourhoods.
The movement of the pedestrian is dependent on
distance of the cell which is nearest to the target.
The cell which is nearest to the target has the highest
probability of becoming occupied and the cell which
is farthest will have the lowest probability of next
becoming occupied by the pedestrian. This is the
basic mechanism that makes the agent move along a
path which would take the least effort. In reality
pedestrians are free to take a path which is not
necessarily nearest to the target and so
randomization is incorporated in the model.
Prior to making a decision each pedestrian
determines the distance of each unoccupied adjacent
cell from the target and then ranks them according to
their distance. The lowest rank denotes the adjacent
cell which is nearest to the target and the highest
rank is the adjacent cell which is farthest from the
target. After that a random number is generated to
decide which cell to select. The agent then moves to
the cell chosen.
C
i
= (1- n
i
){D
min
/D
i
}
(1)
D
min =
Min(D
i
), n {0,1}, D
i
≠ 0
In equation (1) D
i
is the distance of all the
neighbouring 8 cells from the target and D
min
is the
minimum D
i
value. This distance only gets
calculated for those cells which are empty as n
i
becomes 1 occupied cells and C
i
evaluates to zero.
So, essentially C
i
gets calculated for the cells which
are empty but becomes 0 for the occupied cells.
Then all the calculated C
i
are ranked according to
their distances in ascending order. A random number
is generated for each of the agent to select a C
i
. In
order to generate a random number, a normal
distribution is used with a mean value of 0 and a
standard deviation of 3. By using the above
configuration numbers from 0 to 7 are generated.
Before calculating the C
i
s, a check is performed to
determine whether the agent is already lying in the
target column and if the cell in the next row is
empty. If it is empty then there is no further
checking is done and agent makes move forward
towards their target.
As mentioned earlier, in this model the pedestrians
are placed on one side of the environment and try to
move to the other side of the environment. In this
scenario, the pedestrians have the goal to reach the
other side of the environment only. So to achieve
this goal the traditional LEM is modified and the
target is simply the opposite side. As such, whenever
they are in a certain column that column is their
target column.
3 OVERVIEW OF GPU
ARCHITECTURE AND CUDA
PROGRAMMING MODEL
NVIDIA® introduced the first GPU in 1999. But
endeavours to exploit the GPU for non-graphical
purposes started in earnest from 2003. With the
introduction of Compute Unified Device
Architecture (CUDA) in 2007 NVIDIA® broadened
their scope of general purpose GPU computing.
GPUs are now used for many computationally
intensive tasks. In this section we briefly discuss the
C1 C2 C3
C4
C8
C7 C6 C5
SIMULTECH2013-3rdInternationalConferenceonSimulationandModelingMethodologies,Technologiesand
Applications
370
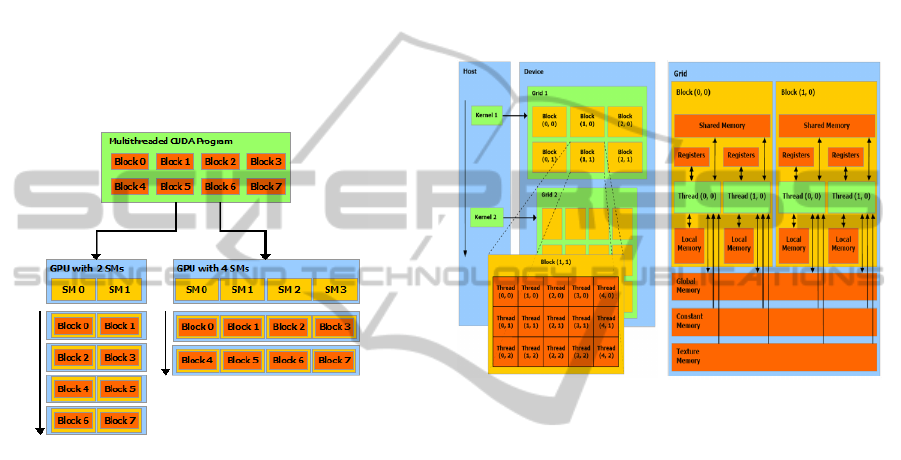
GPU features and CUDA architecture. Figure 2
shows a modern CUDA capable GPU architecture.
GPUs are mainly based on Single Instruction
Multiple Data (SIMD) architecture massive numbers
of threads for data level parallelism can be launched.
GPUs are organized into highly threaded streaming
multiprocessors (SMs) which are the building blocks
of the device.
The number of SMs varies from one GPU to
another. This project is based on the FERMI™
architecture (GEFORCE™ 560ti). This particular
card consists of 14 multiprocessing units, each
consisting of 32 cores for a total of 448 cores. Each
of these SIMD cores is capable of carrying out large
data parallel applications.
Figure 2: CUDA scalable GPU architecture (NVIDIA
2012).
Inside the GPU there is a 2 gigabytes of graphics
double data rate (GDDR) DRAM memory which is
an off chip memory also known as device or global
memory. Apart from device memory there is other
memory like shared memory which is much faster.
This memory behaves like L1 cache on-chip
memory and it is shared among the SIMD cores.
Each multiprocessor has a fixed number of registers.
There are also other memory like constant memory
and texture memory used for specific applications.
3.1 CUDA Programming Model
Figure 3 shows the CUDA programming model.
CUDA is basically a C/C++ program with GPU
extensions. The programming model of CUDA
offers the GPU as data-parallel co-processor to the
CPU. In the CUDA context, the GPU is called the
device, whereas the CPU is called host. At first the
data is copied to the global memory of the device
and then kernel functions are launched from the host
program and get executed on the GPU. The threads
of the CUDA application are arranged into 3D
blocks and the blocks are arranged into 3D grids.
Each thread has their unique identity and they can be
accessed based on their block identity and size. Each
of these thread blocks is computed in one of the
multiprocessors and multiple thread blocks can be
executed on same multiprocessor. However, there is
a limit to the maximum number of threads that can
be launched. Threads in a thread block are arranged
in a group of 32 threads which is known as warp.
This is the smallest unit in which the threads are
scheduled and executed on a multiprocessor.
Figure 3: CUDA programming/memory model (iXBT
Labs 2008).
4 GPU IMPLEMENTATION
OF LEAST EFFORT MODEL
In our model the agents are placed on the sides of
the environment and each tries to reach the opposite
side of the environment. The whole environment is
made up of rigid cells of the same size, dividing the
whole environment into rows and columns. We have
considered an environment which is square of size
500x500 and the environment is divided into cells
each of unit size. Each of agents is considered to
occupy a space of 1 unit. Two cases are considered
for simulation. In the first instance, the agents are
placed on two opposite sides and in the second
instance; the agents are placed on four opposite sides
of the environment. In this section we briefly discuss
the first case only as the basic implementation
method remains same.
4.1 Implementation Details
At first the agents are placed in the environment in a
random fashion up to a maximum number of rows.
CrowdSimulationonaGraphicsProcessingUnitbasedonaLeastEffortModel
371

Then the agents are updated with their target. For an
agent placed in the bottom of the environment the
initial target is the top row. In the CUDA program
each agent is considered to be a single thread. The
total number of threads launched is equal to total
number of agents present in the environment. First,
it is required to ensure that enough threads can be
launched to cover all the agents present in the
environment. Then the threads are arranged into
grids and blocks. In each of the simulation steps a
kernel function is launched which carries out the
agent movement.
Inside the kernel function, before carrying out
the LEM algorithm, an agent checks whether it is
placed in the target column. If true, then it verifies
whether the immediate cell in the forward direction
is empty or not. If empty then no further calculation
is performed and the agent proceeds forward.
Otherwise, a cell gets selected using LEM. The
pseudo code is shown below:
if(target_col == present column &&
forward_cell == 0)
move one cell forward
else
Calculate LEM.
No movement is observed when all neighbouring
cells are occupied.
4.1.1 Challenges in Implementation
The primary motivation of the implementation of the
model on the GPU was to gain speed in the
simulation while emulating the situation where the
pedestrians are capable of decision making.
Decisions of each agent are considered to be
independent of the other. The biggest challenge in
implementation of the algorithm was to keep the
total number of agents same, without any loss. As
mentioned, each of the agents is launched as single
thread and all of them are executed in parallel. So a
situation could arise when two agents try to access
the same environment position at the same time and
a loss of agent could occur. To avoid this kind of
scenario, atomic features of CUDA are used.
In the atomic operations when one of the threads
is performing an operation on a particular memory
location, residing either in global or shared memory,
then it does not get interfered with by operations of
other threads. An atomic function performs a read-
modify-write operation on 32 or 64 bit word which
is residing in global or shared memory. Inside the
kernel function, the agent first finds out the number
of neighbouring empty cells, calculates the distance
of the empty cell from the target and arranges them
in the ascending order. After that a random number
is generated which decides the cell number to be
selected. Once the cell is chosen, the movement of
the agent is achieved by calling the atomicExch()
function. In this way the numbers of agents are kept
intact in every simulation step and no agent
(memory) gets overwritten throughout the operation.
4.1.2 Generation of Random Numbers
Inside the kernel function, after the agents calculates
the distance of the available neighbouring empty
cells to the target and arranging them in the
ascending order, a random number is generated.
Random numbers are generated from a normal
distribution. A separate random number is obtained
for each agent. This is obtained by using cuRAND
library of which comes with the CUDA SDK.
Before the start of the simulation, a setup kernel is
launched once for the total number of pedestrians
present in the environment. Inside this setup kernel
there is the cuRAND application programming
interface (api) curand_init(). This kernel function is
essentially responsible to generate a seed which is
later fed to the main random number generator. The
random number from the normal distribution is
generated by using the curand_normal() api. This
normal distribution api is responsible for generating
a random number having a mean of 0 and standard
deviation of 1. But the result is multiplied by 3 to
obtain the desired standard deviation.
5 SPEEDUP
Simulation of the LEM for a large number of agents
is very computationally intensive. The primary
motivation of using GPU for the implementation of
the LEM algorithm is to accelerate the simulation
process. The time for the simulation process is
measured for both the CPU and GPU
implementations. The time is only measured for the
simulation and not for any memory transaction in
case of the GPU. As mentioned, the GPU used is
NVIDIA® GEFORCE™ 560ti and CPU used is
CPU is Intel Xeon E3-1280 (server grade).
For the GPU, time for the simulation process is
measured by using cudaevent functions. The
computation time both for CPU and GPU is given in
the Figure 4a and the speedup for the simulation is
provided in the Figure 4b. In Figure 4a the time is
measured in seconds along the Y-axis with the the
number of agents along the X-axis. This speedup is
measured using two groups of agents only (bi-
SIMULTECH2013-3rdInternationalConferenceonSimulationandModelingMethodologies,Technologiesand
Applications
372
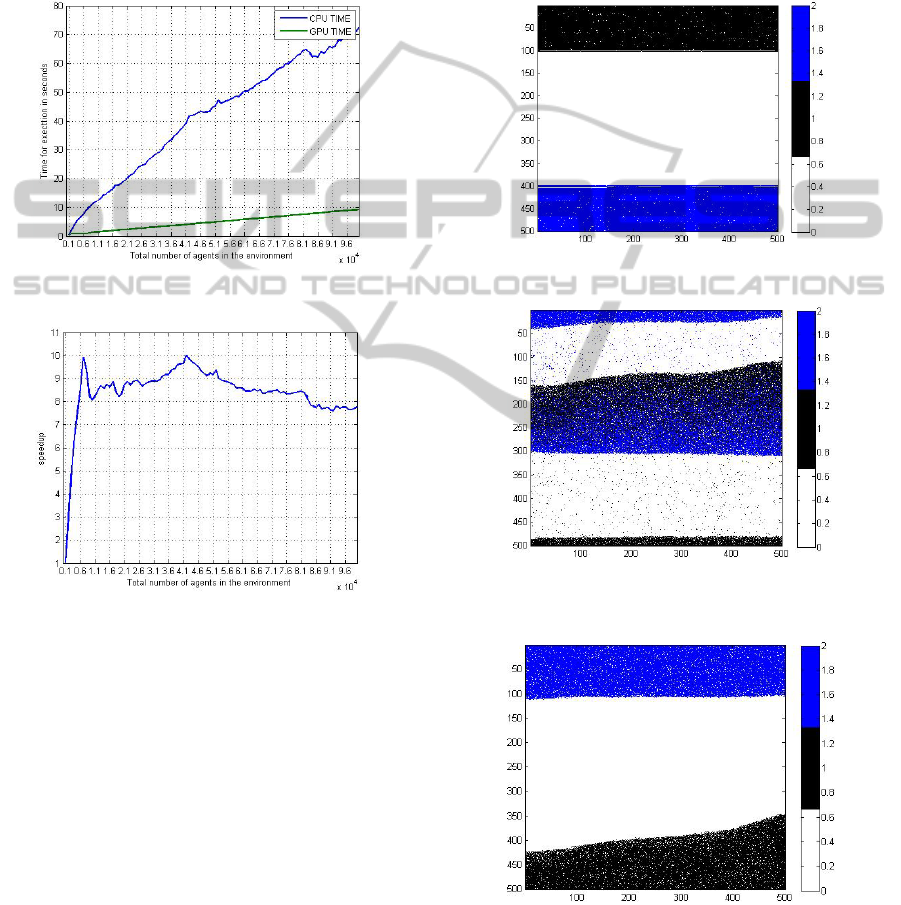
directional movement). The measurement of the
computation speed is initalized with 1,000 agents
and it is measured up to 100,000 agents with an
increment of 1,000 agents in each comparison.
In Figure 4b illustrates the speedup graph. When the
number of agents is 1000 the speedup is 1x. A
speedup of 10x is achieved when the number of
agents is 7000. The typical speedup is approximately
8x as the agent population increases further.
Figure 4a: Time computation of CPU and GPU.
Figure 4b: Speedup graph.
6 SIMULATION AND RESULTS
In this section, a brief discussion of the simulation is
provided followed by a discussion about the results.
6.1 Simulation
The visualization of the simulation is performed
using MATLAB™. In Figure 5a the scenario depicts
the initial situation of agents placed at opposite ends
of the environment. In this instance, the total number
of agents in the environment is 100,000. The
objective of black agents is to move to the bottom
and blues objective is to do the opposite. Figure 5b
and c depicts the simulation in the time step of 3,000
and 6,000 respectively.
The asymmetry seen is somewhat disconcerting
as similar results were not apparent from simulations
when run on the CPU. At this time suspicions are on
synchronization issues associated with each agent
being run as a thread. Although difficult to debug on
the GPU it may also be implementation of the next
cell that is providing a directional bias.
Figure 5a: Initial placement of 100, 000 agents.
Figure 5b: Simulation of 100,000 agents in time step
3,000.
Figure 5c: Simulation of 100,000 agents in time step
6,000.
More interesting dynamics are shown in Figures
6a, 6b and 6c when agents are placed on 4 sides of
CrowdSimulationonaGraphicsProcessingUnitbasedonaLeastEffortModel
373
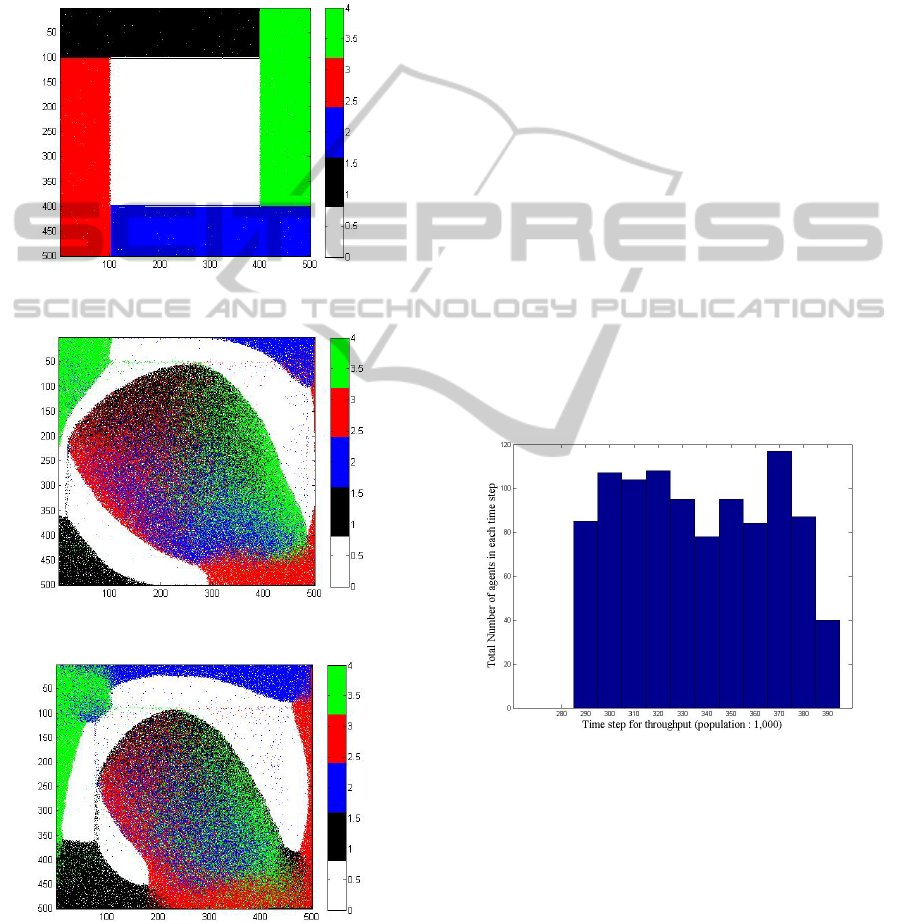
the environment. Figure 6a is the initial position of
the agents; Figure 6b and 6c are the simulation of
agents in time step of 3,000 and 6,000 respectively.
The total number of agents placed on 4 sides of the
environment in this scenario is 160,796. The
asymmetry of the flow is apparent resulting from the
asymmetry of the initial conditions as well as from
the underlying model implementation.
Figure 6a: Initial placement of 160,796 agents.
Figure 6b: Simulation step 3,000.
Figure 6c: Simulation step 6,000.
6.2 Results
In this section a brief discussion of throughput of the
agents is provided. The throughput is measured by
considering only two groups of pedestrians at
opposite sides. The number of rows up to which the
agents would occupy the environment initially is
kept fixed. The time required for the throughput i.e.
the agents to cross the other side of the environment
is measured. The total number of time steps is also
kept fixed at a maximum of 6000. Initially the
throughput results are obtained for only 1000 agents
(500 agents on each side). Then the next result is
carried out for 2000 agents (1000 agents on each
side) so on and so forth until the number of agents
reaches to 100,000. Figure 7a depicts the throughput
when the number of agents is 1000.
In Figure 7a, when the number of agents is 1000
the distribution seems to be almost uniform. All the
agents are seen to cross the environment between
time steps of 290 to 390. In Figure 7b, c, d and e the
number of agents are 25,000, 50,000, 75,000 and
100,000 respectively.
In Figure 7b, when the number of agents is 25,
000 a peak is observed between the time steps of
935 and 945 with a maximum throughput of
approximately 1,100. When the number of agents
increased to 50,000 the peak is observed between the
time steps of 2020 and 2030 with a maximum
throughput of approximately 1,250.
Figure 7a: Throughput of 1000 agents.
From Figure 7e, when the number of agents
increased to 100,000 the throughput takes an almost
a steady rise with the peek at the time step of 3,990
and then a sudden fall. There are 918 agents who are
not able to cross the environment within the given
time step of 6,000.
Figure 8a shows the mean of the throughput of
the agents. The x-axis on the graph is the increase in
the number of agents starting from 1,000 up to
100,000 with an increment of 1,000 in each step and
y-axis the average time taken. Figure 8b shows a
390
SIMULTECH2013-3rdInternationalConferenceonSimulationandModelingMethodologies,Technologiesand
Applications
374
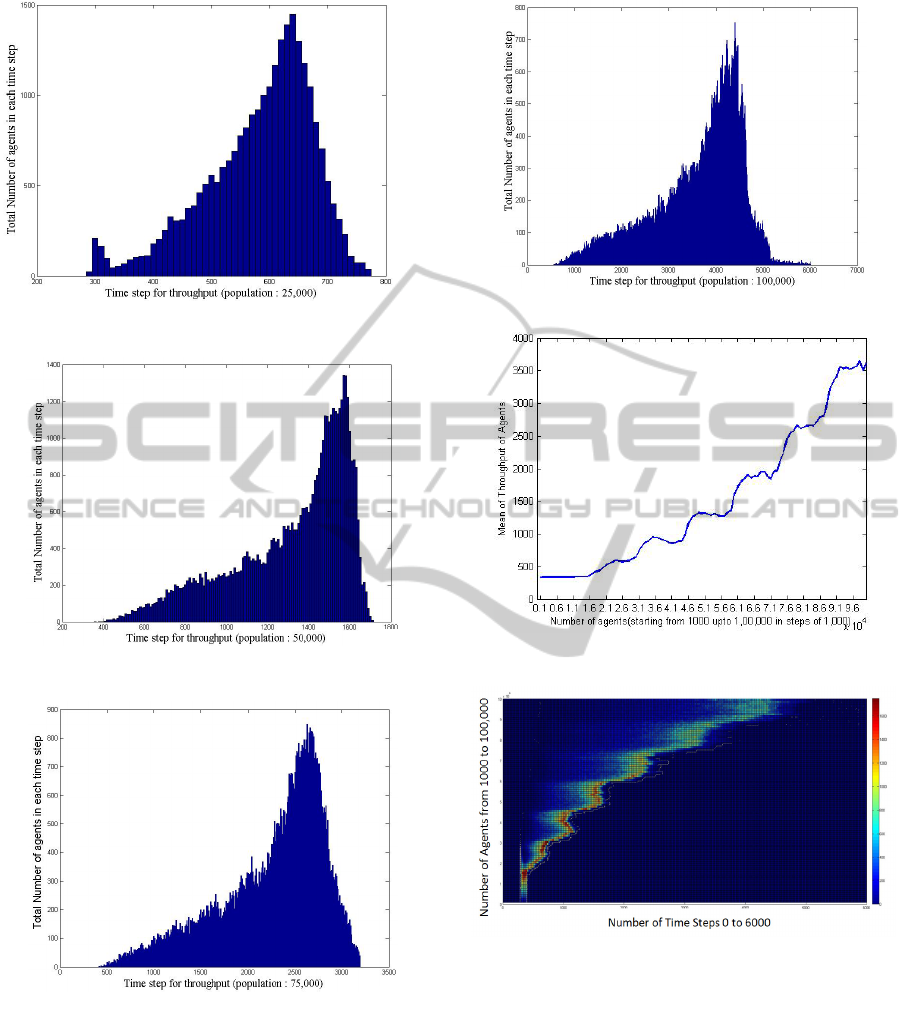
Figure 7b: Throughput of 25,000 agents.
Figure 7c: Throughput of 50,000 agents.
Figure 7d: Throughput of 75,000 agents.
heat map surface plot. From the surface plot, the
mean plot of Figure 8a is clearly seen. From the top
view it is clear that when the density is low then the
throughput of the agents is concentrated in a small
region which spreads in a non-Gaussian manner as
the density increases.
The periodic behaviour of the throughput is
believed to be an artefact of the computation on the
GPU. The cause of these phenomena is still being
Figure 7e: Throughput of 100,000 agents.
Figure 8a: Mean of throughput time for all agents.
Figure 8b: Top view of the 3D surface plot.
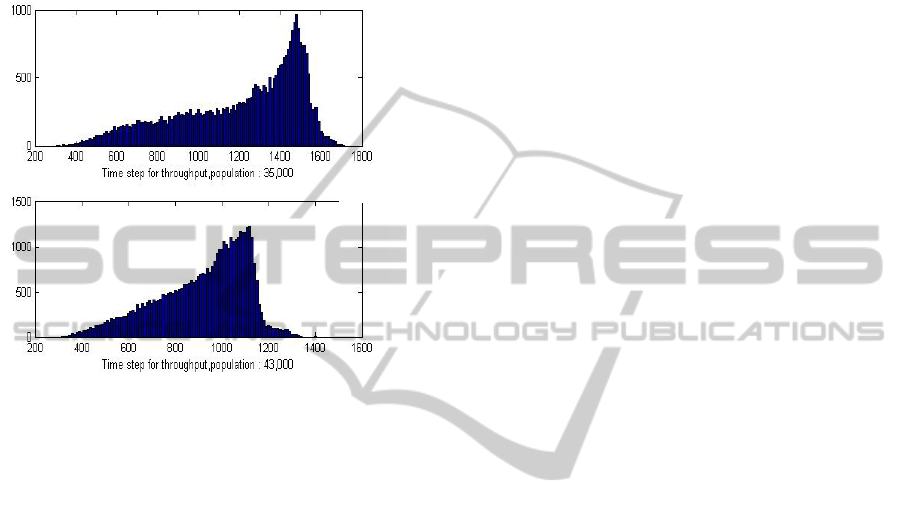
investigated. From Figure 8b it is observed that the
distribution spreads along x-axis, with the increase
in the number of agents. This spread however is
heavily skewed. With the increase of the number of
agents (measured along y-axis) the peak throughput
values in some cases occurs at lower time (measure
on the x-axis). This causes the graph of Figures 8a
and 8b to take an unexpected and artificial periodic
shape. One of such instance is shown in Figure 9. In
Figure 9 peak of the throughput of 43,000 agents is
less than that of 35,000 agents illustrating the
periodic nature of Figure 8a and 8b.
800
1800
3500
7000
CrowdSimulationonaGraphicsProcessingUnitbasedonaLeastEffortModel
375
These anomalies are systematic computation
artefacts and would not seem to be real phenomena
associated with crowd movement. We are again
attempting to resolve this issue. Even in light of the
anomalies and model discrepancies agent based
modelling of pedestrians appears to be well suited to
GPGPUs.
Figure 9: Comparing throughput of 35,000 and 43,000
agents
7 FUTURE WORK
In future work, in addition to concentrating on
model matching and validation, it would be
desirable to incorporate some psychological state in
each agent to achieve a more realistic world
scenario. There would also be some changes in the
implementation of the CPU where we would utilize
all the cores available on the CPU. The latest release
of CUDA 5 also has dynamic parallelism that can be
implemented on the KEPLER architecture. The GPU
that has been used here has the FERMI architecture.
As such, there are plans to use a GPU card with the
KEPLER architecture. In addition, the obvious
asymmetries in the simulations require further
investigation.
REFERENCES
Blue, V. J., Alder, J. L., March 2001. Cellular Automata
Microsimulation for Modeling Bi-Directional
Pedestrian Walkways. Journal of Transportation
Research Part B: Methodological, Vol. 35, Issue: 3,
pp. 293 -312.
Cherif, F., Chighoub, R., April 2010, Crowd Simulation
Influenced by Agent’s Socio-Psychological State.
Journal of Computing, Vol. 2, Issue: 4.
Hayes, C., Jan. – Feb. 1999. Agents in a Nutshell- A Very
Brief Introduction. IEEE Transaction on Knowledge
and Data Engineering, Vol. 11, Issue: 1, pp. 127 -132.
Helbing, D. October 1991. A Mathematical Model for the
Behavior of Pedestrians. Behavioral Science, Vol. 36,
Issue: 4, pp. 298 -310.
Helbing, D., Farkas, I., Molnar, P., Vicsek, T., Simulation
of Pedestrian Crowds in Normal and Evacuation
Situations. Pedestrian and Evacuation
Dynamics,Springer 2002, pp. 21 -58.
iXBT Labs, October 2008, Cuda programming model,
http://ixbtlabs.com/articles3/video/cuda-1-p5.html
Kirk, D., Hwu, W., February 2010. Programming
Massively Parallel Processors: A Hands-On
Approach. Morgan Kaufmann; 1
st
edition.
NVIDIA, October 2012. CUDA C Programming Guide.
http://docs.nvidia.com/cuda/pdf/CUDA_C_Programmi
ng_Guide.pdf.
Pelechano, N., Badler N. I., Nov.-Dec. 2006. Modelling
Crowd and Trained Leader Behaviour during Building
Evacuation. IEEE Magazine of Computer Graphics
and Application, Vol. 26, Issue: 6, pp. 80-86.
Sanders, J., Kandrot, E., July 2010. CUDA by Example:
An Introduction to General-Purpose GPU
Programming. Addison-Wesley Professional, 1
st
edition.
Sarmady, S., Haron F., Talib A., May 2009. Modeling
Groups of Pedestrians in Least Effort Crowd
Movements Using Cellular Automata. IEEE Third
Asia International Conference on Modelling and
Simulation, pp. 520 -525.
Weifeng, Y., Hai, T. K., June 2007. A novel algorithm of
simulating multi-velocity evacuation based on cellular
automata modelling and tenability condition. Physica
A: Statistical Mechanics and its Applications, Vol.
379, Issue: 1, pp. 250 -262.
Wilensky, U., Rand, W., 2007. Making Models Match:
Replicating an Agent-Based Model. Journal of
Artificial Societies and Social Simulation 10(4)2
<http://jasss.soc.surrey.ac.uk/10/4/2.html>.
1800
1
60
0
SIMULTECH2013-3rdInternationalConferenceonSimulationandModelingMethodologies,Technologiesand
Applications
376
