
ATMOS
A Data Collection and Presentation Toolkit for the Nevada Climate Change Portal
Andrew Dittrich, Sergiu Dascalu and Mehmet Gunes
Department of Computer Science and Engineering, University of Nevada, Reno, Nevada, United States
Keywords:
Climate Change, Data Repositories, Web Services, Service Composition.
Abstract:
Climate change is the subject of intense research, covering a broad range of causes and effects over long peri-
ods of time. Large data sources are needed to support this research, prompting scientists to turn to repositories
to collect and share data. Many repositories exist with various data formats and access methods, presenting
a challenging environment for researchers. Data portals help to address this by providing a central location
for data on a specific topic or region. The Nevada Climate Change Portal is one example, which provides
data to support research on Nevada’s climate. This portal was funded under an NSF EPSCoR grant with a
goal of sharing resources with similar portals in New Mexico and Idaho. This paper proposes the ATMOS
toolkit to help meet this goal and to address challenges facing climate change researchers. ATMOS is a plugin-
based toolkit that provides Access to Map and Tabular Online Services uniformly, regardless of the underlying
source. The design and construction of ATMOS are discussed, showing how the toolkit supports the Nevada
Climate Change Portal, and how it can meet future needs of researchers.
1 INTRODUCTION
Climate change has the potential to have a dramatic
effect on people everywhere, and is the subject of in-
tense research by scientists throughout the world. Cli-
mate change studies are usually long term in nature
and broad in scope, and require data from multiple
sources over significant periods of time. It may not be
feasible for researchers to collect the necessary data
directly, so researchers use existing data repositories
as a source of data.
One such data repository is the Nevada Climate
Change Portal, which was created through an NSF
EPSCoR grant with a goal to be a single access
point for climate change research that affects Nevada
(McMahon et al., 2011). The portal contains data col-
lected from a set of dedicated sensors deployed in the
Nevada desert. There are several other data reposi-
tories that contain data related to Nevada’s climate,
including similar portals in New Mexico and Idaho
that were also created under the same NSF EPSCoR
grant. It would help achieve the goal of creating a
single access point for Nevada’s climate change data
if this data was available through the Nevada Climate
Change Portal.
This paper proposes a toolkit named ATMOS, or
Access to Tabular and Map-based Online Services.
This toolkit will be used to collect data from data
repositories, combine it with data from other reposito-
ries, and present the results to the user via the Nevada
Climate Change Portal. It is designed to be extensi-
ble in order to support additional repositories in the
future. This is transparent to the user, who accesses
data through a user-friendly web front end.
This paper is based on work described in (Dittrich,
2012). Section 2 provides a background on climate
change data repositories and how they are used in
research. Section 3 discusses the motivation for the
work and our proposed solution. Section 4 details the
design of ATMOS, and Section 5 demonstrates the re-
sults. Section 6 compares ATMOS with related soft-
ware packages. Finally, Section 7 concludes the paper
and discusses opportunities for future work.
2 BACKGROUND
2.1 Climate Change Data
Climate change data can be described as data that is
used as the basis for research on the subject of climate
change.
Data describing the effects of climate change on
physical systems is commonly represented in tabu-
206
Dittrich A., Dascalu S. and Gunes M..
ATMOS - A Data Collection and Presentation Toolkit for the Nevada Climate Change Portal.
DOI: 10.5220/0004493202060213
In Proceedings of the 8th International Joint Conference on Software Technologies (ICSOFT-EA-2013), pages 206-213
ISBN: 978-989-8565-68-6
Copyright
c
2013 SCITEPRESS (Science and Technology Publications, Lda.)

lar form consisting of observations over time. Na-
tional Weather Service weather stations provide ob-
servations of temperature, humidity, and other phe-
nomena sampled over time. Hurricanes can be de-
scribed by a time-series of data points describing lo-
cation, wind speed, and pressure.
In some cases, this data occurs over a geographic
area, and is better represented as a map or as a geode-
tic grid, with a row for each discrete latitude and a
column for each discrete longitude. For example, sea
surface temperature measurements are typically rep-
resented as map. Surazakov and Aizen used topo-
graphic data to estimate the thickness and extent of
glaciers (Surazakov and Aizen, 2006).
Data describing effects on biological systems con-
sists of plant life cycles, animal breeding patterns, dis-
tribution of species, migration patterns, and similar
data. Although this type of data is not easily standard-
ized, some repositories, such as the National Pheno-
logical Network have been successful in storing ob-
servations of animal and plant behavior in a standard
format.
Data describing the causes of climate change can
be represented in tabular form. The the United States
Geological Survey provides a rich set of tabular data
for a particular volcanic eruption. Greenhouse gas
emissions can be represented in tabular form as a se-
ries of measurements over time.
Data describing causes of climate change are com-
monly represented in map form. Solar irradiance data
is spatial in nature, and well described on a map. The
National Land Cover Database provides a map of the
land cover for the United States, such as forestation or
urban areas, and changes over time (Fry et al., 2011).
A portion of this data is shown in Figure 1.
2.2 How Climate Change Data Is Used
The broad scope and extensive time scale of climate
change research requires multiple large data sets. For
example, Scuderi analyzed tree rings to reconstruct
temperature records for the Sierra Nevada over the
last 2000 years (Scuderi, 1993). Crowley’s work ana-
lyzed the causes of climate change over 1000 years
using data reconstructed from ice cores and trees
(Crowley, 2000). Vermeer and Rahmstorf identified a
relationship between global temperature and sea lev-
els (Vermeer and Rahmstorf, 2009) using temperature
data from NASA’s Goddard Institute for Space Stud-
ies and sea level data from Church and White (Church
and White, 2006). Bowerman and Clark used sed-
iment cores from alpine lakes to reconstruct glacier
activity over several millennia (Bowerman and Clark,
2011). Rosenzweig et al. used over 29,000 series of
data from over 80 studies to demonstrate the results of
climate change on both physical and biological sys-
tems (Rosenzweig et al., 2008).
Small, focused studies can gather data directly
from the field, or reconstruct data from available
sources such as ice cores. In many cases researchers
turn to data repositories as a primary source of data.
2.3 Data Repositories
Many climate related data repositories are available,
ranging from massive government-backed reposito-
ries to smaller repositories focused on a single area or
topic. These data repositories provide data in a simi-
larly wide range of data formats, metadata standards,
and access methods.
NOAA’s National Climatic Data Center provides
the world’s largest selection of data products cover-
ing current and historical precipitation, temperature,
sea surface temperatures, soil moisture, and obser-
vations of the physical environment. The National
Snow and Ice Data Center is focused on data de-
scribing the cryosphere, including current and his-
torical information on the extent and location of sea
ice, glacier inventories, snow cover maps, and frozen
ground maps. The National Phenological Network
provides a database of observations of plants and an-
imals from a network of scientists and researchers
throughout the United States. This includes obser-
vations on migrations, nest building, flowering, and
falling leaves.
The New Mexico and Idaho EPSCoR data por-
tals are focused on providing a single point of access
for each state’s climate. These portals provide access
to map-based and tabular data describing each state’s
climate (New Mexico EPSCoR website, 2011) (Idaho
EPSCoR website, 2011). The New Mexico EPSCoR
and Idaho EPSCoR data portals, as well as the Nevada
Climate Change Portal were funded in part by a Na-
tional Science Foundation EPSCoR grant. This grant
creates a 3-state consortium, and seeks to improve the
connectivity infrastructure and bandwidth, enhance
data interoperability, and utilize this infrastructure to
integrate research with education (Western Consor-
tium website, 2011).
The data in these repositories is available in a vari-
ety of formats and access methods ranging from self-
describing formats to unstructured data. Raster im-
ages in standard formats like JPEG and PNG are used
for map-based data. Some image formats, like Geo-
TIFF contain additional geographical data that allow
precise overlay with other images or maps. The Wa-
terML format is a self-describing XML based format
developed by CUAHSI for hydrologic data sources
ATMOS-ADataCollectionandPresentationToolkitfortheNevadaClimateChangePortal
207
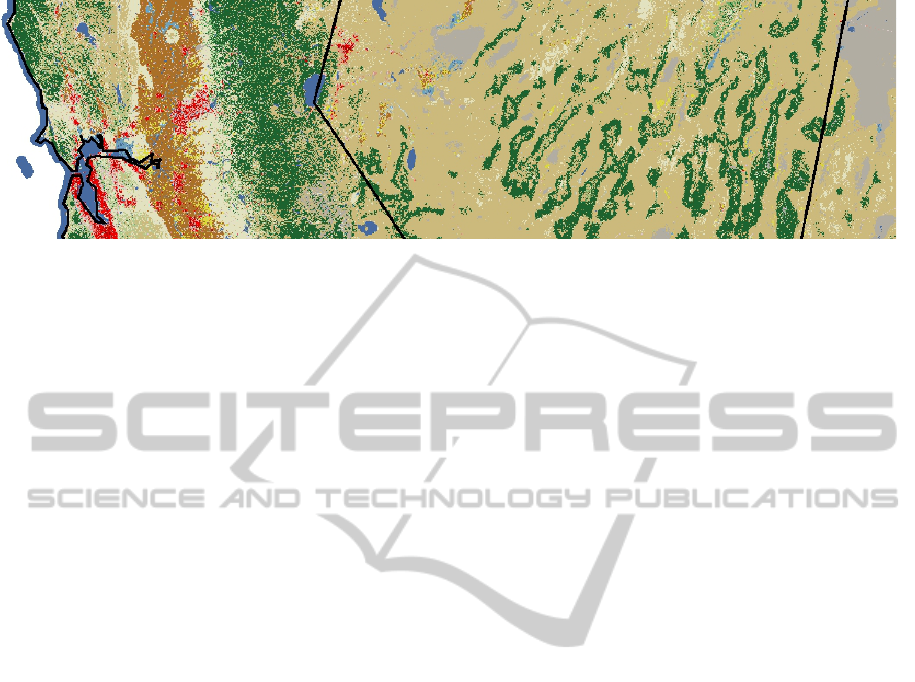
Figure 1: A portion of the National Land Cover Database data for Northern Nevada and California, United States.
(Whiteaker and To, 2008). The CSV format is com-
monly used for tabular data, but lacks the additional
information provided by other formats. Knowledge
of the data source is needed to properly interpret the
CSV data. The RDB format is similar to CSV, but
adds some metadata that specifies the data type of
each column. It also provides a comments section to
provide context for the data. Human readable data
formats are also commonly used, such as tables em-
bedded in web pages. Data can be extracted from
these sources by parsing the page and extracting the
desired data, when permissible, but this is not a robust
method for extracting research-grade data.
Metadata is data describing data. This may de-
scribe the data format itself, such as the units of mea-
surement, ranges, and data types. It may describe how
the data was gathered such as the equipment used,
storage devices, and researchers involved. Metadata
is unlimited in the type and quantity of data, and adds
to the usability and reliability of the data. For exam-
ple, Inouye’s data on flowering of Helianthella quin-
quenervis includes metadata describing the site where
the data was collected, including the type of GPS unit
used, whether the site was near a road, and the names
of the data collectors (Inouye, 2008).
There are several standard metadata formats. One
common standard is the Federal Geographic Data
Committee’s Content Standard for Geospatial Meta-
data. This defines a naming convention for attributes,
a standard structure, and a standard schema for the
data values. All United States federal agencies that
produce geospatial data are required to use this stan-
dard for metadata, and many other organizations use
this standard, such as the National Phenological Net-
work. A similar metadata format is described in ISO
standard ISO-19115.
Metadata plays a critically important role in defin-
ing the meaning of data and where it came from.
This is especially true in research where several par-
ties compile data in a collaborative effort. Metadata
allows data to be combined uniformly to allow for
larger scale studies. Metadata also establishes data
provenance and identifies the parties that are account-
able for the accuracy and reliability of the data, al-
lowing the research to stand up to scrutiny from the
scientific community.
Numerous data repositories and data formats lead
to a similar range of data collection methods. For
small scale research, data can be collected directly by
navigating to the data repository’s web interface, and
downloading the desired data. This paper focuses on
the automatic, large scale collection of data, which is
only feasible with standardized interfaces.
OPeNDAP is a general purpose protocol for the
exchange of scientific data that has been widely
adopted (Cornillon et al., 2009). A client requests
data from an OPeNDAP server using an HTTP re-
quest with a standard format that allows working
with multiple repositories. The Open Geospatial Con-
sortium publishes multiple standards, including stan-
dards for the Web Map Service (WMS) protocol.
This web service is widely used for the exchange of
geospatial data. Requests for a Web Map Service con-
sist of a URL followed by several parameters in a
query string (Beaujardiere, 2006).
3 MOTIVATION AND PROPOSED
SOLUTION
The primary motivation for this paper is to extend
the capabilities of the Nevada Climate Change Portal.
This portal is funded through a NSF EPSCoR grant
along with similar portals in Idaho and New Mexico,
and has a goal to provide Nevada climate change re-
search results and data to members of the research
community as well as the public. It also strives to
create an infrastructure that can support this type of
research, and can be reused by other systems in the
future (McMahon et al., 2011).
The Nevada Climate Change Portal already col-
lects data from equipment deployed in the field
(Nevada Climate Change Portal website, 2011). Ad-
ICSOFT2013-8thInternationalJointConferenceonSoftwareTechnologies
208

ditional data relevant to Nevada climate change
research should be available directly through the
Nevada Climate Change Portal to better support re-
searchers. To help achieve this goal, a software toolkit
has been developed called ATMOS, or Access to Tab-
ular and Map-based Online Services. This toolkit can
be used to collect climate change data from multiple
repositories, and present it for use by the end user.
A plugin-based framework provides extensibility to
support multiple data sources and support future ex-
pansion. This work will be integrated into the Nevada
Climate Change Portal to support collecting data from
multiple sources.
4 SOFTWARE SPECIFICATION
AND DESIGN
The ATMOS toolkit uses a layered architecture, as
shown in Figure 2. This incorporates the classic
presentation, data access, and business logic layers
(Fowler, 2003), and adapted for ASP.NET (Esposito,
2011). The presentation consists of ASP.NET web
pages and the corresponding C# code-behind. The
data access layer provides strongly-typed interfaces
to external data sources including web services and
the database of available services. The business logic
layer provides methods to send requests to web ser-
vices and process the corresponding responses.
4.1 Providing Extensibility
The ATMOS toolkit uses plugins to support new data
sources without changes to the core logic. These plu-
gins use the .NET Managed Extensibility Framework,
or MEF (Griffiths et al., 2010), which allows ATMOS
to automatically discover new plugins. A set of inter-
faces allows uniform treatment of both map and tabu-
lar data sources.
Every plugin implements the IService interface.
The requestServiceInformation method is retrieves
service metadata and returns an updated Service ob-
ject with normalized data.
Plugins that access map based data implement the
IMapService interface. The requestLayers method re-
turns a list of Layer objects for a service, which con-
tain map properties including a geographic bounding
box and a unique internal name. Layers implement
the composite design pattern (Gamma et al., 1995),
and support hierarchical organization of layers. The
requestMapImage method retrieves a Bitmap image
from a service.
Plugins that access tabular data implement the
ITabularService interface. The requestSeriesGroups
method returns a list of SeriesGroup objects that rep-
resent a logical group of data, such as a data collection
site. The requestSeries method takes returns a list of
Series from a series group. The requestData method
returns a DataTable object, which must have one col-
umn named Time with a DateTime type to support
combination with data retrieved from other services.
The ability to combine and correlate data from
multiple sources is a key, distinguishing feature of the
ATMOS toolkit. Accomplishing this for maps is rel-
atively straightforward, and can be done by overlay-
ing several map layers. Combining data from tabular
services is more challenging. The ATMOS provides
default time-based combination, and allows flexibil-
ity by using plugins for more complex data combina-
tion. These plugins use the MEF framework, and im-
plement the ITableCombiner interface. This interface
has a single combine method that takes two DataTable
objects and returns the combined DataTable.
4.2 Included Plugins
Several plugins were developed and included in the
implementation of the ATMOS toolkit.
First, a Web Map Service plugin provides access
to several sources including NOAA and New Mexico
EPSCoR data sources. This plugin constructs the ap-
propriate HTTP requests, and parses XML responses
in order to retrieve requested map images.
Second, an ArcGIS map service plugin provides
access to maps served by the ArcGIS MapServer
(Kennedy, 2006), which is used by several reposito-
ries, including the Idaho EPSCoR website. This plu-
gin constructs HTTP requestes and parses JSON re-
sponses in order to retrieve requested map images.
Third, a local map service plugin is included
to retrieve map data stored in a local file system.
This serves images created from Stewart and Carl-
son’s Geologic Map of Nevada (Stewart and Carlson,
1978), and formatted into a set of tiles using the Map
Cruncher tool from Microsoft Research (Elson et al.,
2007). This simplified plugin provides an example
showing how to extend the toolkit.
Fourth, a USGS Water Data plugin provides ac-
cess to time series water data for numerous sites
throughout the United States. This plugin constructs
HTTP requests to retrieve RDB format site data or
WaterML format data series (Reston, 2003). The plu-
gin parses the responses to create strongly typed data
tables.
Finally, a WaterOneFlow plugin provides access
to multiple hydrologic sources, including the Boise
State Hydroserver. WaterOneFlow provides a stan-
dard interface to hydrologic data services that hides
ATMOS-ADataCollectionandPresentationToolkitfortheNevadaClimateChangePortal
209
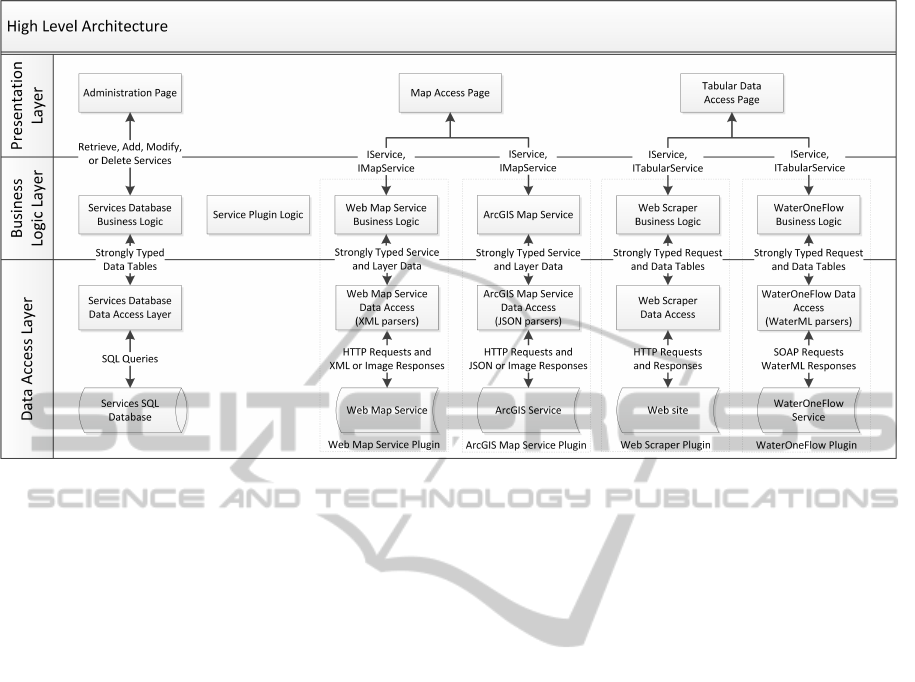
Figure 2: A diagram of the ATMOS toolkit showing the layered architecture. Plugins are enclosed in dashed-line rectangles.
complexity from end users through the use of a
SOAP interface (Whiteaker and To, 2008) (Tarboton
et al., 2011). The plugin leverages Visual Studio’s
service reference support to automatically generate
code based on a WSDL description (Daigneau, 2011).
The plugin parses WaterML responses to generate
strongly typed data tables.
4.3 Database Design
The toolkit uses a database to store service informa-
tion, as shown in Figure 2. Only the minimum data
required to contact the service is stored. This includes
the title of the service, the URL, the associated plugin,
and an optional version. All other data is retrieved di-
rectly from the service.
5 APPLICATION EXAMPLE
The ATMOS toolkit’s functionality is exposed
through a web site. This contains an administration
page, a map access page, and a tabular data access
page. This section walks through how to use the
ATMOS toolkit, highlighting the implementation re-
sults and demonstrating the value it provides to re-
searchers.
5.1 Administration
The administration page allows adding new services,
updating existing services, or deleting services. To
add a new service, the user has to enter the url for the
service metadata. The exact location will vary by ser-
vice, and each plugin provides specific details in help
text to aid users. When the user clicks insert to add
the service, the toolkit queries the provided URL, per-
forms corrections as necessary, including URL canon-
icalization, and lists the service capabilities.
5.2 Map Access
The map access page displays a wizard-style interface
that initially lists the available map services in a hier-
archical format. The user expands the service nodes
to reveal supported layers, and selects the layers to
be displayed. When the user clicks the next button,
the details of the selected layers are displayed along
with a link to the metadata associated with the ser-
vice. Clicking on the finish button will display an in-
teractive map with the selected layers. An example
showing an ArcGIS-served map of agroclimate zones
in Idaho, a WMS-served map showing soils in New
Mexico, a local set of tiles showing a geologic map
of Nevada, and WMS-served radar conditions from
NOAA’s NowCoast service is presented in Figure 3.
ICSOFT2013-8thInternationalJointConferenceonSoftwareTechnologies
210
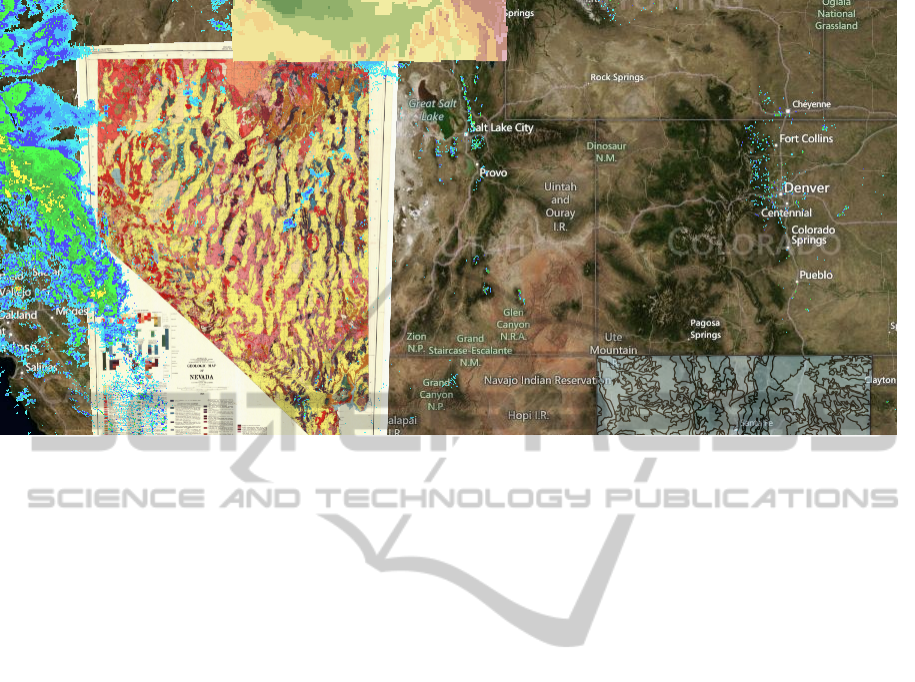
Figure 3: Results of a map request for a Nevada geology, Idaho agroclimate zones, New Mexico soils, and radar conditions.
5.3 Tabular Data Access
The tabular data access also displays a wizard-style
interface with a hierarchy of available services, sites,
and data series. The user selects the data to retrieve
and clicks next. A table is displayed showing the se-
lected series and details for each, including the avail-
able date range and a link to the metadata. The user
selects the date range to retrieve and clicks the get
data button to display the results in a table. A save
button allows the user to save the data as a CSV
file. An example showing streamflow data served by
the WaterOneFlow plugin from the Boise State Hy-
droserver, and two locations served by the USGS wa-
ter data plugin is presented in Table 1.
6 COMPARISON WITH
RELATED WORK
ATMOS attempts to meet the unique needs of the
Nevada Climate Change Portal, but there are sev-
eral other software packages and websites that pro-
vide similar functionality and more. This section ex-
plores some of these alternatives and compares them
to ATMOS. Table 2 summarizes the feature set of
ATMOS as it compares to these software packages.
It should be noted that we are not claiming that the
ATMOS toolkit has the same level of sophistica-
tion and technical capabilities as the related software
packages surveyed in this section, which were cre-
ated by teams of people over many years. Rather, we
would like to show that the ATMOS toolkit, devel-
oped essentially by a single person over a relatively
short period of time, has the core functionality needed
for its purpose. What distinguishes our solution is in
fact that it is a customized and highly focused solution
for the specific needs of the Nevada Climate Change
Portal. This gives a greater level of control over future
development of the toolkit and allows for a straight-
forward extension of our project.
ArcGIS server is part of a suite of commercial
product created by ESRI. The server component al-
lows creating, editing, managing, and deploying web
imagery and other GIS data to end users through var-
ious web APIs and services. There are associated
client components to allow access to this data, includ-
ing ArcGIS Viewer and ArcGIS Explorer. The Arc-
GIS server provides other functionality that is well
outside the scope of ATMOS, including geoprocess-
ing and web editing (ESRI, 2011). The ArcGIS suite
of products is designed for large clients such as mu-
nicipalities, large scale research data providers, or
corporations.
HydroDesktop is a desktop application used to ac-
cess data cataloged by CUAHSI’s Hydrologic Infor-
mation System. It supports discovery of available
data sources, and allows users to download time series
data. Although HydroDesktop uses maps to discover
available data, it does not serve maps, and doesn’t in-
terface with map-based web services (Tarboton et al.,
2011) (Ames et al., 2012).
MapServer is an open source server applicaiton
that provides tools for constructing maps from files
including GeoTIFF and ERSI Shapefiles. It sup-
ATMOS-ADataCollectionandPresentationToolkitfortheNevadaClimateChangePortal
211
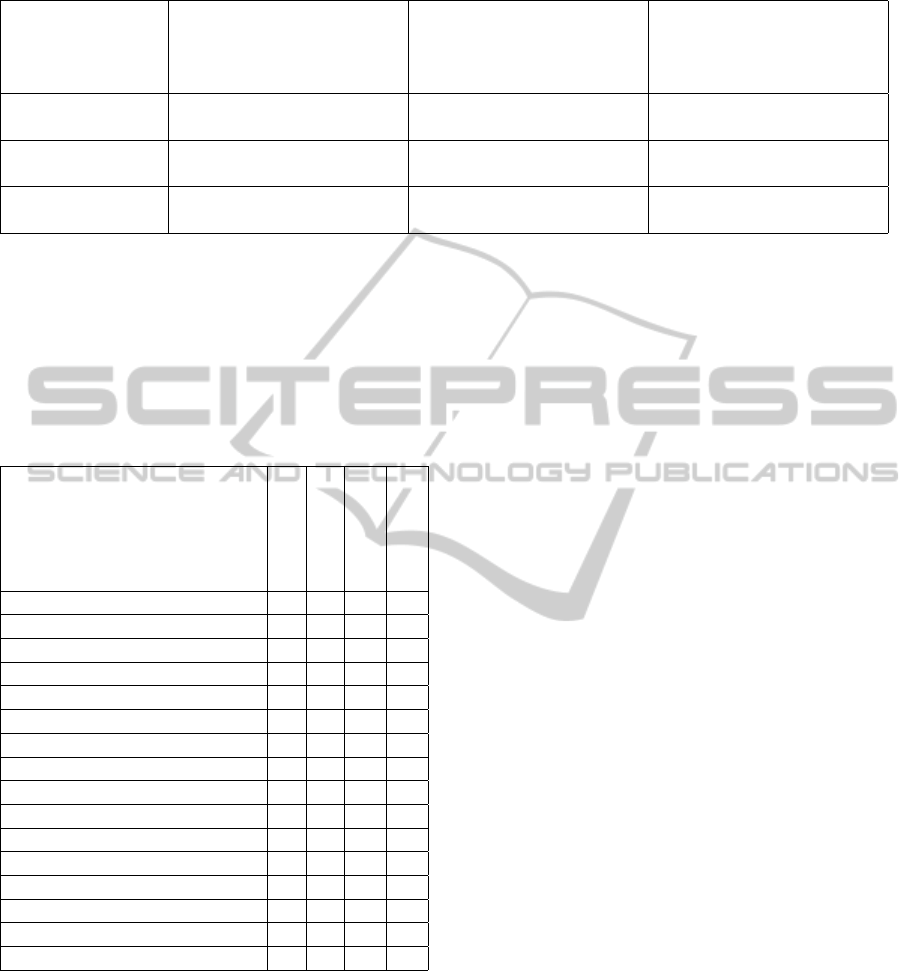
Table 1: Results of a tabular data request from the Boise State Hydroserver and the USGS Water Data service.
Time Boise State Hydroserver-
Dry Creek Experimental
Watershed-Lower Gage-
Streamflow
USGS Water Data-
LAMOILLE CK NR
LAMOILLE, NV-
Discharge
USGS Water Data-
GALENA CK AT
GALENA CK STATE
PARK, NV-Discharge
1/10/2010
12:00:00 AM
2.22 3.3 5.7
1/11/2010
12:00:00 AM
2.22 3.3 5.7
1/12/2010
12:00:00 AM
2.41 3.4 5.9
ports accessing maps through OGC Web Map Ser-
vices (Mitchell, 2005), and can be extended to sup-
port more formats. Unlike ATMOS, MapServer only
serves maps, and doesn’t have support for time series
tabular data.
Table 2: A comparison of the feature set of ATMOS and
several related software packages. An ’X’ indicates that the
software supports that feature.
ATMOS
ArcGIS
MapServer
HydroDesktop
Access map services X X X
Access Web Map Service X X X
Access ArcGIS Map Service X X
Access local maps X X X
Provides web services X X
Access tabular services X X
Access WaterOneFlow service X X
Access USGS Water service X X
Tabular data discovery X
Enterprise GIS management X
Geospatial analysis X X
Extensible X X X X
Web-based interface X X X
User support X
Free X X X
Open source X X X
7 CONCLUSIONS AND FUTURE
WORK
This paper has described a proposal to achieve the
goal of sharing data between the Nevada, Idaho, and
New Mexico EPSCoR web sites to support climate
change research as it applies to Nevada. The result
was ATMOS, a plugin-based toolkit for Accessing
Tabular and Map-based Online Services. A web front
end was created based on these components, and was
designed to be integrated with the Nevada Climate
Change Portal in the future.
ATMOS is not unique in its abilities to provide
map data or explore tabular data, as discussed in Sec-
tion 6. However, ATMOS is unique in its applicability
to the specific needs of the Nevada Climate Change
Portal, as well as in providing a uniform interface for
working with both map-based and tabular based ser-
vices. This capability of combining map-based and
text-based services distinguishes ATMOS from exist-
ing similar toolkits.
ATMOS is a fully functional web-based appli-
cation designed to meet the needs of climate re-
searchers. However, there is room for improvement,
and further work that needs to be done before it is a
viable product for large scale public consumption.
The performance of the toolkit should be im-
proved by caching recently retrieved map layers or
time series data to avoid duplicate requests for data.
The user interface could be enhanced through the use
of more client side processing and asynchronous up-
dates. A usability study should also be performed to
make the most robust and usable interface possible.
More plugins should be written to support additional
data sources, including a plugin to access geodetic
gridded data from the INSIDE Idaho data repository.
It is the ultimate goal of ATMOS to be integrated
into the Nevada Climate Change Portal. This work
will include updating the user interface to match the
look and feel of the portal through the use of CSS,
and merging the underlying database with existing
databases on the portal.
This work will contribute to the Nevada Climate
Change Portal’s goal of becoming a central point
for climate change research in Nevada, and to share
data with related portals in New Mexico and Idaho.
This will support researchers in the daunting task of
collecting data for their work on climate change in
Nevada.
ICSOFT2013-8thInternationalJointConferenceonSoftwareTechnologies
212

ACKNOWLEDGEMENTS
The material in this paper is based in part upon work
supported by the National Science Foundation under
grant number EPS-0919123.
REFERENCES
Ames, D. P., Horsburgh, J. S., Cao, Y., Kadlec, J.,
Whiteaker, T., and Valentine, D. (2012). HydroDesk-
top: Web services-based software for hydrologic data
discovery, download, visualization, and analysis. En-
vironmental Modelling & Software, 37(0):146 – 156.
Beaujardiere, J. d. l. (2006). OpenGIS
R
Web Map Server
implementation specification version 1.3.0. Techni-
cal Report OGC 06-042, Open Geospatial Consortium
Inc.
Bowerman, N. D. and Clark, D. H. (2011). Holocene glacia-
tion of the central Sierra Nevada, California. Quater-
nary Science Reviews, 30(9-10):1067 – 1085.
Church, J. A. and White, N. J. (2006). A 20th century accel-
eration in global sea-level rise. Geophysical Research.
Letters, 33.
Cornillon, P., Adams, J., Blumenthal, M., Chassignet,
E., Davis, E., Hankin, S., Kinter, J., Mendelssohn,
R., Potemra, J., Srinivasan, A., and Sirott, J.
(2009). NVODS and the development of OPeNDAP.
Oceanography, 22(2):116127.
Crowley, T. J. (2000). Causes of climate change over the
past 1000 years. Science, 289(5477):270–277.
Daigneau, R. (2011). Service Design Patterns: Fundamen-
tal Design Solutions for SOAP/WSDL and RESTful
Web Services. Addison-Wesley Professional.
Dittrich, A. (2012). ATMOS - A Data Collection and Pre-
sentation Toolkit for the Nevada Climate Change Por-
tal. Master’s thesis, University of Nevada, Reno.
Elson, J., Howell, J., and Douceur, J. R. (2007).
MapCruncher: Integrating the world’s geographic in-
formation. SIGOPS Oper. Syst. Rev., 41(2):50–59.
Esposito, D. (2011). Programming Microsoft ASP.NET 4.
Microsoft Press.
ESRI (2011). ArcGIS 10.1 for Server functionality matrix.
Technical Report J-9805, ESRI.
Fowler, M. (2003). Patterns of Enterprise Application Ar-
chitecture. Addison-Wesley.
Fry, J., Xian, G., Jin, S., Dewitz, J., Homer, C., Yang, L.,
Barnes, C., Herold, N., and Wickham, J. (2011). Com-
pletion of the 2006 National Land Cover Database
for the conterminous United States. Photogrammet-
ric Engineering and Remote Sensing, 77(9):858–864.
Gamma, E., Helm, R., Johnson, R., and Vlissides, J.
(1995). Design Patterns: Elements of Reusable
Object-Oriented Software. Addison-Wesley Profes-
sional.
Griffiths, I., Adams, M., and Liberty, J. (2010). Program-
ming C# 4.0. O’Reilly Media, Inc.
Idaho EPSCoR website (2011). Idaho EPSCoR website.
http://www.idahoepscor.org. Accessed 9/13/2011.
Inouye, D. W. (2008). Effects of climate change on phenol-
ogy, frost damage, and floral abundance of montane
wildflowers. Ecology, 89(2):353–362.
Kennedy, M. (2006). Introducing Geographic Information
Systems with ArcGIS. John Wiley and Sons, Inc.
McMahon, M. J., Dascalu, S., Jr., F. H., Strachan, S.,
and Biondi, F. (2011). Architecting climate change
data infrastructure for Nevada. In Lecture Notes in
Business Information Processing, LNBIP-83, pages
354–365. Advanced Information Systems Engineer-
ing Workshops CAISE-2011, Springer.
Mitchell, T. (2005). Web Mapping Illustrated. O’Reilly.
Nevada Climate Change Portal website (2011). Nevada Cli-
mate Change Portal website. http://sensor.nevada.edu.
Accessed 7/15/2011.
New Mexico EPSCoR website (2011). New Mexico
EPSCoR website. http://nmepscor.org/. Accessed
9/13/2011.
Reston, V. (2003). User’s manual for the national water
information system of the U.S. Geological Survey.
Technical Report 03-123, U.S. Geological Survey.
Rosenzweig, C., Karoly, D., Vicarelli, M., Neofotis, P., Wu,
Q., Casassa, G., Menzel, A., Root, T. L., Estrella, N.,
Seguin, B., Tryjanowski, P., Liu, C., Rawlins, S., and
Imeson, A. (2008). Attributing physical and biologi-
cal impacts to anthropogenic climate change. Nature,
453:353–357.
Scuderi, L. A. (1993). A 2000-year tree ring record of
annual temperatures in the Sierra Nevada Mountains.
Science, 259(5100):1433–1436.
Stewart, J. H. and Carlson, J. E. (1978). Geologic Map of
Nevada [map]. http://www.nbmg.unr.edu/Pubs/Misc/
Stewart&Carlson500K.pdf. Accessed 8/1/2012.
Surazakov, A. and Aizen, V. (2006). Estimating volume
change of mountain glaciers using SRTM and map-
based topographic data. IEEE Transactions on Geo-
science and Remote Sensing, 44(10):2991 –2995.
Tarboton, D. G., Maidment, D., Zaslavsky, I., Ames, D.,
Goodall, J., Hooper, R. P., Horsburgh, J., Valentine,
D., Whiteaker, T., and Schreuders, K. (2011). Data in-
teroperability in the hydrologic sciences, the CUAHSI
hydrologic information system. Proceedings of the
Environmental Information Management Conference
2011, pages 132–137.
Vermeer, M. and Rahmstorf, S. (2009). Global sea level
linked to global temperature. Proceedings of the Na-
tional Academy of Sciences, 106(51):21527–21532.
Wagner, R. (2010). Effective C#. Addison-Wesley.
Western Consortium website (2011). Western Consor-
tium website. http://www.westernconsortium.org. Ac-
cessed 9/16/2011.
Whiteaker, T. and To, E. (2008). CUAHSI Web Services for
Ground Water Data Retrieval. Ground Water, 46(1):6–
9.
ATMOS-ADataCollectionandPresentationToolkitfortheNevadaClimateChangePortal
213
