
Optical Couplers in Multimode MIMO Transmission Systems
Measurement Results and Performance Analysis
Andreas Ahrens and Steffen Lochmann
Hochschule Wismar, University of Technology, Business and Design, Philipp-M¨uller-Straße 14, 23966 Wismar, Germany
Keywords:
Multiple-Input Multiple-Output (MIMO) System, Optical Fibre Transmission, Multimode Fiber (MMF).
Abstract:
The concept of MIMO (multiple input multiple output) transmission over multimode fibers has attracted in-
creasing interest within the last years. Theoretically, the performance of the optical MIMO multimode channel
is well predictable. However, the realization of the optical MIMO channel requires substantial further research.
In this work the efficiency of optical couplers in MIMO systems is studied in a 1,4 km multimode testbed.
Optical couplers have long been used as passive optical components able to combine or split SISO (single-
input single-output) data transmission from optical fibers. Our results show by the obtained measured impulse
responses together with the simulated BER performance that optical couplers are well suited for the optical
MIMO transmission despite their insertion losses and asymmetries. Comparing the different couplers those
which maintain the different optical mode groups support the MIMO transmission more efficiently.
1 INTRODUCTION
In the recent past the concept of MIMO (multiple in-
put multiple output) transmission (K¨uhn, 2006; Fos-
chini, 1996) over multimode fibers has attracted in-
creasing interest in the optical fiber transmission com-
munity, targeting at increased fiber capacity (Singer
et al., 2008; Aust et al., 2012). The fiber capacity
of a multimode fiber is limited by the modal disper-
sion compared to single-mode transmission where no
modal dispersion except for polarization exists.
In MIMO transmission dispersion can be used to
outperform the SISO transmission from an informa-
tion theoretic point of view leading to higher fiber
capacities and under practical circumstances to lower
bit-error probabilities. The description of the optical
MIMO channel has attracted attention and reached
a state of maturity (Singer et al., 2008; Hsu et al.,
2006; B¨ulow et al., 2011). However, the realiza-
tion of the optical MIMO channel requires substantial
further research (Sch¨ollmann and Rosenkranz, 2007;
Sch¨ollmann et al., 2008).
Against this background, the novel contribution
of this paper is the use of optical couplers within a
1,4 km multimode (2 × 2) MIMO testbed. Based
on the channel measurements, the different propaga-
tion paths within the MIMO system are described.
Together with the appropriate MIMO modeling and
the corresponding signal processing (e.g. singular
value decomposition), the efficiency of different opti-
cal couplers in MIMO communication is elaborated.
The remaining part of this contribution is orga-
nized as follows: Section 2 reviewsthe optical MIMO
basics. Practical issues of optical MIMO including
the use of optical couplers are introduced and dis-
cussed in section 3. The performance criteria used to
evaluate the different optical couplers are introduced
in section 4, while associated performance results are
presented and interpreted in section 5. Finally, section
6 provides our concluding remarks.
2 OPTICAL MIMO
An optical MIMO system can be formed by feeding
different sources of light into the fiber, which support
different optical modes. Theoretically, it can be done
by using two single mode fibers as shown in Fig. 1.
The different sources of light lead to different power
distribution patterns at the fiber end depending on the
transmitter side light launch conditions. Fig. 2 high-
lights the measured mean power distribution pattern
at the end of a 1,4 km multimode fibre. Together
with the appropriate receiver side spatial configura-
tions, i. e. spot and ring filter (see Fig. 3), the electri-
cal MIMO channel can be formed. Fig. 3 illustrates
the corresponding transmitter and receiver side con-
figuration. Fig. 4 highlights the resulting electrical
398
Ahrens A. and Lochmann S..
Optical Couplers in Multimode MIMO Transmission Systems - Measurement Results and Performance Analysis.
DOI: 10.5220/0004497303980403
In Proceedings of the 4th International Conference on Data Communication Networking, 10th International Conference on e-Business and 4th
International Conference on Optical Communication Systems (OPTICS-2013), pages 398-403
ISBN: 978-989-8565-72-3
Copyright
c
2013 SCITEPRESS (Science and Technology Publications, Lda.)
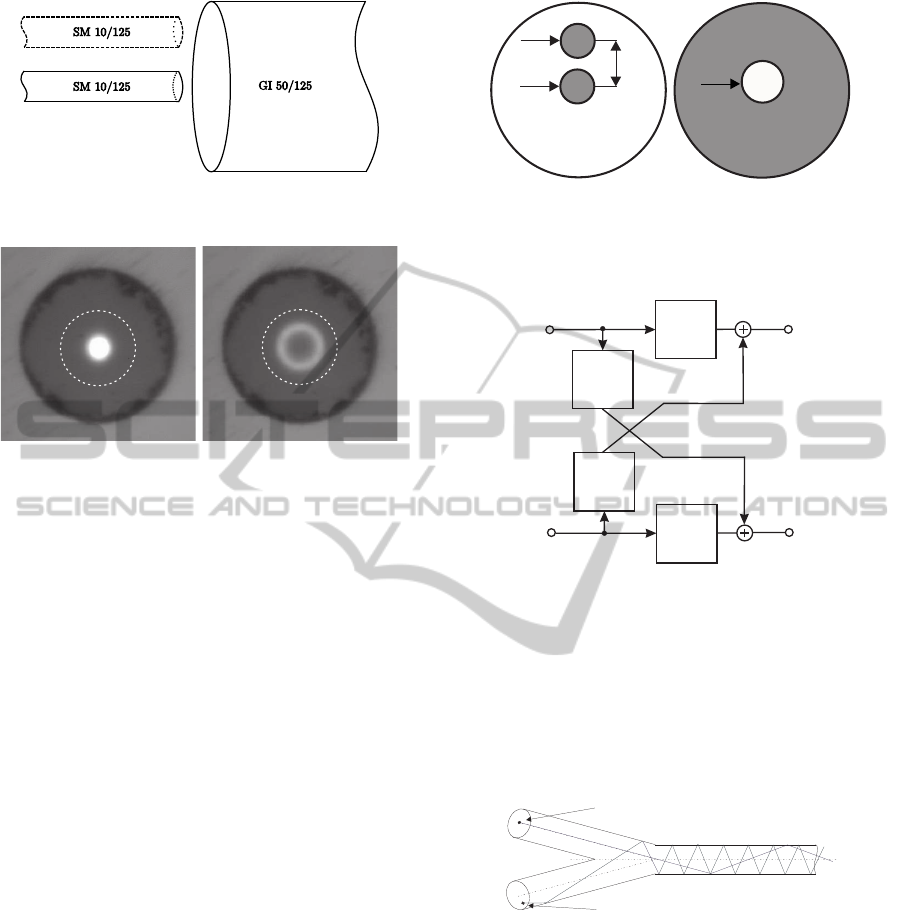
Figure 1: Transmitter side configuration with center and
offset light launch condition.
Figure 2: Measured mean power distribution pattern as
a function of the light launch position (left: eccentricity
δ = 0µm, right: eccentricity δ = 18µm); the dotted line rep-
resents the 50µm core size.
MIMO system model.
Investigation in (Ahrens et al., 2011) have shown
that an eccentricity of δ = 10µm and a mask diame-
ter of r = 15µm was found to be beneficial for mini-
mizing the overall BER at a fixed data rate. However
technologically an eccentricity of δ = 10µm can not
be realized with two single mode fibres with a core
size of 10µm each. Therefore other transmitter side
light launch conditions are in the focus of interest.
3 PRACTICAL ISSUES
OF OPTICAL MIMO
A possible solution for feeding different sources of
light in parallel in the fibre can be provided by optical
couplers. In this section, various optical couplers are
analyzed for their suitability in optical MIMO trans-
mission systems (see Fig. 5). The focus within this
section is on the transmitter side.
It is well known that optical couplers may show a
very mode selective behavior (Lochmann and Becker,
1983). In general this behavior depends on the fabri-
cation technique (Lochmann et al., 1983). Although
the term ’mode selectivity’ usually referred to the un-
wanted coupling ratio’s dependency on the launching
conditions we can make use of this parameter to con-
trol or better to maintain the mode groups within such
a device.
10µm
10µm
TX
2
TX
1
δ
RX
2
RX
2
RX
1
r
Figure 3: Forming the optical MIMO channel (left: light
launch positions at the transmitter side with a given eccen-
tricity δ, right: spatial configuration at the receiver side as a
function of the mask diameter r).
u
s 1
(t)
u
s 2
(t)
u
k 1
(t)
u
k 2
(t)
g
11
(t)
g
21
(t)
g
12
(t)
g
22
(t)
Figure 4: Electrical MIMO system model (example: n = 2).
Fig. 6–9 show the measured mean power distri-
bution patterns at the fibre end when using different
couplers at the transmitter side for feeding different
sources of light into the fibre. The obtained intensity
patterns aren’t normalized nor related to each other.
However, a good insight into the spatial mode struc-
ture is obtained.
(low order mode path)
(high order mode path)
1
2
3
Figure 5: Transmitter side coupler for launching different
sources of light into the MMF.
Due to its inherent coupling mechanism the so
called surface or evanescent field couplers, e.g. the
fusion couplers start to couple light into the neigh-
bor waveguide with the high order modes first. The
strength of this behavior can be controlled by the de-
gree of fusion. Therefore, the fusion coupler with the
asymmetric coupling ratio which is realized by ap-
plying a low degree of fusion can easily split mode
groups into high and low orders or combine them as
can be seen when comparing Fig. 6 and 7. Unfortu-
nately these asymmetric fusion couplers give also rise
OpticalCouplersinMultimodeMIMOTransmissionSystems-MeasurementResultsandPerformanceAnalysis
399
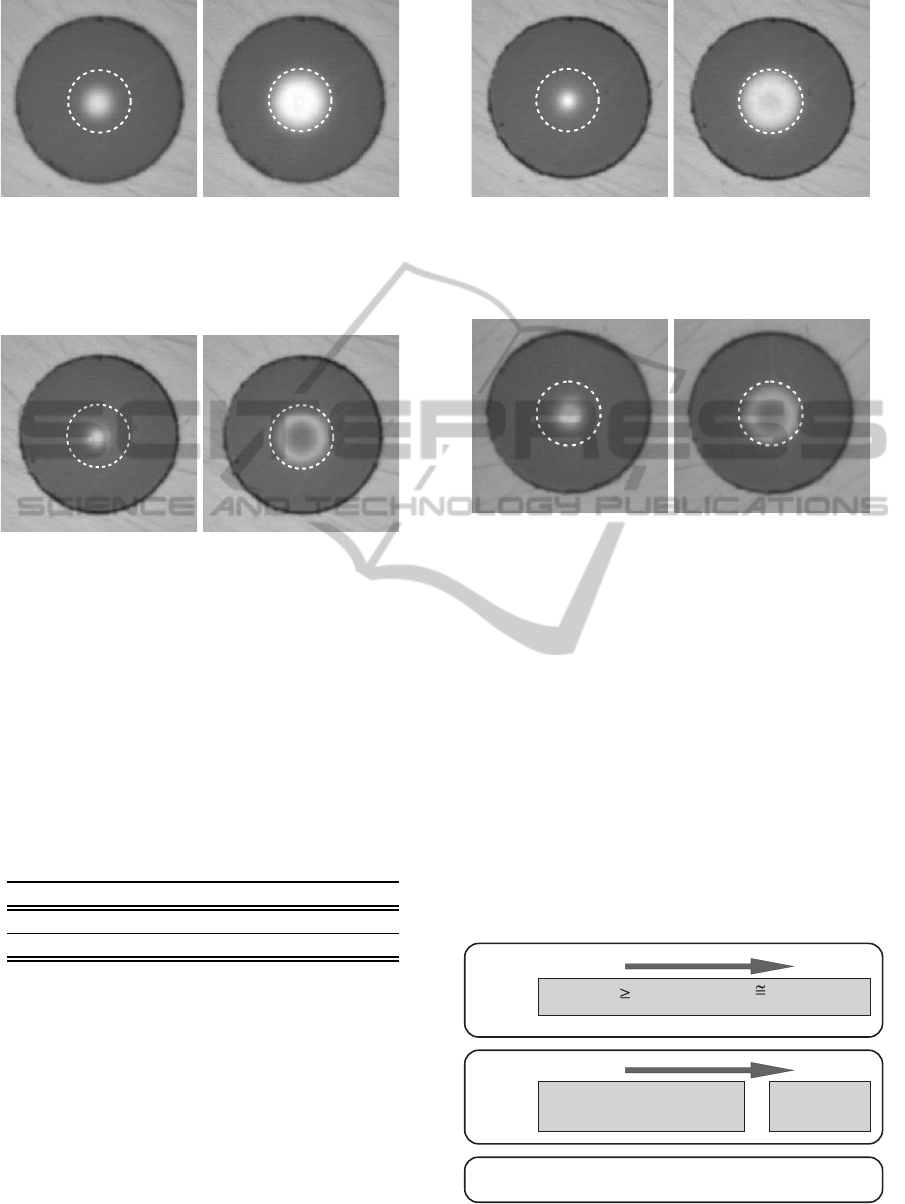
Figure 6: Measured mean power distribution pattern when
using the symmetric fusion coupler (SFC) at the transmitter
side (left: center light launch condition; right: off-center
light launch condition, δ = 11µm); the dotted line represents
the 50µm core size.
Figure 7: Measured mean power distribution pattern when
using the asymmetric fusion coupler (AFC) at the transmit-
ter side (left: center light launch condition; right: off-center
light launch condition, δ = 15µm); the dotted line represents
the 50µm core size.
to very asymmetric MIMO channels which is caused
by their coupling ratio (see Tab. 1). The coupling ra-
tio a
cr
can be obtained from the insertion losses a
12
and a
13
and results in
a
cr
= |a
13
− a
12
| . (1)
Table 1: Parameters of the transmitter-side couplers mea-
sured with restricted mode launch conditions as specified in
Fig. 6–9 (in dB).
SFC AFC PC MC
excess loss a
e
2,3 2,5 3,2 3,8
coupling ratio a
cr
2,0 7,8 0,7 1,4
On the other hand ’butt-end’ or end face couplers
are usually considered to be less mode selective which
is not true in general as can be seen from both Fig. 8
and Fig. 9.
Here the polished coupler shows strong support of
the fundamental mode but it mixes several high order
mode groups. Since it is all but impossible to pol-
ish the two fiber branches symmetrically and the op-
tical modes respond very sensitive to these geomet-
rical distortions the polished couplers show more or
less mode selective behavior, too. Compared to fu-
sion couplers they have the disadvantage of generally
Figure 8: Measured mean power distribution pattern when
using the polished coupler (PC) at the transmitter side (left:
center light launch condition; right: high order mode path,
δ = 0µm); the dotted line represents the 50µm core size.
Figure 9: Measured mean power distribution pattern when
using the mirror coupler (MC) at the transmitter side (left:
center light launch condition; right: off-center light launch
condition, δ = 10µm); the dotted line represents the 50µm
core size.
higher excess losses (see Tab. 1). The same holds true
for couplers using micro optical parts, e. g. the mirror
coupler. However, they may offer better mode control
due to the easy access to the expanded optical fields.
Fig. 9 shows qualitatively that the high order mode
group is better maintained in comparison to the pol-
ished coupler in Fig. 8. In summery the three main pa-
rameters of couplers depend on fabrication techniques
as indicated in Fig. 10.
Now, all impulse responses have been measured as
described in (Pankow et al., 2011) and (Ahrens et al.,
maintaining
selective
mode groups:
excess loss:
coupling ratio:
strong
weak
low
high
symmetry can be controlled by more or less all fabrication techniques
but may be linked to mode selectivity
asymmetric
fusion coupler
symmetric
fusion coupler
polished
coupler
mirror
coupler
<< <
in-fiber devices: micro optic devices:
asymmetric
fusion coupler
mirror
coupler
polished
coupler
symmetric
fusion coupler
<
Figure 10: Relationship between fabrication techniques and
coupler parameters.
OPTICS2013-InternationalConferenceonOpticalCommunicationSystems
400
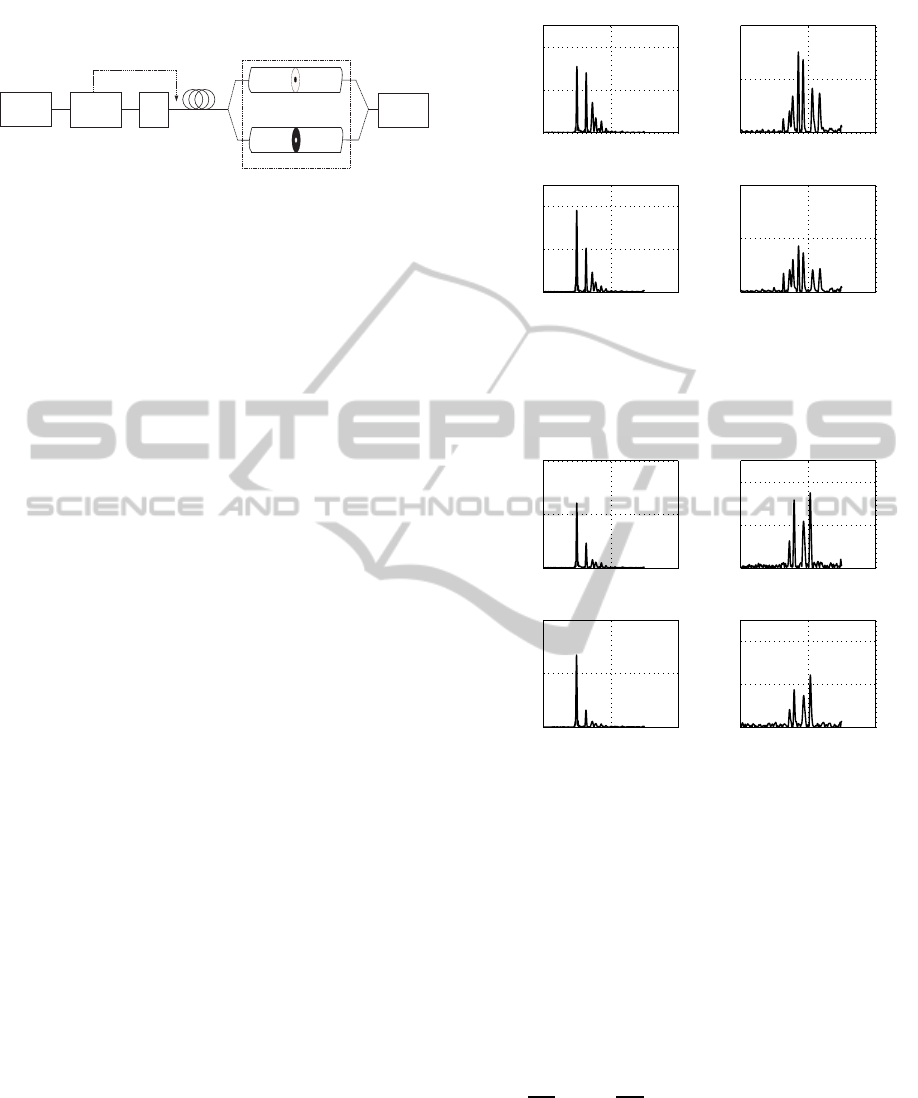
2013) (see Fig. 11).
Pulse
Generator
Attenuator
fixed transmit
Power
Coupler
GI 50/125
GI
50/125
GI
50/125
GI
50/125
GI
50/125
ring
center
Spatial Filter Characteristic
Oscilloscope
&
Analysis
Figure 11: Measurement setup for measuring the MIMO
specific impulse responses.
In order to exclude the impact of the different ex-
cess losses of the couplers (see Tab. 1) which can be
related to fabrication deficiencies the overall powers
at output 1 (Fig. 5) were equalized.
Though the power is equalized it spreads across
the different mode groups supported by the respec-
tive couplers. Therefore different couplers will pro-
duce differing MIMO channels. Comparing g
22
(t)
in Fig. 12 to 15 the power spreading across the high
order modes is emphasized. This is expected since
the number of excited mode groups increases with
the radial launching offset δ. However the different
couplers may further increase this number by mode
coupling. The lowest spreading shows the asymmet-
ric fusion coupler with four mode groups whereas the
polished coupler produces eight mode groups. Like-
wise the fundamental mode is mainly supported by
both the asymmetric fusion and the polished couplers
whereas the other couplers also excite the next higher
mode. The disadvantage of the unequal coupling ratio
of an asymmetric fusion coupler compared to a sym-
metric one is not as evident as expected which can be
seen from g
22
(t) in Fig. 12 and 13. This is caused by
the restricted mode launching conditions and how the
coupler maintains certain modes.
4 PERFORMANCE CRITERIA
For the performance evaluation of the different
MIMO configurations, coherent transmission and de-
tection is assumed together with the modulation for-
mat QAM (quadrature amplitude modulation) per
MIMO transmission mode. The block-oriented sys-
tem for frequency selective channels is modeled by:
u = H· c+ w . (2)
In (2), the transmitted signal vector c is mapped
by the channel matrix H onto the received vector
u. Finally, the vector of the additive, white Gaus-
sian noise (AWGN) is defined by w (Pankow et al.,
2011; Raleigh and Cioffi, 1998). Details on the
transmission model, which has been determined by
0 2 4
0
0.2
0.4
0 2 4
0
0.05
0.1
0 2 4
0
0.2
0.4
0 2 4
0
0.05
0.1
t (in ns) →t (in ns) →
t (in ns) →t (in ns) →
T
s
g
1 1
(t) →
T
s
g
1 2
(t) →
T
s
g
2 1
(t) →
T
s
g
2 2
(t) →
Figure 12: Measured electrical MIMO impulse responses
with respect to the pulse frequency f
T
= 1/T
s
= 5,00 GHz
at 1326 nm operating wavelength when using the symmetric
fusion coupler at the transmitter side.
0 2 4
0
0.5
1
0 2 4
0
0.02
0.04
0 2 4
0
0.5
1
0 2 4
0
0.02
0.04
t (in ns) →t (in ns) →
t (in ns) →t (in ns) →
T
s
g
1 1
(t) →
T
s
g
1 2
(t) →
T
s
g
2 1
(t) →T
s
g
2 2
(t) →
Figure 13: Measured electrical MIMO impulse responses
with respect to the pulse frequency f
T
= 1/T
s
= 5,00 GHz
at 1326 nm operating wavelength when using the asymmet-
ric fusion coupler at the transmitter side.
channel measurements, are given in (Pankow et al.,
2011). Singular-value decomposition (SVD) can now
be used to transfer the whole MIMO system into in-
dependent, non-interfering layers exhibiting unequal
gains per layer as highlighted in Fig. 16, where
as a result weighted additive, white Gaussian noise
(AWGN) channels appear. The data symbols at the
time k, i. e. c
1k
and c
2k
are weighted by the positive
square roots of the eigenvalues of the matrix H
H
H,
i. e.
p
ξ
1k
and
p
ξ
2k
. Finally, some noise is added,
i. e. w
1k
and w
2k
.
OpticalCouplersinMultimodeMIMOTransmissionSystems-MeasurementResultsandPerformanceAnalysis
401
0 2 4
0
0.2
0.4
0 2 4
0
0.1
0.2
0 2 4
0
0.2
0.4
0 2 4
0
0.1
0.2
t (in ns) →t (inns) →
t (in ns) →t (inns) →
T
s
g
1 1
(t) →
T
s
g
1 2
(t) →
T
s
g
2 1
(t) →
T
s
g
2 2
(t) →
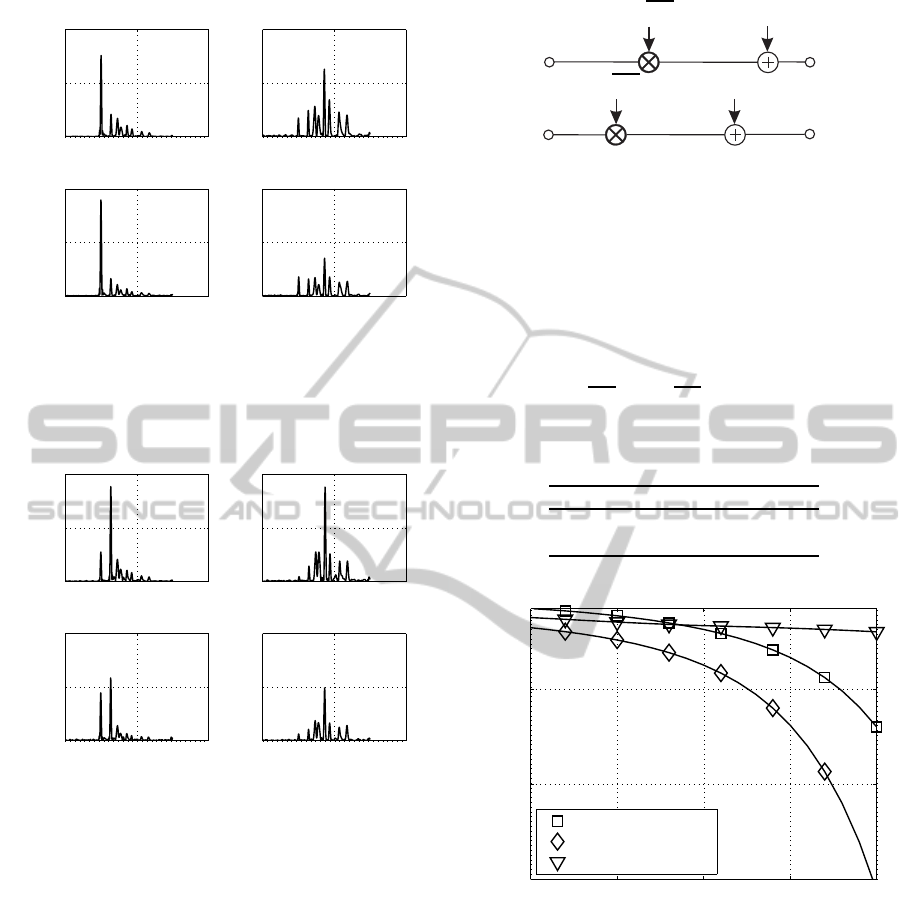
Figure 14: Measured electrical MIMO impulse responses
with respect to the pulse frequency f
T
= 1/T
s
= 5,00 GHz
at 1326 nm operating wavelength when using the polished
coupler at the transmitter side.
0 2 4
0
0.2
0.4
0 2 4
0
0.1
0.2
0 2 4
0
0.2
0.4
0 2 4
0
0.1
0.2
t (in ns) →t (inns) →
t (in ns) →t (inns) →
T
s
g
1 1
(t) →
T
s
g
1 2
(t) →
T
s
g
2 1
(t) →
T
s
g
2 2
(t) →
Figure 15: Measured electrical MIMO impulse responses
with respect to the pulse frequency f
T
= 1/T
s
= 5,00 GHz
at 1326 nm operating wavelength when using the mirror
coupler at the transmitter side.
5 RESULTS
For comparing the different MIMO configurations, a
fixed transmission bit rate is assumed. Furthermore,
for numerical analysis it is assumed, that each optical
input within the multimode fiber is fed by a system
with identical mean properties with respect to trans-
mit filter and pulse frequency f
T
= 1/T
s
. Rectangu-
lar pulses are used for transmit and receive filtering.
For numerical assessment within this paper, the pulse
frequency is chosen to be f
T
= 5,00 GHz, the aver-
age transmit power is supposed to be P
s
= 1V
2
– this
equals 1 W at a linear and constant resistance of 1Ω –
and as an external disturbance a white Gaussian noise
with power spectral density N
0
is assumed (Pankow
p
ξ
1 k
p
ξ
2 k
w
1 k
w
2 k
c
1 k
c
2 k
y
1 k
y
2 k
Figure 16: SVD-based layer-specific transmission model.
et al., 2011). Tab. 2 highlights the different transmis-
sion modes to be investigated when minimizing the
overall BER.
In order to transmit at a fixed data rate while main-
taining the best possible integrity, i.e. bit-error rate
(BER), an appropriate number of MIMO layers has
to be used, which depends on the specific QAM con-
stellation size as well as the layer-specific weighting
factors, i.e.
p
ξ
1k
and
p
ξ
2k
.
Table 2: Parameters for bitloading: Investigated QAM
transmission modes for fixed transmission bit rate.
throughput layer 1 layer 2
4 bit/s/Hz 16 0
4 bit/s/Hz 4 4
20 25 30 35 40
10
−6
10
−4
10
−2
10 · log
10
(P
s
T
s
/N
0
) (in dB) →
bit-error rate →
16-QAM, SISO
(16,0)-QAM, MIMO
(4,4)-QAM, MIMO
Figure 17: BER performance at 1326 nm operating wave-
length when using the asymmetric fusion coupler at the
transmitter side, the transmission modes introduced in
Tab. 2 and transmitting 4 bit/s/Hz over frequency selective
optical MIMO channels.
For a given MIMO configuration, i.e. the asym-
metric fusion coupler at the transmitter side and the
spatial filters at the receiver side, the corresponding
BER performance is depicted in Fig. 17. As shown
by the BER results, the achievable performance of
the MIMO system is strongly affected by the number
of bits transmitted per activated MIMO layer. Using
SVD, the singular values are ordered in descending
order. That’s why only the strongest layers should be
OPTICS2013-InternationalConferenceonOpticalCommunicationSystems
402
used for the data transmission with appropriate QAM
modulation levels.
20 25 30 35 40
10
−6
10
−4
10
−2
10 · log
10
(P
s
T
s
/N
0
) (in dB) →
bit-error rate →
SFC
AFC
PC
MC
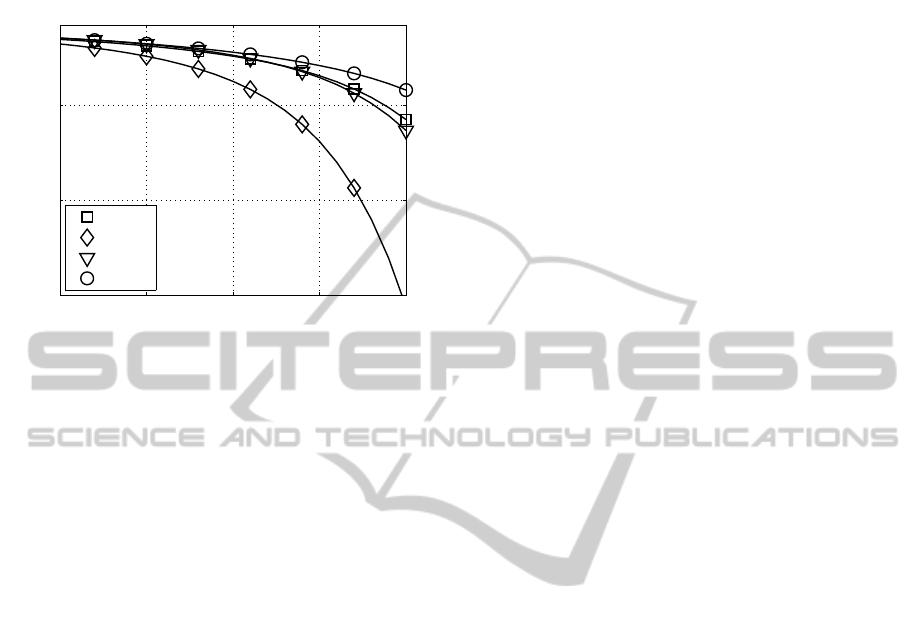
Figure 18: Coupler specific BER performance at 1326 nm
operating wavelength when using the (16,0) QAM trans-
mission mode.
Fig. 18 shows the obtained BER performance
when using the different transmitter side coupler con-
figurations. As highlighted by the BER results, the
asymmetric fusion coupler (AFC) shows the best per-
formance among the investigated coupler configura-
tions. Therein, unequal coupling ratio of an asymmet-
ric fusion coupler seems to be highly beneficial when
minimizing the overall BER.
6 CONCLUSIONS
In this work the use of optical couplers in a (2 × 2)
MIMO testbed is studied and analyzed for a 1,4 km
multimode MIMO channel. As shown by the obtained
measured impulse responses as well as the simulated
BER results, optical couplers are well suited for the
optical MIMO transmission. As shown by the simu-
lation results, couplersmaintaining the different mode
groups without additional mixing seem to be benefi-
cial when minimizing the overall BER.
REFERENCES
Ahrens, A., Pankow, J., Aust, S., and Lochmann, S. (2011).
Optical MIMO Multimode Fiber Links: Channel
Measurements and System Performance Analysis. In
International Conference on Optical Communication
Systems (OPTICS), Seville (Spain).
Ahrens, A., Schr¨oder, S., and Lochmann, S. (2013). Disper-
sion Analysis within a Measured 1,4 km MIMO Mul-
timode Channel. In International Conference on Op-
tical Communication Systems (OPTICS), Reykjavik
(Iceland).
Aust, S., Ahrens, A., and Lochmann, S. (2012). Channel-
Encoded and SVD-assisted MIMO Multimode Trans-
mission Schemes with Iterative Detection. In Interna-
tional Conference on Optical Communication Systems
(OPTICS), pages 353–360, Rom (Italy).
B¨ulow, H., Al-Hashimi, H., and Schmauss, B. (2011).
Coherent Multimode-Fiber MIMO Transmission with
Spatial Constellation Modulation. In European Con-
ference and Exhibition on Optical Communication
(ECOC), Geneva, Switzerland.
Foschini, G. J. (1996). Layered Space-Time Architecture
for Wireless Communication in a Fading Environment
when using Multiple Antennas. Bell Labs Technical
Journal, 1(2):41–59.
Hsu, R. C. J., Tarighat, A., Shah, A., Sayed, A. H., and
Jalali, B. (2006). Capacity Enhancement in Coherent
Optical MIMO (COMIMO) Multimode Fiber Links.
IEEE Communications Letters, 10(3):195–197.
K¨uhn, V. (2006). Wireless Communications over MIMO
Channels – Applications to CDMA and Multiple An-
tenna Systems. Wiley, Chichester.
Lochmann, S. and Becker, M. (1983). Cover Photo of the
Journal. Nachrichtentechnik, Elektronik, 33(11).
Lochmann, S., Scheel, W., Labs, J., and Wallstein,
T. (1983). Passive Optical Splitters (in German).
Nachrichtentechnik, Elektronik, 33(11):444–448.
Pankow, J., Aust, S., Lochmann, S., and Ahrens, A. (2011).
Modulation-Mode Assignment in SVD-assisted Op-
tical MIMO Multimode Fiber Links. In 15th Inter-
national Conference on Optical Network Design and
Modeling (ONDM), Bologna (Italy).
Raleigh, G. G. and Cioffi, J. M. (1998). Spatio-Temporal
Coding for Wireless Communication. IEEE Transac-
tions on Communications, 46(3):357–366.
Sch¨ollmann, S. and Rosenkranz, W. (2007). Experimen-
tal Equalization of Crosstalk in a 2 x 2 MIMO Sys-
tem Based on Mode Group Diversity Multiplexing
in MMF Systems @ 10.7 Gb/s. In 33rd European
Conference and Exhibition on Optical Communica-
tion (ECOC), Berlin.
Sch¨ollmann, S., Schrammar, N., and Rosenkranz, W.
(2008). Experimental Realisation of 3 x 3 MIMO Sys-
tem with Mode Group Diversity Multiplexing Limited
by Modal Noise. In Optical Fiber Communication
Conference (OFC), San Diego, California.
Singer, A. C., Shanbhag, N. R., and Bae, H.-M. (2008).
Electronic Dispersion Compensation– An Overwiew
of Optical Communications Systems. IEEE Signal
Processing Magazine, 25(6):110 – 130.
OpticalCouplersinMultimodeMIMOTransmissionSystems-MeasurementResultsandPerformanceAnalysis
403
