
Multi-Point Measurement System and Data Processing
for Earthquakes Monitoring
Valery Korepanov and Fedir Dudkin
Lviv Center of Institute for Space Research, 5-A Naukova str,. 79060 Lviv, Ukraine
Keywords: Earthquake, Magnetic Precursors, Data Processing.
Abstract: Lithospheric ultra low frequency (ULF) magnetic activity is recently considered as very promising
candidate for application to short-time earthquake (EQ) forecasting. However the intensity of the ULF
lithospheric magnetic field is very weak and often masked by much stronger ionospheric and
magnetospheric signals. The study of pre-EQ magnetic activity before the occurrence of strong EQ is a very
hard problem which consists of the identification and localization of weak signal sources in EQ-hazardous
areas of the Earth’s crust. A new approach is developed to find a source of pre-EQ ULF electromagnetic
activity of lithospheric origin. For separation and localization of such sources a new polarization ellipse
technique has been used to process data acquired from 3-component magnetometers. The polarization
ellipse is formed by the magnetic field components at the measurement station. Calculations based on
polarization ellipse parameters from two distant points allow discrimination of seismo-EM signals from
natural background ULF signals. The results of experimental verification of this method in Kanto region
(Japan), known as one of the most seismoactive, are given which partially confirm its efficiency and give
hope, with its further improvement, to the progress in the EQ precursors reliable detection in other regions
of the Globe, particularly, in Iceland known by the active seismic activity.
1 INTRODUCTION
Short-term earthquake (EQ) prediction, despite
intensive efforts in last half a century, still remains
unattainable though numbers of promising leads and
directions are indicated (see Uyeda et al., 2009);
(Dudkin et al., 2010) for recent review on the
subject). The anomalous electromagnetic (EM)
emission in ultra low frequency (ULF) band (0.001-
10 Hz), believed to be emanating from within the
focal zones, have emerged as potential precursor
candidates for short-term EQ prediction (Hattori and
Hayakawa, 2007); (Hayakawa et al., 1996; 2000;
2007); (Molchanov and Hayakawa, 1995);
(Molchanov et al., 1992; 2004). This observational
conviction is further reinforced from the suggestions
that mechanical deformations or microfracturing in
the impending focal zones may give rise to pre-
and/or co-seismic EM emission in ULF band due to
one or more of the following factors: (1) movement
of conductive medium in the Earth’s permanent
magnetic field (inductive effect) (Fedorov et al.,
2001); (Surkov et al., 2003); (2) displacements of
boundaries between high and low conductive crustal
blocks (Dudkin et al., 2003); (3) electrokinetic effect
(Mizutani et al., 1976); (Fitterman, 1979); (4)
piezoelectric or piezomagnetic effects (Martin et al,
1978); (Ogawa et al., 1985); (Johnston et al., 1994);
(Ogawa and Utada, 2000) and (5) microfracture
electrification (Molchanov and Hayakawa, 1995).
(All references are given as example). The ULF EM
field attenuate rather weakly in crustal material and
hence, according to theoretical consideration,
associated magnetic field can be detected at large
distances up to 100-150 km (Hayakawa et al., 2007).
The practical detection and application of
precursory EM signals for real time EQ prediction
continue to be challenging due to several problems:
(i) intensity of anticipated seismo-EM signals in
ULF band is very low (with a few exceptions, e.g.,
(Fraser-Smith et al., 1990); (Bleier et al., 2009),
where magnetometers happened to be in the close
proximity to epicenter, critics see in (Campbell,
2009); (Thomas et al., 2009), (ii) difficulty of
discrimination of weak seismo-EM signals from the
background natural EM fields of ionospheric and
magnetospheric origin and (iii) finally the precision
limitation of the localization of precursor source or,
at least, determination of azimuth direction to the
source zone. Very often these problems are
119
Korepanov V. and Dudkin F..
Multi-Point Measurement System and Data Processing for Earthquakes Monitoring.
DOI: 10.5220/0004506201190124
In Proceedings of the 10th International Conference on Signal Processing and Multimedia Applications and 10th International Conference on Wireless
Information Networks and Systems (SIGMAP-2013), pages 119-124
ISBN: 978-989-8565-74-7
Copyright
c
2013 SCITEPRESS (Science and Technology Publications, Lda.)

aggravated by short time (less than 5 minutes) of
precursor existence (Bleier et al., 2009). With the
availability of very sensitive induction type 3-
component magnetometers with high suppression of
man-made interference (Pronenko, 2010), the
recording of high quality magnetic data in ULF
bands has greatly improved (Hayakawa et al., 2007).
For the second problem, polarization analysis
incorporating the ratio S
Z
/S
H
(S
Z
and S
H
are the
spectral intensities of vertical and horizontal
magnetic field components)
is found effective, at
least partially, in distinguishing seismo-EM signals
from geomagnetic field fluctuations (Hayakawa et
al., 1996). The formulations of principal component
analysis and fractal approach have been used with
some success in discriminating the signals of extra-
terrestrial and seismotectonic origin in magnetic
field records (see, for example, Hayakawa et al.,
1999; 2007); (Serita et al., 2005); Ida and
Hayakawa, 2006). With the aim of the identification
of source location, the phase difference as well as
amplitude difference techniques between pair or
more observation points, so-called gradiometric
method, was advanced (Ismaguilov et al., 2003;
Surkov et al., 2004). However a space derivative of
magnetic field is very unstable at low signal-to-noise
(S/N) ratio and may give a big error in the
estimation of source direction (see remarks about
S/N ratio in [Dudkin et al., 2003]). Very promising
in the seismo-EM precursors direction finding
problem solution is an application of the polarization
ellipse (PE) technique, where the PE major axis
behavior is investigated (goniometric method) (Du
et al., 2002; Schekotov et al., 2007, 2008). This
technique allows determination of trends in azimuth
angle of anomalous ULF signal and possibly area of
EQ epicentre. Taking into account that ULF
magnetic source is always in the PE plane the new
method of magnetic precursor source location when
at least two observation points are available has been
proposed by present authors (Dudkin et al., 2010;
2011). In the present paper expanding the steps of
this new direction-finding approach, we use the
information on magnetic field data from two stations
operated simultaneously in Kanto seismoactive
region of Japan. The organization of observation site
at Iceland to check the method is further proposed.
2 EXPERIMENT, RESULTS AND
DISCUSSION
To test the PE method efficiency for locating source
region of EM fields produced during EQ preparation
process, the same methodology as described in
(Dudkin et al, 2010, 2011) was applied to the
magnetic data recorded in 2005 in Kanto region,
Japan (Figure 1). The Kanto region is heavily
populated and EQs can happen close to urban areas.
This region is one of the most seismoactive in Japan.
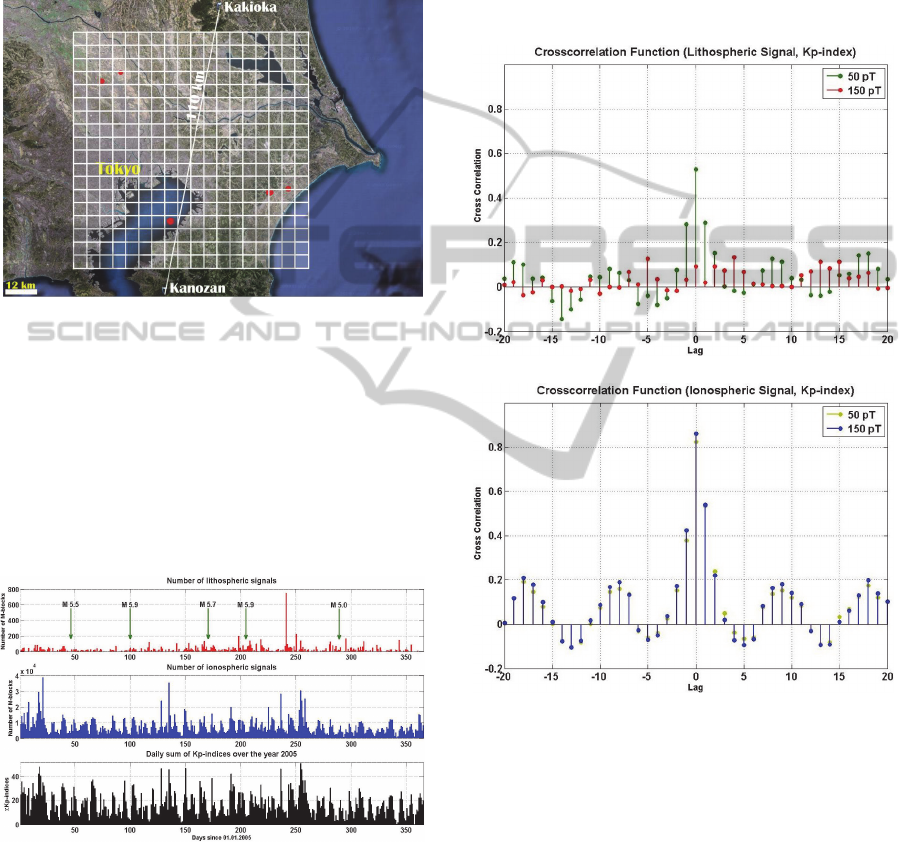
Figure 1: The map of Kanto region.
Seismic activity there occurs due to movement of
Pacific and Philippine Sea plates. The plate
boundaries underneath the Kanto region are just 10-
40 km below the surface of the Earth and have a
complex structure. EQs can occur there both due to
subducting plates and due to active faults in land.
One-year data in frequency range 0.0001-0.5 Hz
from two fluxgate magnetometers located in
Kakioka and Kanozan geomagnetic observatories
(Figure 2) were analyzed.
Figure 2: Map of Kakioka-Kanozan area.
The peculiarity of these data is very high man-
made electromagnetic interference which
complicates much the detection of seismogenic
signals.
The monitored area 90x90x90 km was decomposed
SIGMAP2013-InternationalConferenceonSignalProcessingandMultimediaApplications
120
into 5832 subblocks with dimensions 5x5x5 km,
total volume about 730,000km
3
(Figure 3). The data
about seismicity in monitored area during the year
2005 were obtained from USGS catalogue. Five EQs
with magnitude M
W
5.0 and above occurred there
during the year 2005 with depths range from 40 to
61 km.
Figure 3: Decomposition of the monitored area.
At the lithospheric magnetic activity detection
the same procedure of “blind search”, as for data
obtained in China (Dudkin et al, 2011) has been
used. The distribution of number of M-lines in time,
which are believed to indicate to the magnetic
anomalies source (Dudkin et al, 2010) in depth range
0-90 km over the year 2005 and of the signals
classified as ionospheric at the background of Kp-
index value, is shown in Figure 4.
Figure 4: Time distribution of M-lines (red) ionospheric
signals (blue) and Kp index (black) numbers in depth
range 0-90 km over the year 2005.
We may see that the number of the
ionospheric/magnetospheric signals (blue) is in good
correlation with diurnal value index of global
geomagnetic activity Kp (black). Cross-correlation
function of Kp-index value with lithospheric and
ionospheric signals at two thresholds (50 pT and 150
pT) is shown in Figure 5 a,b.
We can see very high correlation of
ionospheric/magnetospheric M-lines number with
Kp-index value almost independently of minimal
signal threshold, unlike the lithospheric M-lines. At
decreasing of signal threshold the method selectivity
also decays, which leads to increasing of correlation
between lithospheric M-lines number and Kp-index
value.
a)
b)
Figure 5: Cross-correlation function of Kp-index value
with lithospheric and ionospheric signals at thresholds 50
pT and 150 pT for minor axis of magnetic field
polarization ellipse.
The increased lithospheric activity was found
only for 3 EQs from 5 under study : 1) on 7 April, 3
days before EQ M
W
5.9; 2) on July, 17 and 21, 6 and
2 days respectively before EQ M
W
5.9; 3) on
August, 29, 48 days before EQ M
W
5.0. The depth
distribution of blocks with magnetic activity in depth
range 52.5-82.5 km on July, 17 and in depth range
17.5-47.5 km on August, 29 are shown in Figure 6
a,b.
Multi-PointMeasurementSystemandDataProcessingforEarthquakesMonitoring
121
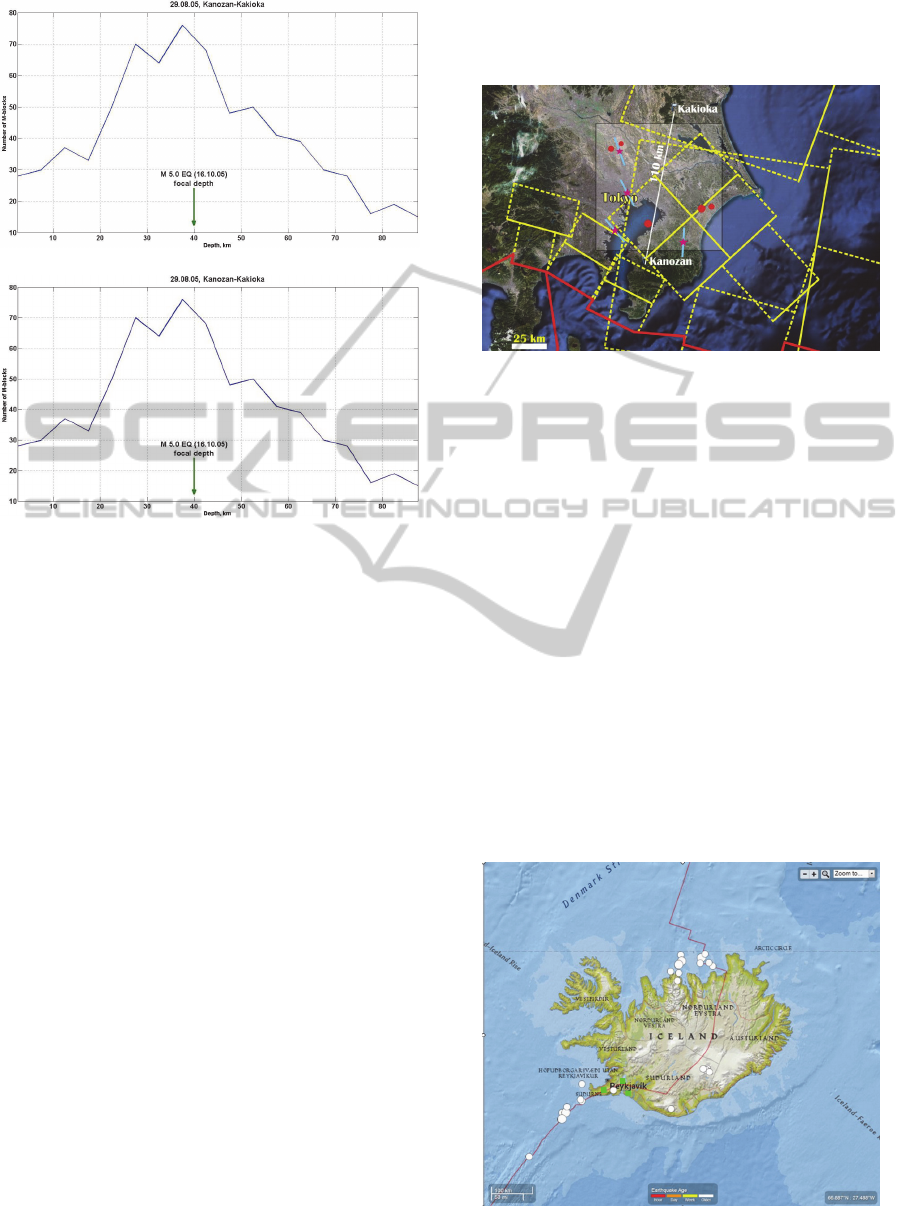
a)
b)
Figure 6: Depth distribution of pre-EQ lithospheric
magnetic activity a) on on July, 17 b) on August, 29. Red
circles denote EQ epicentres.
It is clearly seen that the maximal number of M-
lines crosses the slab at the same depth where the
EQ occurred, what confirms the validity of the
method. For other two cases we did not get clear
correspondence with M-lines occurrence. Several
causes of these rather poor results may be
mentioned.
1. The region is densely populated and the local
interference level was very high.
2. The observation network was very sparse and
distance between magnetometers was too big.
3. The local tectonic structure is extremely
complicated. The crustal block boundaries and
rectangular fault model for Kanto region is
shown in Fig. 7.
Red lines indicate boundaries of the crustal blocks
on the surface. Dashed rectangles indicate
rectangular faults with a solid yellow line indicating
a fault upper edge. (The block boundaries are drawn
with use of article: Nishimura et al., 2007). Red
circles denote the studied EQs. Red stars indicate the
centres of maximal pre-EQ lithospheric activity.
As it is seen at this figure, the light blue lines
show the statistically averaged azimuths for
lithospheric M-lines, which in general coincide with
direction of local seismogenic fault as for precedent
cases. This may be the partial confirmation that the
method works here also, but the observation
technology has to be improved.
Figure 7: Crustal block boundaries and rectangular fault
model. Red lines indicate boundaries of the crustal blocks
on surface. Dashed rectangles indicate rectangular faults
with a solid yellow line indicating a fault upper edge. Red
circles denote the studied EQs. Red stars indicate the
centres of maximal pre-EQ lithospheric activity. Light
blue lines show the statistically averaged azimuths for
lithospheric M-lines.
Very interesting region for EQ magnetic
precursor study is Iceland. It is the part of the Mid-
Atlantic Ridge which marks the division between the
Eurasian and North American tectonic plates, Figure
8.
There the seismic activity near Iceland during
years 2010-2013 is shown, where minor white
circles denote the epicenters of EQ with M4.0 - 4.9
and major ones – M5.0 - 5.5. The boundary between
the tectonic plates is marked by red line. The
example of magnetometer sites location for study of
pre-EQ lithospheric magnetic activity near
Reykjavik, Iceland is marked by green
squares.
Figure 8: The seismic activity near Iceland during years
2010-2013.
SIGMAP2013-InternationalConferenceonSignalProcessingandMultimediaApplications
122

3 CONCLUSIONS
New direction-finding method for study of ULF
lithospheric magnetic activity with use of two
spaced 3-component magnetometers was tested in
seismoactive area of Kanto region (Japan). For
analysis of pre-EQ lithospheric ULF magnetic
activity there, the area 90x90x90 km was chosen
between two measuring sites Kanozan and Kakioka.
The data from their magnetometers were analysed
during the year 2005 with special attention on
magnetic precursor for five main EQs with M ≥ 5.0.
Because of Kanto region specific peculiarities
(zone of the subducting plates with deep EQ
hypocentres, high level of industrial interference and
very sparse observation network with big distance
between magnetometers) the ULF magnetic
precursors were found only for three EQ.
The pre-EQ magnetic activity was found 48-2
days before EQ in frequency range 0.0007-0.01 Hz
at depths close to focal depths of main strikes. The
M-lines orientation was well coinciding also with
the local fault direction. It is shown that controlled
by the orientation of seismogenic faults, resulting
seismo-EM field would have definite orientation in
comparison to the isotropic direction distribution of
highly variable natural signals arising from complex
ionospheric-magnetospheric interactions. Based on
these physical considerations, the interactions lines
defined by the planes of PE, formed by the magnetic
fields at minimum two sites, define the azimuth of
seismo-EM source.
It may be concluded that in order to raise the
reliability of determination of slow crustal
nucleation processes preceding EQ (which form pre-
EQ ULF lithospheric magnetic activity, i.e. magnetic
precursors), it is necessary to cover the monitored
area with magnetometer density not less than one
magnetometer per 2000 sq. km (the distance
between measuring sites less than 50 km). Already
available knowledge on the role of high pressure
fluids in generating the EQs favours electrokinetic
effect to be one of the possible source mechanisms
for seismo-EM fields there. Testing the proposed
formulation in the other active seismic belts and
preferably employing multiple stations would help
generalization of the methodology for future EQ
precursory studies.
This study is partly supported by SSAU contract
No 4-04/13.
REFERENCES
Bleier, T., Dunson, C., Maniscalco, M., Bryant, N.,
Bambery, R., Freund, F., 2009. Investigation of ULF
magnetic pulsations, air conductivity changes, and
infra red signatures associated with the 30 October
Alum Rock M5.4 earthquake, In Nat. Hazards Earth
Syst. Sci., 9, 585–603.
Campbell, W. H., 2009. Natural magnetic disturbances
fields, not precursors, preceding the Loma Prieta
earthquake. In J. Geophys. Res., 114, A05307,
doi:10.1029/2008JA013932.
Du, A., Huang, Q., Yang, S., 2002. Epicenter location by
abnormal ULF electromagnetic emissions. In
Geophys. Res. Lett., 29 (10), 1455-1458.
Dudkin, F., De Santis, A., Korepanov, V., 2003. Active
EM sounding for early warning of earthquakes and
volcanic eruptions, In Phys. Earth Planet. Inter., 139
(3, 4), 187-195.
Dudkin, F., Rawat, G., Arora, B. R., Korepanov, V.,
Leontyeva, O., and Sharma, A. K. 2010. Application
of polarization ellipse technique for analysis of ULF
magnetic fields from two distant stations in Koyna-
Warna seismoactive region, West India, In Nat.
Hazards Earth Syst. Sci., 10, 1513–1522.
Dudkin, F., Korepanov, V., Yang, D., Li, Q. and
Leontyeva, O., Analysis of the local lithospheric
magnetic activity before and after Panzhihua Mw=6.0
earthquake (30 August 2008, China), 2011. In Nat.
Hazards Earth Syst. Sci, 11, 1-10, doi: 10.5194/nhess-
11-1-2011.
Fedorov, E., Pilipenko, V., Uyeda, S., 200l. Electric and
Magnetic Fields Generated by Electrokinetic
Processes in a Conductive Crust. In Phys. Chem. Earth
(C), 26 (10-12), 793-799.
Fitterman, D. V., 1979. Theory of electrokinetic magnetic
anomalies in a faulted half-space, In J. Geophys. Res.,
84 (B11), 6031-6040.
Fraser-Smith, A. C., Bernardi, A., McGill, P. R., Ladd, M.
E., Helliwell, R. A., Villard Jr., O. G., 1990. Low-
frequency magnetic field measurements near the
epicenter of the Ms 7.1 Loma Prieta earthquake. In
Geophys. Res. Lett., 17, 1465-1468.
Hattori, K. and Hayakawa, M., 2007. Recent progress and
state of the art of seismo-electromagnetics, In IEEJ
Transactions on Fundamentals and Materials, 127(1),
4–6.
Hayakawa, M., Kawate, R., Molchanov, O. A., Yumoto,
K., 1996. Results of ultra-low-frequency magnetic
field measurements during the Guam earthquake of 8
August 1993. In Geophys. Res. Lett., 23, 241–244.
Hayakawa, M., Itoh, T., Smirnova, N., 1999. Fractal
analysis of ULF geomagnetic data associated with the
Guam earthquake on 8 August 1993. In Geophys. Res.
Lett., 26, 2797–2800.
Hayakawa, M., Itoh, T., Hattori, K., Yumoto, K., 2000.
ULF electromagnetic precursors for an earthquake in
Biak, Indonesia on 17 February 1966. In Geophys.
Res. Lett., 27, 1531–1534.
Multi-PointMeasurementSystemandDataProcessingforEarthquakesMonitoring
123

Hayakawa, M., Hattori, K., Ohta, K., 2007. Monitoring of
ULF (ultra-low-frequency) Geomagnetic Variations
Associated with Earthquakes. In Sensors, 7, 1108-
1122.
Ida, Y., Hayakawa, M., 2006. Fractal analysis for the ULF
data during the 1993 Guam earthquake to study
prefracture criticality. In Nonlin. Processes Geophys.,
13, 409–412.
Ismaguilov, V. S., Kopytenko, Yu. A., Hattori, K.,
Hayakawa, M., 2003. Variations of phase velocity and
gradient values of ULF geomagnetic disturbances
connected with the Izu strong earthquakes. In Nat.
Hazards Earth Syst. Sci., 3, 211–215.
Johnston, M. J. S., Muller, J. S. and Sasai, Y., 1994.
Magnetic field observations in the near field: the 28
June, 1992 Mw 7.3 Landers, California Earthquake. In
Bull Seism. Soc. Am., 84, 792-798.
Martin, R. J., Habermann, R. E., Wyss, M., 1978. The
effect of stress cycling and inelastic volumetric strain
on remanent magnetization. In J. Geophys. Res., 83,
3485-3496.
Mizutani, H., Ishido, T., Yokokura, T., Ohnishi, S., 1976.
Electrokinetic phenomena associated with
earthquakes. In Geophys. Res. Lett., 13, 365-368.
Molchanov, O. A., Kopytenko, Yu. A., Voronov, P. M.,
Kopytenko, E .A., Matiashvili, T.G., Fraser-Smith,
A.C., Bernardy, A., 1992. Results of ULF magnetic
field measurements near the epicenters of the Spitak
(Ms = 6.9) and Loma Prieta (Ms = 7.1) earthquakes:
comparative analysis. In Geophys. Res. Lett., 19,
1495-1498.
Molchanov, O. A., Hayakawa, M., 1995. Generation of
ULF electromagnetic emissions by microfracturing. In
Geohpys. Res. Lett., 22, 3091–3094.
Molchanov, O. A., Schekotov, A. Yu., Fedorov, E.,
Belyaev, G. G., Solovieva, M. S., Hayakawa, M.,
2004. Preseismic ULF effect and possible
interpretation. In Annals of Geophysics, 47 (1), 119-
131.
Nishimura, T., Sagiya, T., Stein, R., 2007. Crustal block
kinematics and seismic potential of the northernmost
Philippine Sea plate and Izu microplate, central Japan,
inferred from GPS and leveling data. In J. Geophys.
Res., 112, doi:10.1029/2005JB004102.
Ogawa, T., Oike, K., Miura, T., 1985. Electromagnetic
Radiations from Rocks. In J. Geophys. Res., 90 (D4),
6245-6249.
Ogawa, T., Utada, H., 2000. Coseismic piezoelectric
effects due to a dislocation. 1. An analytic far and
early-time field solution in a homogeneous whole
space. In Phys. Earth Planet. Inter., 121, 273–288.
Pronenko, V. A., 2010. Interference-proof induction
magnetometer for ULF band. In Proceedings of VII
International conference “Metrology-2010”, Kharkiv,
Ukraine, 237-240, (in Russian).
Schekotov, A. Y., Molchanov, O. A., Hayakawa, M.,
Fedorov, E. N., Chebrov, V. N., Sinitsin, V. I.,
Gordeev, E. E., Belyaev, G. G., Yagova, N. V., 2007.
ULF/ELF magnetic field variations from atmosphere
induced by seismicity. In Radio Sci., 42, RS6S90,
doi:10.1029/2005RS003441.
Schekotov, A. Y., Molchanov, O. A., Hayakawa, M.,
Fedorov, E. N., Chebrov, V. N., Sinitsin, V. I.,
Gordeev, E. E., Andreevsky, S. E., Belyaev, G. G.,
Yagova, N. V., Gladishev, V. A., Baransky, L. N.,
2008. About possibility to locate an EQ epicenter
using parameters of ELF/ULF preseismic emission. In
Nat. Hazards Earth Syst. Sci., 8, 1237–1242.
Serita, A., Hattori, K., Yoshino, C., Hayakawa, M.,
Isezaki, N., 2005. Principal component analysis and
singular spectrum analysis of ULF geomagnetic data
associated with earthquakes. In Nat. Hazards Earth
Syst. Sci., 5, 685–689.
Surkov, V. V., Molchanov, O. A., Hayakawa, M., 2003.
Pre-earthquake ULF electromagnetic perturbations as
a result of inductive seismomagnetic phenomena
during microfracturing. In J. Atmos. Sol. Terr. Phys.,
65 (1), 31-46.
Surkov, V. V., Molchanov, O. A., Hayakawa, M., 2004. A
direction finding technique for the ULF
electromagnetic source. In Nat. Hazards Earth Syst.
Sci., 4, 513–517.
Thomas, J. N., Love, J. J., Johnston, M. J. S., and
Kiyohumi, Y., 2009. On the reported magnetic
precursor of the 1993 Guam earthquake. In Geophys.
Res. Lett., 36, L16301, doi:10.1029/2009GL039020.
Uyeda, S., Nagao, T., Kamogava, M., 2009. Short-term
earthquake prediction: Current status of seismo-
electromagnetics. In Tectonophysics, 470, 205-213.
SIGMAP2013-InternationalConferenceonSignalProcessingandMultimediaApplications
124
