
Development of Device Identity using WiFi Layer 2 Management
Frames for Combating Rogue APs
Jonny Milliken
*1
, Valerio Selis
2
, Kian Meng Yap
3
and Alan Marshall
1,2,3
1
Institute of Electronics, Communications and Information Technology (ECIT), Queens University Belfast, Belfast, U.K.
2
Traffic Observation via Management (TOM LTD), Northern Ireland Science Park, Belfast, U.K.
3
Department of Computer Science and Networked Systems, Sunway University, Kuala Lumpur, Malaysia
Keywords: WiFi, WLAN, Rogue AP, MAC, Probe, Frames, Identity.
Abstract: The susceptibility of WiFi networks to Rogue Access Point attacks derives from the lack of identity for
802.11 devices. The most common means of detecting these attacks in current research is through tracking
the credentials or the location of unauthorised and possibly malicious APs. In this paper, the authors outline
a method of distinguishing WiFi Access Points using 802.11 MAC layer management frame traffic profiles.
This system does not require location estimation or credential tracking techniques as used in current
research techniques, which are known to be inaccurate. These characteristic management traffic profiles are
shown to be unique for each device, tantamount to a MAC identity. The application of this technique to
solving Rogue AP attacks under the constraints of an open access, public WiFi environment is discussed
with the conclusion that the identity is practically very difficult to forge.
1 INTRODUCTION
One of the most insidious attacks perpetrated against
WLAN networks is the Rogue Access Point (Rogue
AP), whereby an attacker masquerades as a
legitimate AP in order to compromise the security of
unsuspecting clients. These types of attack are
considered to be some of the most dangerous threats
to WiFi (Shetty et al., 2007). (Ma et al., 2007)
categorises Rogues AP into one of four classes;
Improperly configured AP,
Unauthorised AP,
Phishing AP,
Compromised AP.
Detection of unauthorised APs is the most common
class addressed by research into Rogue APs (Beyah
et al., 2004). The existence of poorly configured APs
in practice is outlined in (Percoco, 2010), where
“poor security settings” is one of the top two threat
vectors in practical cyber security instances.
Investigations into detecting phishing and
compromised APs are lacking in current research,
although they are considered a technically difficult
but growing threat (Percoco, 2010).
One of the most common measures of identity in
WLAN systems in current research is the RSSI
(Received Signal Strength Indicator) of packets. The
authors in (Tao et al., 2008) and (Faria and Cheriton,
2006) suggest that, using a distributed set of sensors,
sufficient RSSI data can be gathered to provide
identification. This relies on different physical
locations creating slight variations in traffic patterns;
however this is only applied to clients and not APs.
There is disagreement on the usefulness of RSSI
in practical experiments. The authors in (Faria and
Cheriton, 2006) and (Ma et al., 2008) conclude that
use of RSSI as a WLAN location indicator is flawed
as multipath effects and AP specific processing of
RSSI frame values severely impact results and make
them unreliable. Furthermore, in (Nagarajan et al.,
2010), it is suggested that attackers, knowing RSSI
is used as a detection metric, can alter their
transmission power in frequent intervals in order to
defeat the detection algorithm. Thus the usefulness
of RSSI as a metric for absolute identification in
Rogue APs is uncertain and a more robust
identification method is required.
In (Shrivaraj et al., 2008) packet inter-arrival
time is used to detect Rogue APs using a Hidden
Markov Model, however the results are based on
Layer 3 information, not Layer 2. A similar system
is proposed in (Franklin et al., 2006) where inter-
frame spacing between probe requests in a WLAN is
488
Milliken J., Selis V., Meng Yap K. and Marshall A..
Development of Device Identity using WiFi Layer 2 Management Frames for Combating Rogue APs.
DOI: 10.5220/0004506404880493
In Proceedings of the 10th International Conference on Security and Cryptography (SECRYPT-2013), pages 488-493
ISBN: 978-989-8565-73-0
Copyright
c
2013 SCITEPRESS (Science and Technology Publications, Lda.)

suggested as an indicator of the device driver in use,
although it has only been applied to clients rather
than APs. The distinction between clients and APs
here is important, as the traffic handled by a client is
addressed to them alone, while inter-arrival times for
APs may be affected by having to process frames for
other network users. The use of layer 2 frame inter-
arrival times to identify DoS attacks in WiFi
networks has already been shown by the authors
(Milliken and Marshall, 2012). A more reliable
technique for detecting Rogue APs is alluded to in
(Beyah and Venkataraman, 2011) as “Irrefutable
device identification through traffic characteristics”.
2 AP IDENTITY AT LAYER 2
Identity in the context of this work is defined as the
ability to distinguish between two devices based on
intrinsic attributes which are not reliant on their
reported identity, i.e. the MAC address. Thus whilst
it is possible for a malicious attacker to copy the
MAC address, it should be impossible for them to
copy these intrinsic device attributes.
The use of Layer 2 management frame traffic
from WiFi networks has many positive attributes for
research applications. Firstly, this traffic is broadcast
in plaintext in all networks. As this Layer 2 traffic is
devoid of any encryption, this means it can be
collected without any privacy or confidentiality
concerns, which is often a major barrier to
performing live WiFi network investigations.
Previous work by (Milliken et al., 2012) outlined
a Layer 2 data collection system which has been
deployed in live environments for traffic analysis
and security research. Using this traffic it is possible
to investigate identity at WiFi Layer 2. This dataset
was collected from a public, open-access WiFi
rollout in the Sunway Pyramid shopping mall in
Kuala Lumpur (Figure 1).
Table 1 presents a breakdown of management
frame metrics for 3 APs within range of MS#1 in
Figure 1. The two most common management frame
types are considered to be; Beacons and Probe
Request / Response exchanges. An exchange is is
complete if the request and reply conversation is
complete, i.e. both the request and response have
been received correctly (Milliken et al., 2012).
Exchange intervals (for probes) and packet inter-
arrival times (for beacons) can be calculated by a
client based on the traffic from an AP and is
dependent on two unique factors; AP processing
time and client-AP channel.
AP processing time concerns the time for an AP
to process and transmit a packet and depends on the
equipment, firmware and load at that point in time.
The combination of these factors means that
processing time is subtly different for every AP and
can be used as a basis for prescribing an AP identity.
Figure 1: Data Capture System Layout (Milliken and
Marshall, 2012).
The client–AP channel factor concerns the subtle
differences in packet reception depending on
proximity between a client and AP. The authors
have previously demonstrated in (Milliken and
Marshall, 2012) and (Milliken et al., 2012) that data
collected from different locations is statistically
different even if these locations are in very close
proximity, as in Figure 1. This alters how the traffic
is received at each observation location, which can
be used as a further basis for identity.
Table 1: Per AP Information for MS#1 (K1 dataset).
Management Frame
Metrics
AP#1 AP#2 AP#3
# Packets 5.7M 4.7M 17.0M
% Data Packets 15.8 56.4 38.3
% Management Packets 79.5 40.4 60.4
% Control Packets 4.73 3.23 1.33
# Beacons 3.9M 1.7M 7.8M
# Full Probe Exchanges 65.5k 40.3k 194k
Av. Beacon Interval(s) 0.231 0.967 0.222
Av. Probe Exchange
Interval(s)
0.0467 0.0373 0.0194
Information from Table 1 shows that, as
predicted, many of the traffic attributes are distinct
for each AP (AP#1 vs. AP#2 vs. AP#3) collected at
a specific observation location (MS #1). The
“running” average (Av.) values in Table 1 represent
the exponentially weighted moving average, where
each new interval is weighted against the previous
intervals without any being discarded. This makes
the average more resistant to minor outliers. To
combat major outliers, a removal threshold (>60s)
has been applied to improve the stability of the
mean. Exchanges of this length are deemed to be
erroneous factors attributed to excessive impulse
interference or temporary reflective agents. Figures
2 and 3 show the values of these running means for
DevelopmentofDeviceIdentityusingWiFiLayer2ManagementFramesforCombatingRogueAPs
489
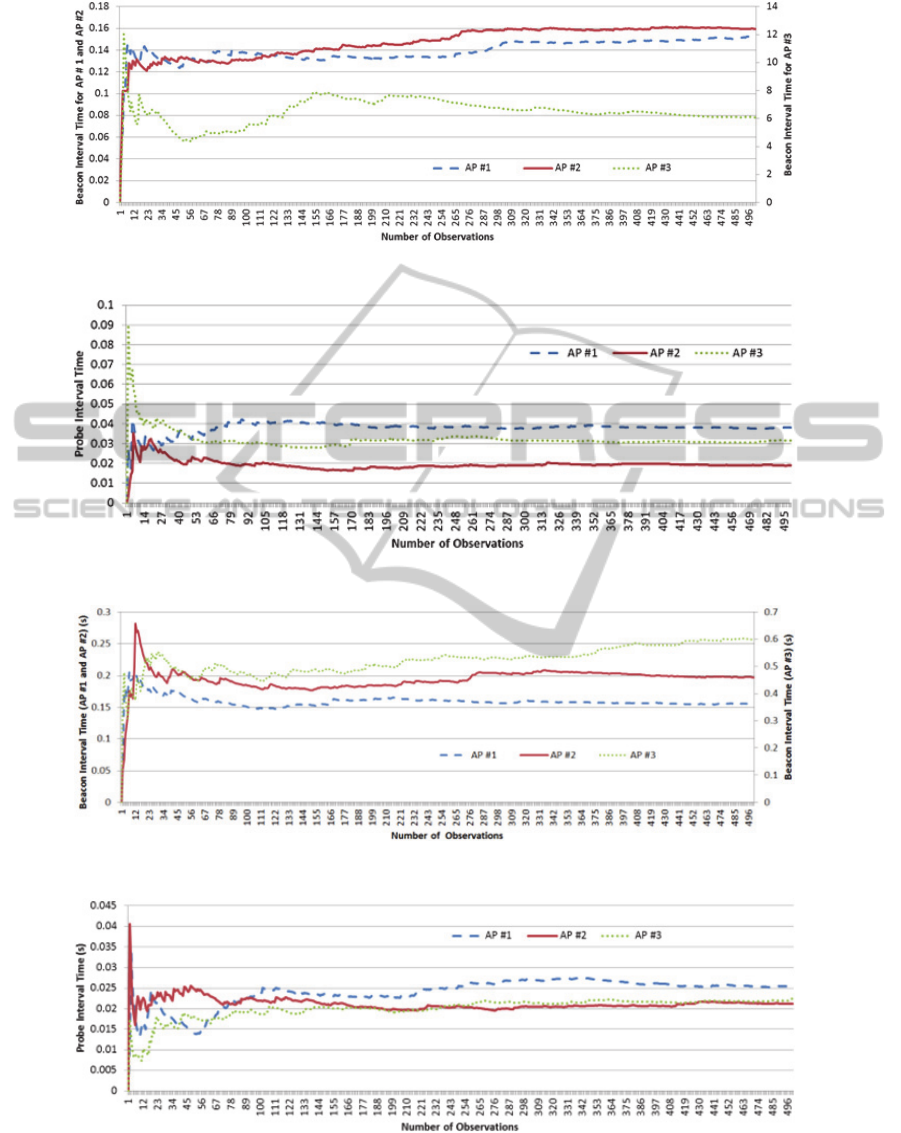
Figure 2: Beaco interval average (s) trace for each AP monitored at MS#1.
Figure 3: Probe exchange interval average (s) trace for each AP monitored at MS#1.
Figure 4: Beacon interval average trace for each AP monitored at MS#2.
Figure 4: Probe exchange interval average (s) trace for each AP monitored at MS#2.
Beacon intervals and Probe Exchange time intervals
over the first 500 observations (i.e. captured frames)
for MS#1 in the K1 dataset. The first conclusion
from the data is that beacons present a high degree
of variance. This is attributed to their constant
broadcast nature making them more sensitive to
SECRYPT2013-InternationalConferenceonSecurityandCryptography
490

interference. Probe information is very stable which
is attributed to their scarcity relative to beacon
frames. Since probe frames are less frequent than
beacons, their transmission over the air is less likely
to coincide with impulse interference.
Comparing Figures 2 and 3 (MS#1) to Figures 4
and 5 (MS#2) it is observed that although the
average values are different, the general
characteristics for each frame type are consistent, i.e.
the frame averages display a settling time, followed
by a smoothly changing average which may overlap
with other observed averages for other APs at
different times. This confirms that these attributes
can be tracked over time and that they are not the
same at all observation locations.
3 ALGORITHM DEVELOPMENT
From Figures 2-5 it is possible to visually
differentiate between each of the APs and each
observation location (MS). However reliance on
visual distinction could result in disagreement
between different observers as to what constitutes
legitimate separation between the APs. A more
reliable, repeatable and programmable method is
applied here to systematically determine the
distinction between the AP frame averages.
3.1 Training Period Estimation
Each of the averages in Figures 2-5 exhibits a
training period, after which minor outliers will have
been absorbed and a settled mean is achieved. Once
the end of this period has been reached then the trace
stabilises and exhibits smooth transitions. This
interference is considered distinct from that removed
by the (>60s) outlier threshold outlined previously.
The less extreme transitions may reflect changes in
client loading or the state of the network
environment such as greater footfall acting as
reflectors. The training period is governed by the
following algorithm:
1. Calculate the current “running” mean and
standard deviation of the intervals observed,
2. Establish the maximum and minimum limits of
accuracy for training period (here they are
chosen as 10% of the standard deviation),
3. If the running mean is observed as being within
the training bounds for 10 consecutive
observations, the training period is deemed to
have ended.
The values of 10% for the accuracy of the standard
deviation and 10 consecutive observations of
conformity are applied here based on human
observations of multiple traces. The impact of
varying this value has been investigated and the
choice of 10% and 10 observations closely matches
visual estimations. While this continues to introduce
human error, since an observer could select 11%
rather than 10% or 20 rather than 10 observations
and get different results, this approach instead
reduces the debate to accuracy rather than
repeatability.
Table 2: Training Period Estimation for MS#1,MS#2.
(OC: Observations until Cut-Off, TS: Timeframe until
Settle).
Beacon
MS#1 MS#2
#OC TS (s) #OC TS (s)
AP #1 85 14.37 44 7.57
AP#2 47 8.33 43 9.40
AP#3 63 425.47 43 28.59
Probe
MS#1 MS#2
#OC TS (s) #OC TS (s)
AP #1 53 90.8 90 102.71
AP#2 55 47.18 46 43.77
AP#3 181 257.18 54 54.53
Applying this algorithm to the traffic for MS#1
and MS#2 produces Table 2, which outlines the
estimated end-point of the training times for each
AP. These training times are exclusive to this dataset
and collection time however this process can be
applied to other datasets or APs. Thus is more
flexible and reliable than using human estimation.
Each of the AP mean interval traces for each MS
exhibits a unique settling point after a set amount of
observations. The range of this observation value
can extend from as few as 47 and as many as 181
depending on the relative stability of the averages
observed. An anticipated time until these numbers of
observations are achieved is given in Table 2, based
on the average observation rate at each AP. This
indicates that the beacon rate settling is relatively
prompt due to the high frequency of the packets
whilst probe rate settling takes longer.
3.2 Distinction Period Estimation
The end of the training period establishes the
number of observations after which the AP averages
can be considered stable. Due to the possibility of
drift however it is not necessarily the case that APs
can be distinguished at all times, so identity may not
be available at all times. The algorithm employed to
determine AP distinction is:
1. Determine the upper and lower limits for the
DevelopmentofDeviceIdentityusingWiFiLayer2ManagementFramesforCombatingRogueAPs
491

mean of each AP by adding and subtracting a
proportion of the current standard deviation from
it (10% here),
2. If the upper bound for AP1 is below the lower
bound of AP2 then they are distinct at that
observation,
3. Alternatively, if the lower bound for AP1 is
above the upper bound of AP2 then they are
distinct at that observation,
4. If the AP under consideration is both settled and
distinct from all other APs under test then
identity is considered to be prescribed for that
AP at that time for that observation location.
This process provides a quantifiable means of
determining if APs are distinguishable and over
what percentage of the operating time, which is
shown in Table 3. The information in the table
indicates that the APs can be distinguished for up to
99% of the total observations for both probes and
beacons. The distinction results are less impressive
for probe exchanges, for which the ability to
separate the APs drops to as low as 12% for AP#2 -
AP#3 in MS#2. This indicates that some locations
may exhibit black spots for frame reception.
Table 3: Identity Availability for MS#1 and MS#2.
(PID: Prescribed
IDentity)
MS#1 MS#2
B’con Probe B’con Probe
First Observation
with PID
85 181 44 102
AP 1–2 PID
Time (%)
75.75 99.06 99.81 92.75
AP 1–3 PID
Time (%)
99.94 47.43 99.93 94.8
AP 2–3 PID
Time (%)
99.94 99.94 99.93 12.3
The disparity in the distinction results for MS#1
and MS#2 in Table 3 shows that difference in
placement location plays a key role in the
application of this identity system. The observation
locations of MS#1 and MS#2 are quite close in
proximity yet the orientation difference between the
two provides sufficiently different data to allow
identity prescription. This indicates that searching
for a suitable location within the deployment
environment has a critical effect on the ability to
prescribe identity. Investigations of how to select
these positions are considered for future work.
Combination of more than one detector in an
environment would bypass this deficiency, as shown
by the different performance levels per MS location.
Each of the routers tested have been produced by
a different manufacturer. The authors have no reason
to believe that any devices exist for which this
technique does not apply, although testing is
necessarily limited by the environment available.
The testing environment is believed to be a typical
representation of open access networking
environments and hence the results from this work
should be broadly applicable.
3.3 Rogue AP Discussion
This experiment demonstrates that live network
environments contain subtleties in traffic reception
that can be used for security research. Due to the
live, operational nature of the network under test it
was not possible to obtain permission to carry out a
Rogue AP attack at this location. Nonetheless the
information available provides insight into the
effectiveness of the system under Rogue AP attack.
The beaconing rates for each of the APs in
Figures 2-5 are set to 100ms intervals. Each device
is attempting to broadcast beacons at precisely this
interval, however due to processing and channel
characteristics they exhibit unique traffic deviations
from the viewpoint of any connected client.
Over both monitoring locations (MS#1 or MS
#2) the distinction level between these APs was
discernible between 75% and 99% of the testing
time. This is in spite of the mean values for Figures
2-5 for APs 1 and 2 being visually very similar. This
demonstrates that small differences in beaconing
interval are perpetuated over time and are an
identifying factor of the device itself.
A similar feature can be attributed to probe
exchange intervals. For every AP, probe responses
will be replied to as soon as possible, rather than at a
set rate (as with beacons). This is more likely to be
susceptible to variation due to loading in the AP,
since processing will slow as additional tasks need
to be carried out concurrently, e.g. serving multiple
connected clients. It is particularly evident in Figure
3 that these response levels are quite different and
stable over time, allowing for minor fluctuations.
The identity system proposed here would be very
difficult for a knowledgeable attacker (one who
knows the detection criteria) to combat. It has been
demonstrated here that location plays a key role in
the observed identity characteristics. It would be
very difficult for any Rogue AP to masquerade this
information, as they would have to be in exactly the
same physical position as the legitimate AP. Even
were this to be achieved, the differences in frame
processing of different manufacturers would need to
be discovered and masqueraded as well. At worst
this raises the bar for potential Rogue AP attacks.
In practice a client could employ this technique
SECRYPT2013-InternationalConferenceonSecurityandCryptography
492

to detect Rogue APs using the following method: 1)
Client connects to a legitimate AP, 2) After the
training time has bypassed the client has created the
AP fingerprint, 3) Should a Rogue AP now appear,
the client will be able to distinguish the new
fingerprint even if the Rogue AP masquerades all
available attributes of the legitimate AP.
This process would have to be carried out every
time a client connects to an AP, even if the
fingerprint has been previously known. Only one
visit to an AP is required to generate the fingerprint,
however due to the channel characteristics changing
with location and time they must be generated on
every new connection. Accounting for user mobility
remains for future work. This technique could be
used in addition to alternative Rogue AP detection
techniques to improve detection confidence.
4 CONCLUSIONS
Rogue APs present a significant threat to public
WiFi infrastructures and their users, which current
detection systems aim to defeat by monitoring
differences in RSSI. These systems are shown to be
insufficient by other research works. This work
presents a new method of determining identification
for WiFi APs, employing a combination of WiFi
packet average intervals for beacons and probe
exchanges to gauge identifying averages for APs.
This layer 2 information has been shown to be
received differently at different distances and
orientations to the source of the traffic, which can be
used to attribute identity to a specific AP from that
collection location.
The fingerprinting technique employed here is
dependent on two characteristics, 1) AP – user
channel and 2) Internal AP processing. Assessing
the relative contribution to fingerprinting of these
two attributes remains for future work. Attribution
of this identity system has been shown to be
available in a live location for up to 99% of
operational lifetime potentially within 9 seconds of
client-AP connection.
ACKNOWLEDGEMENTS
The authors gratefully acknowledge the assistance of
EPRSC (grant number EP/H004793/1), Sunway
University (grant number INT-SCT-0111-03) and
Sunway Pyramid management.
REFERENCES
Beyah, R., et al., 2004, Rogue Access Point Detection
using Temporal Traffic Characteristics. In
GLOBECOM ’04, IEEE Global Telecommunications
Conference.
Beyah, R., Venkataraman, A., 2011. Rogue Access Point
Detection: Challenges, Solutions and Future
Directions. IEEE Journal of Security & Privacy (9/5),
pp. 56-61.
Faria, D. B., Cheriton, D. R., 2006. Detecting Identity-
Based Attacks in Wireless Networks Using
Signalprints. In 5th ACM Workshop on Wireless
Security.
Franklin, J., et al., 2006. Passive Data Link Layer 802.11
Wireless Device Driver Fingerprinting. In 15th
USENIX Security Symposium.
Ma, L., et al., 2007. RAP: Protecting Commodity WiFi
Networks from Rogue Access Points. In 4
th
Intl. Conf.
on Heterogeneous Networking for Quality, Reliability,
Security and Robustness & Workshops.
Ma L., et al., 2008. A Hybrid Rogue Access Point
Protection Framework for Commodity WiFi
Networks. In INFOCOM ’08, 27th Intl. Conf. on
Computer Communications.
Milliken, J., Marshall, A., 2012. Design and Analysis of
an Independent, Layer 2, Open-Access WiFi
Monitoring Infrastructure in the Wild. In ICWN ’12,
International Conference on Wireless Networks.
Milliken, J., et al., 2012. The Effect of Probe Interval
Estimation on Attack Detection Performance of a
WLAN Independent Intrusion Detection System. In
ICWCA ’12, International Conference on Wireless
Communications and Applications.
Nagarajan, V., et al., 2010. Using Power Hoping to
Counter MAC Spoofing Attacks in WLAN. In 7th
IEEE Consumer Communications and Networking
Conference.
Percoco N. J., 2010. Trustwave Global Security Report
2010. Trustwave, Chicago, USA Shetty, S., et al.,
2007. Rogue Access Point Detection By Analysing
Networking Traffic Characteristics. In MILCOM ’07,
IEEE Military Conference.
Shivaraj, G., et al., 2008. A Hidden Markov Model Based
Approach to Detect Rogue Access Points. In
MILCOM ‘08, IEEE Military Conference.
Tao, Z., et al., 2008. X-mode: A real Time Approach of
Discriminating WiFi Networking Impersonators. In
NWESP ’08, 4th International Conference on Next
Generation Web Services Practices.
DevelopmentofDeviceIdentityusingWiFiLayer2ManagementFramesforCombatingRogueAPs
493
